0001601712false2020FY100016017122020-01-012020-12-310001601712us-gaap:CommonStockMember2020-01-012020-12-310001601712us-gaap:SeriesAPreferredStockMember2020-01-012020-12-31iso4217:USD00016017122020-06-30xbrli:shares00016017122021-02-0800016017122019-01-012019-12-3100016017122018-01-012018-12-310001601712us-gaap:VariableInterestEntityPrimaryBeneficiaryMember2020-01-012020-12-310001601712us-gaap:VariableInterestEntityPrimaryBeneficiaryMember2019-01-012019-12-310001601712us-gaap:VariableInterestEntityPrimaryBeneficiaryMember2018-01-012018-12-31iso4217:USDxbrli:shares00016017122020-12-3100016017122019-12-310001601712syf:UnsecuritizedLoansHeldforInvestmentMember2020-12-310001601712syf:UnsecuritizedLoansHeldforInvestmentMember2019-12-310001601712us-gaap:VariableInterestEntityPrimaryBeneficiaryMember2020-12-310001601712us-gaap:VariableInterestEntityPrimaryBeneficiaryMember2019-12-310001601712us-gaap:PreferredStockMember2017-12-310001601712us-gaap:CommonStockMember2017-12-310001601712us-gaap:AdditionalPaidInCapitalMember2017-12-310001601712us-gaap:RetainedEarningsMember2017-12-310001601712us-gaap:AccumulatedOtherComprehensiveIncomeMember2017-12-310001601712us-gaap:TreasuryStockCommonMember2017-12-3100016017122017-12-310001601712us-gaap:RetainedEarningsMember2018-01-012018-12-310001601712us-gaap:AccumulatedOtherComprehensiveIncomeMember2018-01-012018-12-310001601712us-gaap:TreasuryStockCommonMember2018-01-012018-12-310001601712us-gaap:CommonStockMember2018-01-012018-12-310001601712us-gaap:AdditionalPaidInCapitalMember2018-01-012018-12-310001601712us-gaap:PreferredStockMember2018-12-310001601712us-gaap:CommonStockMember2018-12-310001601712us-gaap:AdditionalPaidInCapitalMember2018-12-310001601712us-gaap:RetainedEarningsMember2018-12-310001601712us-gaap:AccumulatedOtherComprehensiveIncomeMember2018-12-310001601712us-gaap:TreasuryStockCommonMember2018-12-3100016017122018-12-310001601712us-gaap:RetainedEarningsMember2019-01-012019-12-310001601712us-gaap:AccumulatedOtherComprehensiveIncomeMember2019-01-012019-12-310001601712us-gaap:PreferredStockMember2019-01-012019-12-310001601712us-gaap:TreasuryStockCommonMember2019-01-012019-12-310001601712us-gaap:CommonStockMember2019-01-012019-12-310001601712us-gaap:AdditionalPaidInCapitalMember2019-01-012019-12-310001601712us-gaap:PreferredStockMember2019-12-310001601712us-gaap:CommonStockMember2019-12-310001601712us-gaap:AdditionalPaidInCapitalMember2019-12-310001601712us-gaap:RetainedEarningsMember2019-12-310001601712us-gaap:AccumulatedOtherComprehensiveIncomeMember2019-12-310001601712us-gaap:TreasuryStockCommonMember2019-12-310001601712us-gaap:AccountingStandardsUpdate201613Membersrt:CumulativeEffectPeriodOfAdoptionAdjustmentMemberus-gaap:RetainedEarningsMember2019-12-310001601712us-gaap:AccountingStandardsUpdate201613Membersrt:CumulativeEffectPeriodOfAdoptionAdjustmentMember2019-12-310001601712us-gaap:RetainedEarningsMembersrt:CumulativeEffectPeriodOfAdoptionAdjustedBalanceMember2019-12-310001601712srt:CumulativeEffectPeriodOfAdoptionAdjustedBalanceMember2019-12-310001601712us-gaap:RetainedEarningsMember2020-01-012020-12-310001601712us-gaap:AccumulatedOtherComprehensiveIncomeMember2020-01-012020-12-310001601712us-gaap:TreasuryStockCommonMember2020-01-012020-12-310001601712us-gaap:CommonStockMember2020-01-012020-12-310001601712us-gaap:AdditionalPaidInCapitalMember2020-01-012020-12-310001601712us-gaap:PreferredStockMember2020-12-310001601712us-gaap:CommonStockMember2020-12-310001601712us-gaap:AdditionalPaidInCapitalMember2020-12-310001601712us-gaap:RetainedEarningsMember2020-12-310001601712us-gaap:AccumulatedOtherComprehensiveIncomeMember2020-12-310001601712us-gaap:TreasuryStockCommonMember2020-12-310001601712us-gaap:AccountingStandardsUpdate201613Member2020-01-010001601712us-gaap:AccountingStandardsUpdate201613Membersrt:CumulativeEffectPeriodOfAdoptionAdjustmentMember2020-01-01syf:sales_platform0001601712srt:MaximumMember2020-01-012020-12-31syf:payment0001601712syf:UnsecuredConsumerandSecuredbyCollateralMember2020-12-310001601712us-gaap:UncollateralizedMember2020-12-310001601712syf:UnsecuredConsumerinBankruptcyMember2020-12-310001601712syf:CreditCardReceivableDeceasedAccountHoldersMember2020-12-310001601712us-gaap:CreditCardReceivablesMember2020-01-012020-12-310001601712syf:NonCreditCardLoanMember2020-01-012020-12-31syf:segment0001601712us-gaap:USGovernmentCorporationsAndAgenciesSecuritiesMember2020-12-310001601712us-gaap:USGovernmentCorporationsAndAgenciesSecuritiesMember2019-12-310001601712us-gaap:USStatesAndPoliticalSubdivisionsMember2020-12-310001601712us-gaap:USStatesAndPoliticalSubdivisionsMember2019-12-310001601712us-gaap:ResidentialMortgageBackedSecuritiesMember2020-12-310001601712us-gaap:ResidentialMortgageBackedSecuritiesMember2019-12-310001601712us-gaap:AssetBackedSecuritiesMember2020-12-310001601712us-gaap:AssetBackedSecuritiesMember2019-12-31xbrli:pure0001601712us-gaap:CreditCardReceivablesMember2020-12-310001601712us-gaap:CreditCardReceivablesMember2019-12-310001601712us-gaap:ConsumerLoanMember2020-12-310001601712us-gaap:ConsumerLoanMember2019-12-310001601712us-gaap:CommercialPortfolioSegmentMember2020-12-310001601712us-gaap:CommercialPortfolioSegmentMember2019-12-310001601712us-gaap:UnallocatedFinancingReceivablesMember2020-12-310001601712us-gaap:UnallocatedFinancingReceivablesMember2019-12-310001601712syf:WalmartMember2020-01-012020-12-310001601712us-gaap:AccountingStandardsUpdate201613Memberus-gaap:CreditCardReceivablesMember2020-01-010001601712us-gaap:CreditCardReceivablesMember2020-01-010001601712us-gaap:AccountingStandardsUpdate201613Memberus-gaap:ConsumerLoanMember2020-01-010001601712us-gaap:ConsumerLoanMember2020-01-010001601712us-gaap:ConsumerLoanMember2020-01-012020-12-310001601712us-gaap:AccountingStandardsUpdate201613Memberus-gaap:CommercialPortfolioSegmentMember2020-01-010001601712us-gaap:CommercialPortfolioSegmentMember2020-01-010001601712us-gaap:CommercialPortfolioSegmentMember2020-01-012020-12-310001601712us-gaap:AccountingStandardsUpdate201613Memberus-gaap:UnallocatedFinancingReceivablesMember2020-01-010001601712us-gaap:UnallocatedFinancingReceivablesMember2020-01-010001601712us-gaap:UnallocatedFinancingReceivablesMember2020-01-012020-12-3100016017122020-01-010001601712us-gaap:CreditCardReceivablesMember2018-12-310001601712us-gaap:CreditCardReceivablesMember2019-01-012019-12-310001601712us-gaap:ConsumerLoanMember2018-12-310001601712us-gaap:ConsumerLoanMember2019-01-012019-12-310001601712us-gaap:CommercialPortfolioSegmentMember2018-12-310001601712us-gaap:CommercialPortfolioSegmentMember2019-01-012019-12-310001601712us-gaap:UnallocatedFinancingReceivablesMember2018-12-310001601712us-gaap:UnallocatedFinancingReceivablesMember2019-01-012019-12-310001601712us-gaap:CreditCardReceivablesMember2017-12-310001601712us-gaap:CreditCardReceivablesMember2018-01-012018-12-310001601712us-gaap:ConsumerLoanMember2017-12-310001601712us-gaap:ConsumerLoanMember2018-01-012018-12-310001601712us-gaap:CommercialPortfolioSegmentMember2017-12-310001601712us-gaap:CommercialPortfolioSegmentMember2018-01-012018-12-310001601712us-gaap:UnallocatedFinancingReceivablesMember2017-12-310001601712us-gaap:UnallocatedFinancingReceivablesMember2018-01-012018-12-310001601712us-gaap:CreditCardReceivablesMembersyf:FinancingReceivables30to89DaysPastDueMember2020-12-310001601712us-gaap:FinancingReceivablesEqualToGreaterThan90DaysPastDueMemberus-gaap:CreditCardReceivablesMember2020-12-310001601712us-gaap:ConsumerLoanMembersyf:FinancingReceivables30to89DaysPastDueMember2020-12-310001601712us-gaap:FinancingReceivablesEqualToGreaterThan90DaysPastDueMemberus-gaap:ConsumerLoanMember2020-12-310001601712syf:FinancingReceivables30to89DaysPastDueMemberus-gaap:CommercialPortfolioSegmentMember2020-12-310001601712us-gaap:FinancingReceivablesEqualToGreaterThan90DaysPastDueMemberus-gaap:CommercialPortfolioSegmentMember2020-12-310001601712syf:FinancingReceivables30to89DaysPastDueMember2020-12-310001601712us-gaap:FinancingReceivablesEqualToGreaterThan90DaysPastDueMember2020-12-310001601712us-gaap:CreditCardReceivablesMembersyf:FinancingReceivables30to89DaysPastDueMember2019-12-310001601712us-gaap:FinancingReceivablesEqualToGreaterThan90DaysPastDueMemberus-gaap:CreditCardReceivablesMember2019-12-310001601712us-gaap:ConsumerLoanMembersyf:FinancingReceivables30to89DaysPastDueMember2019-12-310001601712us-gaap:FinancingReceivablesEqualToGreaterThan90DaysPastDueMemberus-gaap:ConsumerLoanMember2019-12-310001601712syf:FinancingReceivables30to89DaysPastDueMemberus-gaap:CommercialPortfolioSegmentMember2019-12-310001601712us-gaap:FinancingReceivablesEqualToGreaterThan90DaysPastDueMemberus-gaap:CommercialPortfolioSegmentMember2019-12-310001601712syf:FinancingReceivables30to89DaysPastDueMember2019-12-310001601712us-gaap:FinancingReceivablesEqualToGreaterThan90DaysPastDueMember2019-12-31syf:contract0001601712us-gaap:CreditCardReceivablesMembersyf:SixHundredAndFiftyOneOrHigherMember2020-12-310001601712us-gaap:CreditCardReceivablesMembersyf:FiveHundredAndNinetyOneToSixHundredAndFiftyMember2020-12-310001601712syf:FiveHundredAndNinetyOrLessMemberus-gaap:CreditCardReceivablesMember2020-12-310001601712us-gaap:CreditCardReceivablesMembersyf:SixHundredAndFiftyOneOrHigherMember2019-12-310001601712us-gaap:CreditCardReceivablesMembersyf:FiveHundredAndNinetyOneToSixHundredAndFiftyMember2019-12-310001601712syf:FiveHundredAndNinetyOrLessMemberus-gaap:CreditCardReceivablesMember2019-12-310001601712us-gaap:ConsumerLoanMembersyf:SixHundredAndFiftyOneOrHigherMember2020-12-310001601712us-gaap:ConsumerLoanMembersyf:FiveHundredAndNinetyOneToSixHundredAndFiftyMember2020-12-310001601712us-gaap:ConsumerLoanMembersyf:FiveHundredAndNinetyOrLessMember2020-12-310001601712us-gaap:ConsumerLoanMembersyf:SixHundredAndFiftyOneOrHigherMember2019-12-310001601712us-gaap:ConsumerLoanMembersyf:FiveHundredAndNinetyOneToSixHundredAndFiftyMember2019-12-310001601712us-gaap:ConsumerLoanMembersyf:FiveHundredAndNinetyOrLessMember2019-12-310001601712us-gaap:CommercialPortfolioSegmentMembersyf:SixHundredAndFiftyOneOrHigherMember2020-12-310001601712syf:FiveHundredAndNinetyOneToSixHundredAndFiftyMemberus-gaap:CommercialPortfolioSegmentMember2020-12-310001601712syf:FiveHundredAndNinetyOrLessMemberus-gaap:CommercialPortfolioSegmentMember2020-12-310001601712us-gaap:CommercialPortfolioSegmentMembersyf:SixHundredAndFiftyOneOrHigherMember2019-12-310001601712syf:FiveHundredAndNinetyOneToSixHundredAndFiftyMemberus-gaap:CommercialPortfolioSegmentMember2019-12-310001601712syf:FiveHundredAndNinetyOrLessMemberus-gaap:CommercialPortfolioSegmentMember2019-12-310001601712us-gaap:OtherAssetsMemberus-gaap:VariableInterestEntityPrimaryBeneficiaryMember2020-12-310001601712us-gaap:OtherAssetsMemberus-gaap:VariableInterestEntityPrimaryBeneficiaryMember2019-12-310001601712us-gaap:CustomerRelatedIntangibleAssetsMember2020-12-310001601712us-gaap:CustomerRelatedIntangibleAssetsMember2019-12-310001601712us-gaap:ComputerSoftwareIntangibleAssetMember2020-12-310001601712us-gaap:ComputerSoftwareIntangibleAssetMember2019-12-310001601712us-gaap:CustomerRelatedIntangibleAssetsMember2020-01-012020-12-310001601712us-gaap:CustomerRelatedIntangibleAssetsMember2019-01-012019-12-310001601712us-gaap:SellingAndMarketingExpenseMemberus-gaap:CustomerContractsMember2020-01-012020-12-310001601712us-gaap:SellingAndMarketingExpenseMemberus-gaap:CustomerContractsMember2019-01-012019-12-310001601712us-gaap:SellingAndMarketingExpenseMemberus-gaap:CustomerContractsMember2018-01-012018-12-310001601712syf:FiniteLivedIntangibleAssetsExcludingCustomerContractsMemberus-gaap:OtherExpenseMember2020-01-012020-12-310001601712syf:FiniteLivedIntangibleAssetsExcludingCustomerContractsMemberus-gaap:OtherExpenseMember2019-01-012019-12-310001601712syf:FiniteLivedIntangibleAssetsExcludingCustomerContractsMemberus-gaap:OtherExpenseMember2018-01-012018-12-310001601712syf:ProgramArrangerMember2020-12-310001601712us-gaap:VariableInterestEntityPrimaryBeneficiaryMembersrt:MinimumMembersyf:FixedSecuritizedBorrowingsMember2020-12-310001601712us-gaap:VariableInterestEntityPrimaryBeneficiaryMembersyf:FixedSecuritizedBorrowingsMembersrt:MaximumMember2020-12-310001601712us-gaap:VariableInterestEntityPrimaryBeneficiaryMembersyf:FixedSecuritizedBorrowingsMember2020-12-310001601712us-gaap:VariableInterestEntityPrimaryBeneficiaryMembersyf:FixedSecuritizedBorrowingsMember2019-12-310001601712us-gaap:VariableInterestEntityPrimaryBeneficiaryMembersrt:MinimumMembersyf:FloatingSecuritizedBorrowingsMember2020-12-310001601712us-gaap:VariableInterestEntityPrimaryBeneficiaryMembersyf:FloatingSecuritizedBorrowingsMembersrt:MaximumMember2020-12-310001601712us-gaap:VariableInterestEntityPrimaryBeneficiaryMembersyf:FloatingSecuritizedBorrowingsMember2020-12-310001601712us-gaap:VariableInterestEntityPrimaryBeneficiaryMembersyf:FloatingSecuritizedBorrowingsMember2019-12-310001601712us-gaap:SeniorNotesMembersrt:MinimumMembersyf:FixedSeniorUnsecuredNotesMember2020-12-310001601712us-gaap:SeniorNotesMembersrt:MaximumMembersyf:FixedSeniorUnsecuredNotesMember2020-12-310001601712us-gaap:SeniorNotesMembersyf:FixedSeniorUnsecuredNotesMember2020-12-310001601712us-gaap:SeniorNotesMembersyf:FixedSeniorUnsecuredNotesMember2019-12-310001601712syf:FloatingSeniorSecuredNotesMemberus-gaap:SeniorNotesMember2020-12-310001601712syf:FloatingSeniorSecuredNotesMemberus-gaap:SeniorNotesMember2019-12-310001601712us-gaap:SeniorNotesMembersrt:MinimumMembersyf:FixedSeniorUnsecuredNotesMembersrt:SubsidiariesMember2020-12-310001601712us-gaap:SeniorNotesMembersrt:MaximumMembersyf:FixedSeniorUnsecuredNotesMembersrt:SubsidiariesMember2020-12-310001601712us-gaap:SeniorNotesMembersyf:FixedSeniorUnsecuredNotesMembersrt:SubsidiariesMember2020-12-310001601712us-gaap:SeniorNotesMembersyf:FixedSeniorUnsecuredNotesMembersrt:SubsidiariesMember2019-12-310001601712syf:FloatingSeniorSecuredNotesMemberus-gaap:SeniorNotesMembersrt:SubsidiariesMember2020-12-310001601712syf:FloatingSeniorSecuredNotesMemberus-gaap:SeniorNotesMembersrt:SubsidiariesMember2019-12-310001601712us-gaap:SeniorNotesMember2020-12-310001601712us-gaap:SeniorNotesMember2019-12-310001601712us-gaap:UnsecuredDebtMemberus-gaap:RevolvingCreditFacilityMember2020-12-310001601712us-gaap:FairValueInputsLevel1Memberus-gaap:FairValueMeasurementsRecurringMemberus-gaap:USGovernmentCorporationsAndAgenciesSecuritiesMember2020-12-310001601712us-gaap:FairValueInputsLevel2Memberus-gaap:FairValueMeasurementsRecurringMemberus-gaap:USGovernmentCorporationsAndAgenciesSecuritiesMember2020-12-310001601712us-gaap:FairValueInputsLevel3Memberus-gaap:FairValueMeasurementsRecurringMemberus-gaap:USGovernmentCorporationsAndAgenciesSecuritiesMember2020-12-310001601712us-gaap:FairValueMeasurementsRecurringMemberus-gaap:USGovernmentCorporationsAndAgenciesSecuritiesMember2020-12-310001601712us-gaap:USStatesAndPoliticalSubdivisionsMemberus-gaap:FairValueInputsLevel1Memberus-gaap:FairValueMeasurementsRecurringMember2020-12-310001601712us-gaap:FairValueInputsLevel2Memberus-gaap:USStatesAndPoliticalSubdivisionsMemberus-gaap:FairValueMeasurementsRecurringMember2020-12-310001601712us-gaap:FairValueInputsLevel3Memberus-gaap:USStatesAndPoliticalSubdivisionsMemberus-gaap:FairValueMeasurementsRecurringMember2020-12-310001601712us-gaap:USStatesAndPoliticalSubdivisionsMemberus-gaap:FairValueMeasurementsRecurringMember2020-12-310001601712us-gaap:FairValueInputsLevel1Memberus-gaap:FairValueMeasurementsRecurringMemberus-gaap:ResidentialMortgageBackedSecuritiesMember2020-12-310001601712us-gaap:FairValueInputsLevel2Memberus-gaap:FairValueMeasurementsRecurringMemberus-gaap:ResidentialMortgageBackedSecuritiesMember2020-12-310001601712us-gaap:FairValueInputsLevel3Memberus-gaap:FairValueMeasurementsRecurringMemberus-gaap:ResidentialMortgageBackedSecuritiesMember2020-12-310001601712us-gaap:FairValueMeasurementsRecurringMemberus-gaap:ResidentialMortgageBackedSecuritiesMember2020-12-310001601712us-gaap:FairValueInputsLevel1Memberus-gaap:FairValueMeasurementsRecurringMemberus-gaap:AssetBackedSecuritiesMember2020-12-310001601712us-gaap:FairValueInputsLevel2Memberus-gaap:FairValueMeasurementsRecurringMemberus-gaap:AssetBackedSecuritiesMember2020-12-310001601712us-gaap:FairValueInputsLevel3Memberus-gaap:FairValueMeasurementsRecurringMemberus-gaap:AssetBackedSecuritiesMember2020-12-310001601712us-gaap:FairValueMeasurementsRecurringMemberus-gaap:AssetBackedSecuritiesMember2020-12-310001601712us-gaap:FairValueInputsLevel1Memberus-gaap:FairValueMeasurementsRecurringMember2020-12-310001601712us-gaap:FairValueInputsLevel2Memberus-gaap:FairValueMeasurementsRecurringMember2020-12-310001601712us-gaap:FairValueInputsLevel3Memberus-gaap:FairValueMeasurementsRecurringMember2020-12-310001601712us-gaap:FairValueMeasurementsRecurringMember2020-12-310001601712us-gaap:FairValueInputsLevel1Memberus-gaap:FairValueMeasurementsRecurringMemberus-gaap:USGovernmentCorporationsAndAgenciesSecuritiesMember2019-12-310001601712us-gaap:FairValueInputsLevel2Memberus-gaap:FairValueMeasurementsRecurringMemberus-gaap:USGovernmentCorporationsAndAgenciesSecuritiesMember2019-12-310001601712us-gaap:FairValueInputsLevel3Memberus-gaap:FairValueMeasurementsRecurringMemberus-gaap:USGovernmentCorporationsAndAgenciesSecuritiesMember2019-12-310001601712us-gaap:FairValueMeasurementsRecurringMemberus-gaap:USGovernmentCorporationsAndAgenciesSecuritiesMember2019-12-310001601712us-gaap:USStatesAndPoliticalSubdivisionsMemberus-gaap:FairValueInputsLevel1Memberus-gaap:FairValueMeasurementsRecurringMember2019-12-310001601712us-gaap:FairValueInputsLevel2Memberus-gaap:USStatesAndPoliticalSubdivisionsMemberus-gaap:FairValueMeasurementsRecurringMember2019-12-310001601712us-gaap:FairValueInputsLevel3Memberus-gaap:USStatesAndPoliticalSubdivisionsMemberus-gaap:FairValueMeasurementsRecurringMember2019-12-310001601712us-gaap:USStatesAndPoliticalSubdivisionsMemberus-gaap:FairValueMeasurementsRecurringMember2019-12-310001601712us-gaap:FairValueInputsLevel1Memberus-gaap:FairValueMeasurementsRecurringMemberus-gaap:ResidentialMortgageBackedSecuritiesMember2019-12-310001601712us-gaap:FairValueInputsLevel2Memberus-gaap:FairValueMeasurementsRecurringMemberus-gaap:ResidentialMortgageBackedSecuritiesMember2019-12-310001601712us-gaap:FairValueInputsLevel3Memberus-gaap:FairValueMeasurementsRecurringMemberus-gaap:ResidentialMortgageBackedSecuritiesMember2019-12-310001601712us-gaap:FairValueMeasurementsRecurringMemberus-gaap:ResidentialMortgageBackedSecuritiesMember2019-12-310001601712us-gaap:FairValueInputsLevel1Memberus-gaap:FairValueMeasurementsRecurringMemberus-gaap:AssetBackedSecuritiesMember2019-12-310001601712us-gaap:FairValueInputsLevel2Memberus-gaap:FairValueMeasurementsRecurringMemberus-gaap:AssetBackedSecuritiesMember2019-12-310001601712us-gaap:FairValueInputsLevel3Memberus-gaap:FairValueMeasurementsRecurringMemberus-gaap:AssetBackedSecuritiesMember2019-12-310001601712us-gaap:FairValueMeasurementsRecurringMemberus-gaap:AssetBackedSecuritiesMember2019-12-310001601712us-gaap:FairValueInputsLevel1Memberus-gaap:FairValueMeasurementsRecurringMember2019-12-310001601712us-gaap:FairValueInputsLevel2Memberus-gaap:FairValueMeasurementsRecurringMember2019-12-310001601712us-gaap:FairValueInputsLevel3Memberus-gaap:FairValueMeasurementsRecurringMember2019-12-310001601712us-gaap:FairValueMeasurementsRecurringMember2019-12-310001601712syf:RevenuemilestoneminimumamountMember2020-12-310001601712syf:RevenuemilestonemaximumamountMember2020-12-310001601712us-gaap:CarryingReportedAmountFairValueDisclosureMember2020-12-310001601712us-gaap:EstimateOfFairValueFairValueDisclosureMember2020-12-310001601712us-gaap:FairValueInputsLevel1Member2020-12-310001601712us-gaap:FairValueInputsLevel2Member2020-12-310001601712us-gaap:FairValueInputsLevel3Member2020-12-310001601712us-gaap:VariableInterestEntityPrimaryBeneficiaryMemberus-gaap:CarryingReportedAmountFairValueDisclosureMember2020-12-310001601712us-gaap:VariableInterestEntityPrimaryBeneficiaryMemberus-gaap:EstimateOfFairValueFairValueDisclosureMember2020-12-310001601712us-gaap:VariableInterestEntityPrimaryBeneficiaryMemberus-gaap:FairValueInputsLevel1Member2020-12-310001601712us-gaap:FairValueInputsLevel2Memberus-gaap:VariableInterestEntityPrimaryBeneficiaryMember2020-12-310001601712us-gaap:VariableInterestEntityPrimaryBeneficiaryMemberus-gaap:FairValueInputsLevel3Member2020-12-310001601712us-gaap:SeniorNotesMemberus-gaap:CarryingReportedAmountFairValueDisclosureMember2020-12-310001601712us-gaap:SeniorNotesMemberus-gaap:EstimateOfFairValueFairValueDisclosureMember2020-12-310001601712us-gaap:SeniorNotesMemberus-gaap:FairValueInputsLevel1Member2020-12-310001601712us-gaap:FairValueInputsLevel2Memberus-gaap:SeniorNotesMember2020-12-310001601712us-gaap:SeniorNotesMemberus-gaap:FairValueInputsLevel3Member2020-12-310001601712us-gaap:CarryingReportedAmountFairValueDisclosureMember2019-12-310001601712us-gaap:EstimateOfFairValueFairValueDisclosureMember2019-12-310001601712us-gaap:FairValueInputsLevel1Member2019-12-310001601712us-gaap:FairValueInputsLevel2Member2019-12-310001601712us-gaap:FairValueInputsLevel3Member2019-12-310001601712us-gaap:VariableInterestEntityPrimaryBeneficiaryMemberus-gaap:CarryingReportedAmountFairValueDisclosureMember2019-12-310001601712us-gaap:VariableInterestEntityPrimaryBeneficiaryMemberus-gaap:EstimateOfFairValueFairValueDisclosureMember2019-12-310001601712us-gaap:VariableInterestEntityPrimaryBeneficiaryMemberus-gaap:FairValueInputsLevel1Member2019-12-310001601712us-gaap:FairValueInputsLevel2Memberus-gaap:VariableInterestEntityPrimaryBeneficiaryMember2019-12-310001601712us-gaap:VariableInterestEntityPrimaryBeneficiaryMemberus-gaap:FairValueInputsLevel3Member2019-12-310001601712us-gaap:SeniorNotesMemberus-gaap:CarryingReportedAmountFairValueDisclosureMember2019-12-310001601712us-gaap:SeniorNotesMemberus-gaap:EstimateOfFairValueFairValueDisclosureMember2019-12-310001601712us-gaap:SeniorNotesMemberus-gaap:FairValueInputsLevel1Member2019-12-310001601712us-gaap:FairValueInputsLevel2Memberus-gaap:SeniorNotesMember2019-12-310001601712us-gaap:SeniorNotesMemberus-gaap:FairValueInputsLevel3Member2019-12-310001601712syf:BaselIIIMember2020-12-310001601712syf:BaselIIIMember2019-12-310001601712syf:BaselIIIMembersrt:SubsidiariesMember2020-12-310001601712syf:BaselIIIMembersrt:SubsidiariesMember2019-12-310001601712us-gaap:OtherLiabilitiesMembersrt:AffiliatedEntityMember2020-12-310001601712us-gaap:OtherLiabilitiesMembersrt:AffiliatedEntityMember2019-12-310001601712us-gaap:SeriesAPreferredStockMember2020-12-310001601712us-gaap:SeriesAPreferredStockMember2019-12-310001601712syf:A2014LongTermIncentivePlanMemberDomain2020-12-310001601712syf:A2014LongTermIncentivePlanMemberDomainsrt:MinimumMemberus-gaap:RestrictedStockUnitsRSUMember2020-01-012020-12-310001601712syf:A2014LongTermIncentivePlanMemberDomainus-gaap:RestrictedStockUnitsRSUMembersrt:MaximumMember2020-01-012020-12-310001601712syf:A2014LongTermIncentivePlanMemberDomainus-gaap:RestrictedStockUnitsRSUMember2020-12-310001601712us-gaap:EmployeeStockOptionMembersyf:A2014LongTermIncentivePlanMemberDomain2020-12-310001601712syf:A2014LongTermIncentivePlanMemberDomain2020-01-012020-12-310001601712syf:OperatingLeaseAndOtherAssetImpairmentsMemberus-gaap:OtherExpenseMember2020-01-012020-12-310001601712us-gaap:EmployeeSeveranceMembersyf:EmployeeCostsMember2020-01-012020-12-310001601712us-gaap:StateAndLocalJurisdictionMember2020-12-310001601712us-gaap:StateAndLocalJurisdictionMember2019-12-310001601712srt:SubsidiariesMember2020-12-310001601712srt:ParentCompanyMember2020-01-012020-12-310001601712srt:ParentCompanyMember2019-01-012019-12-310001601712srt:ParentCompanyMember2018-01-012018-12-310001601712srt:ParentCompanyMember2020-12-310001601712srt:ParentCompanyMember2019-12-310001601712us-gaap:SeniorNotesMembersrt:ParentCompanyMember2020-12-310001601712us-gaap:SeniorNotesMembersrt:ParentCompanyMember2019-12-310001601712srt:ParentCompanyMember2018-12-310001601712srt:ParentCompanyMember2017-12-31
UNITED STATES
SECURITIES AND EXCHANGE COMMISSION
Washington, D.C. 20549
FORM 10-K
(Mark One)
| | | | | |
| ☒ | ANNUAL REPORT PURSUANT TO SECTION 13 OR 15(d) OF THE SECURITIES EXCHANGE ACT OF 1934 |
For the fiscal year ended December 31, 2020
OR
| | | | | |
| ☐ | TRANSITION REPORT PURSUANT TO SECTION 13 OR 15(d) OF THE SECURITIES EXCHANGE ACT OF 1934 |
For the transition period from to
001-36560
(Commission File Number)
SYNCHRONY FINANCIAL
(Exact name of registrant as specified in its charter)
| | | | | | | | |
| Delaware | | 51-0483352 |
(State or Other Jurisdiction of
Incorporation or Organization) | | (I.R.S. Employer
Identification No.) |
| | | | | | | | | | | |
| 777 Long Ridge Road | | |
| Stamford, | Connecticut | | 06902 |
| (Address of principal executive offices) | | (Zip Code) |
(Registrant’s telephone number, including area code) (203) 585-2400
Securities Registered Pursuant to Section 12(b) of the Act:
| | | | | | | | |
| Title of each class | Trading Symbol(s) | Name of each exchange on which registered |
| Common stock, par value $0.001 per share | SYF | New York Stock Exchange |
| Depositary Shares Each Representing a 1/40th Interest in a Share of 5.625% Fixed Rate Non-Cumulative Perpetual Preferred Stock, Series A | SYFPrA | New York Stock Exchange |
Securities Registered Pursuant to Section 12(g) of the Act:
Indicate by check mark if the registrant is a well-known seasoned issuer, as defined in Rule 405 of the Securities Act. Yes ☒ No ☐
Indicate by check mark if the registrant is not required to file reports pursuant to Section 13 or Section 15(d) of the Act. Yes ☐ No ☒
Indicate by check mark whether the registrant (1) has filed all reports required to be filed by Section 13 or 15(d) of the Securities Exchange Act of 1934 during the preceding 12 months (or for such shorter period that the registrant was required to file such reports), and (2) has been subject to such filing requirements for the past 90 days. Yes ☒ No ☐
Indicate by check mark whether the registrant has submitted electronically every Interactive Data File required to be submitted pursuant to Rule 405 of Regulation S-T during the preceding 12 months (or for such shorter period that the registrant was required to submit such files). Yes ☒ No ☐
Indicate by check mark whether the registrant is a large accelerated filer, an accelerated filer, a non-accelerated filer, a smaller reporting company, or emerging growth company. See the definitions of “large accelerated filer,” “accelerated filer,” “smaller reporting company,” and “emerging growth company” in Rule 12b-2 of the Exchange Act.
| | | | | | | | | | | |
| Large Accelerated Filer | ☒ | Accelerated filer | ☐ |
| | | |
| Non-accelerated filer | ☐ | Smaller reporting company | ☐ |
| | | |
| | Emerging growth company | ☐ |
If an emerging growth company, indicate by check mark if the registrant has elected not to use the extended transition period for complying with any new or revised financial accounting standards provided pursuant to Section 13(a) of the Exchange Act. ☐
Indicate by check mark whether the registrant has filed a report on and attestation to its management's assessment of the effectiveness of its internal control over financial reporting under Section 404(b) of the Sarbanes-Oxley Act (15 U.S.C. 7262(b)) by the registered public accounting firm that prepared or issued its audit report. ☒
Indicate by check mark whether the registrant is a shell company (as defined in Rule 12b-2 of the Act). Yes ☐ No ☒
The aggregate market value of the outstanding common equity of the registrant held by non-affiliates as of the last business day of the registrant’s most recently completed second fiscal quarter was $12,935,102,284,
The number of shares of the registrant’s common stock, par value $0.001 per share, outstanding as of February 8, 2021 was 583,881,805
DOCUMENTS INCORPORATED BY REFERENCE
The definitive proxy statement relating to the registrant’s Annual Meeting of Stockholders, to be held May 20, 2021, is incorporated by reference into Part III to the extent described therein.
Synchrony Financial
Table of Contents
OUR ANNUAL REPORT ON FORM 10-K
To improve the readability of this document and better present both our financial results and how we manage our business, we present the content of our Annual Report on Form 10-K in the order listed in the table of contents below. See "Form 10-K Cross-Reference Index" on page 4 for a cross-reference index to the traditional U.S. Securities and Exchange Commission (SEC) Form 10-K format.
FORM 10-K CROSS REFERENCE INDEX
____________________________________________________________________________________________
| | | | | | | | |
Part I | | Page(s) |
| | |
| | |
| | |
| | |
| | |
Item 1B. | Unresolved Staff Comments | Not Applicable |
| | |
| | |
| | |
Item 3. | Legal Proceedings | |
| | |
Item 4. | Mine Safety Disclosures | Not Applicable |
| | |
Part II | | |
| | |
| | |
| | |
| | |
| | |
| | |
| | |
| | |
| | |
Item 9. | Changes in and Disagreements With Accountants on Accounting and Financial Disclosure | Not Applicable |
| | |
| | |
| | |
Item 9B. | Other Information | Not Applicable |
| | |
Part III | | |
| | |
Item 10. | Directors, Executive Officers and Corporate Governance | (a) |
| | |
Item 11. | Executive Compensation | (b) |
| | |
Item 12. | Security Ownership of Certain Beneficial Owners and Management and Related Stockholder Matters | (c) |
| | |
Item 13. | Certain Relationships and Related Transactions, and Director Independence | (d) |
| | |
Item 14. | Principal Accounting Fees and Services | (e) |
| | |
Part IV | | |
| | |
| | |
| | |
Item 16. | Form 10-K Summary | Not Applicable |
| | |
| | |
______________________
(a)Incorporated by reference to “Management”, “Election of Directors,” “Governance Principles,” “Code of Conduct” and “Committees of the Board of the Directors” in our definitive proxy statement for our 2021 Annual Meeting of Stockholders to be held on May 20, 2021, which will be filed within 120 days of the end our fiscal year ended December 31, 2020 (the “2021 Proxy Statement”).
(b)Incorporated by reference to “Compensation Discussion and Analysis,” “2020 Executive Compensation,” “Management Development and Compensation Committee Report” and “Management Development and Compensation Committee Interlocks and Insider Participation” and “CEO Pay Ratio” in the 2021 Proxy Statement.
(c)Incorporated by reference to “Beneficial Ownership” and “Equity Compensation Plan Information” in the 2021 Proxy Statement.
(d)Incorporated by reference to “Related Person Transactions,” “Election of Directors” and “Committees of the Board of Directors” in the 2021 Proxy Statement.
(e)Incorporated by reference to “Independent Auditor” in the 2021 Proxy Statement.
Certain Defined Terms
Except as the context may otherwise require in this report, references to:
•“we,” “us,” “our” and the “Company” are to SYNCHRONY FINANCIAL and its subsidiaries;
•“Synchrony” are to SYNCHRONY FINANCIAL only;
•the “Bank” are to Synchrony Bank (a subsidiary of Synchrony);
•the “Board of Directors” or “Board” are to Synchrony’s board of directors; and
•“VantageScore” or “Vantage” are to a credit score developed by the three major credit reporting agencies which is used as a means of evaluating the likelihood that credit users will pay their obligations.
We provide a range of credit products through programs we have established with a diverse group of national and regional retailers, local merchants, manufacturers, buying groups, industry associations and healthcare service providers, which, in our business and in this report, we refer to as our “partners.” The terms of the programs all require cooperative efforts between us and our partners of varying natures and degrees to establish and operate the programs. Our use of the term “partners” to refer to these entities is not intended to, and does not, describe our legal relationship with them, imply that a legal partnership or other relationship exists between the parties or create any legal partnership or other relationship. The “average length of our relationship” with respect to a specified group of partners or programs is measured on a weighted average basis by interest and fees on loans for the year ended December 31, 2020 for those partners or for all partners participating in a program, based on the date each partner relationship or program, as applicable, started. Information with respect to partner “locations” in this report is given at December 31, 2020. “Open accounts” represents credit card or installment loan accounts that are not closed, blocked or more than 60 days delinquent.
Unless otherwise indicated, references to “loan receivables” do not include loan receivables held for sale.
For a description of certain other terms we use, including “active account” and “purchase volume,” see the notes to Management’s Discussion and Analysis—Results of Operations—Other Financial and Statistical Data.” There is no standard industry definition for many of these terms, and other companies may define them differently than we do.
“Synchrony” and its logos and other trademarks referred to in this report, including, CareCredit®, Quickscreen®, Dual Card™, Synchrony Car Care™ and SyPI™ belong to us. Solely for convenience, we refer to our trademarks in this report without the ™ and ® symbols, but such references are not intended to indicate that we will not assert, to the fullest extent under applicable law, our rights to our trademarks. Other service marks, trademarks and trade names referred to in this report are the property of their respective owners.
On our website at www.synchronyfinancial.com, we make available under the "Investors-SEC Filings" menu selection, free of charge, our Annual Reports on Form 10-K, Quarterly Reports on Form 10-Q, Current Reports on Form 8-K, and amendments to these reports filed or furnished pursuant to Section 13(a) or 15(d) of the Exchange Act as soon as reasonably practicable after such reports or amendments are electronically filed with, or furnished to, the SEC. The SEC maintains an Internet site at www.sec.gov that contains reports, proxy and information statements, and other information that we file electronically with the SEC.
Industry and Market Data
This report contains various historical and projected financial information concerning our industry and market. Some of this information is from industry publications and other third-party sources, and other information is from our own data and market research that we commission. All of this information involves a variety of assumptions, limitations and methodologies and is inherently subject to uncertainties, and therefore you are cautioned not to give undue weight to it. Although we believe that those industry publications and other third-party sources are reliable, we have not independently verified the accuracy or completeness of any of the data from those publications or sources.
Cautionary Note Regarding Forward-Looking Statements:
Various statements in this Annual Report on Form 10-K may contain “forward-looking statements” as defined in Section 27A of the Securities Act of 1933, as amended, and Section 21E of the Securities Exchange Act of 1934, as amended (the “Exchange Act”), which are subject to the “safe harbor” created by those sections. Forward-looking statements may be identified by words such as “expects,” “intends,” “anticipates,” “plans,” “believes,” “seeks,” “targets,” “outlook,” “estimates,” “will,” “should,” “may” or words of similar meaning, but these words are not the exclusive means of identifying forward-looking statements.
Forward-looking statements are based on management’s current expectations and assumptions, and are subject to inherent uncertainties, risks and changes in circumstances that are difficult to predict. As a result, actual results could differ materially from those indicated in these forward-looking statements. Factors that could cause actual results to differ materially include global political, economic, business, competitive, market, regulatory and other factors and risks, such as: the impact of macroeconomic conditions and whether industry trends we have identified develop as anticipated, including the future impacts of the novel coronavirus disease (“COVID-19”) outbreak and measures taken in response thereto for which future developments are highly uncertain and difficult to predict; retaining existing partners and attracting new partners, concentration of our revenue in a small number of Retail Card partners, and promotion and support of our products by our partners; cyber-attacks or other security breaches; disruptions in the operations of our and our outsourced partners' computer systems and data centers; the financial performance of our partners; the sufficiency of our allowance for credit losses and the accuracy of the assumptions or estimates used in preparing our financial statements, including those related to the CECL accounting guidance; higher borrowing costs and adverse financial market conditions impacting our funding and liquidity, and any reduction in our credit ratings; our ability to grow our deposits in the future; damage to our reputation; our ability to securitize our loan receivables, occurrence of an early amortization of our securitization facilities, loss of the right to service or subservice our securitized loan receivables, and lower payment rates on our securitized loan receivables; changes in market interest rates and the impact of any margin compression; effectiveness of our risk management processes and procedures, reliance on models which may be inaccurate or misinterpreted, our ability to manage our credit risk; our ability to offset increases in our costs in retailer share arrangements; competition in the consumer finance industry; our concentration in the U.S. consumer credit market; our ability to successfully develop and commercialize new or enhanced products and services; our ability to realize the value of acquisitions and strategic investments; reductions in interchange fees; fraudulent activity; failure of third-parties to provide various services that are important to our operations; international risks and compliance and regulatory risks and costs associated with international operations; alleged infringement of intellectual property rights of others and our ability to protect our intellectual property; litigation and regulatory actions; our ability to attract, retain and motivate key officers and employees; tax legislation initiatives or challenges to our tax positions and/or interpretations, and state sales tax rules and regulations; regulation, supervision, examination and enforcement of our business by governmental authorities, the impact of the Dodd-Frank Wall Street Reform and Consumer Protection Act (the “Dodd-Frank Act”) and other legislative and regulatory developments and the impact of the Consumer Financial Protection Bureau’s (the “CFPB”) regulation of our business; impact of capital adequacy rules and liquidity requirements; restrictions that limit our ability to pay dividends and repurchase our common stock, and restrictions that limit the Bank’s ability to pay dividends to us; regulations relating to privacy, information security and data protection; use of third-party vendors and ongoing third-party business relationships; and failure to comply with anti-money laundering and anti-terrorism financing laws.
For the reasons described above, we caution you against relying on any forward-looking statements, which should also be read in conjunction with the other cautionary statements that are included in “Risk Factors Relating to Our Business” and “Risk Factors Relating to Regulation.” You should not consider any list of such factors to be an exhaustive statement of all of the risks, uncertainties, or potentially inaccurate assumptions that could cause our current expectations or beliefs to change. Further, any forward-looking statement speaks only as of the date on which it is made, and we undertake no obligation to update or revise any forward-looking statement to reflect events or circumstances after the date on which the statement is made or to reflect the occurrence of unanticipated events, except as otherwise may be required by law.
OUR BUSINESS
Our Company
____________________________________________________________________________________________
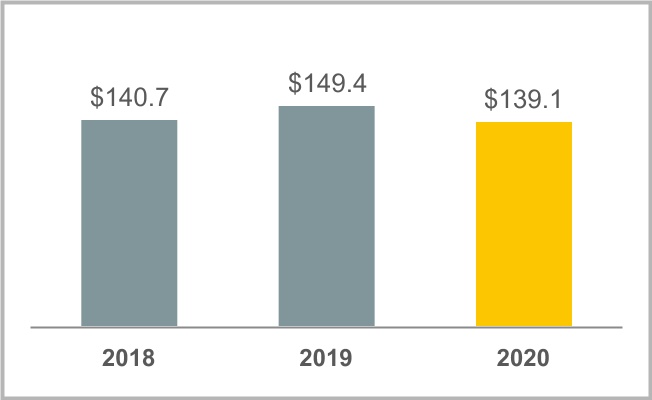
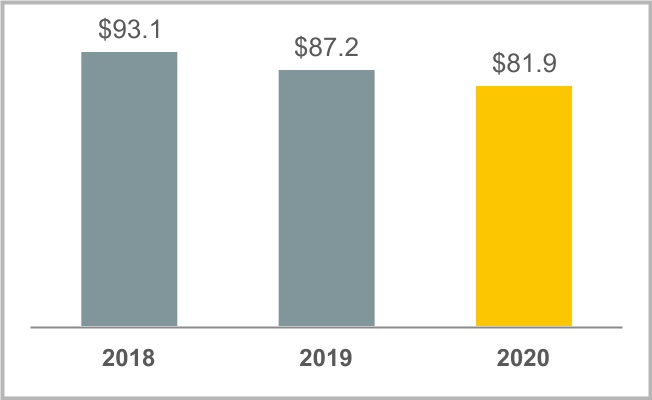
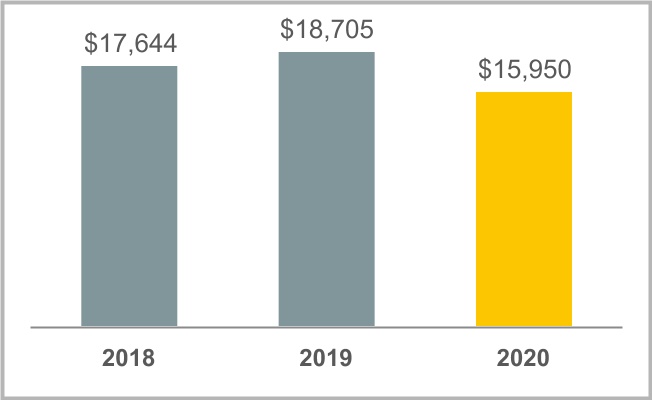
We are a premier consumer financial services company delivering a wide range of specialized financing programs, as well as innovative consumer banking products, across key industries including digital, retail, home, auto, travel, health and pet. We provide a range of credit products through our financing programs which we have established with a diverse group of national and regional retailers, local merchants, manufacturers, buying groups, industry associations and healthcare service providers, which we refer to as our “partners.” Through our partners’ over 440,000 locations across the United States and Canada, and their websites and mobile applications, we offer their customers a variety of credit products to finance the purchase of goods and services. During 2020, we financed $139.1 billion of purchase volume, and at December 31, 2020, we had $81.9 billion of loan receivables and 68.5 million active accounts.
Our business benefits from longstanding and collaborative relationships with our partners, including some of the nation’s leading retailers and manufacturers with well-known consumer brands, such as Lowe’s and Ashley HomeStore and also leading digital partners, such as Amazon and PayPal. We believe our partner-centric business model has been successful because it aligns our interests with those of our partners and provides substantial value to both our partners and our customers. Our partners promote our credit products because they generate increased sales and strengthen customer loyalty. Our customers benefit from instant access to credit, discounts, such as cash back rewards, and promotional offers. We seek to differentiate ourselves through deep partner integration and our extensive marketing expertise. We have omni-channel (in-store, online and mobile) technology and marketing capabilities, which allow us to offer and deliver our credit products instantly to customers across multiple channels. We continue to invest in, and develop, our digital assets to ensure our partners are well positioned for the rapidly evolving environment as the COVID-19 pandemic forced many of our partners to do business differently. We have been able to demonstrate our digital capabilities by providing solutions that meet the needs of our partners and customers, with approximately 60% of our applications in 2020 processed through a digital channel.
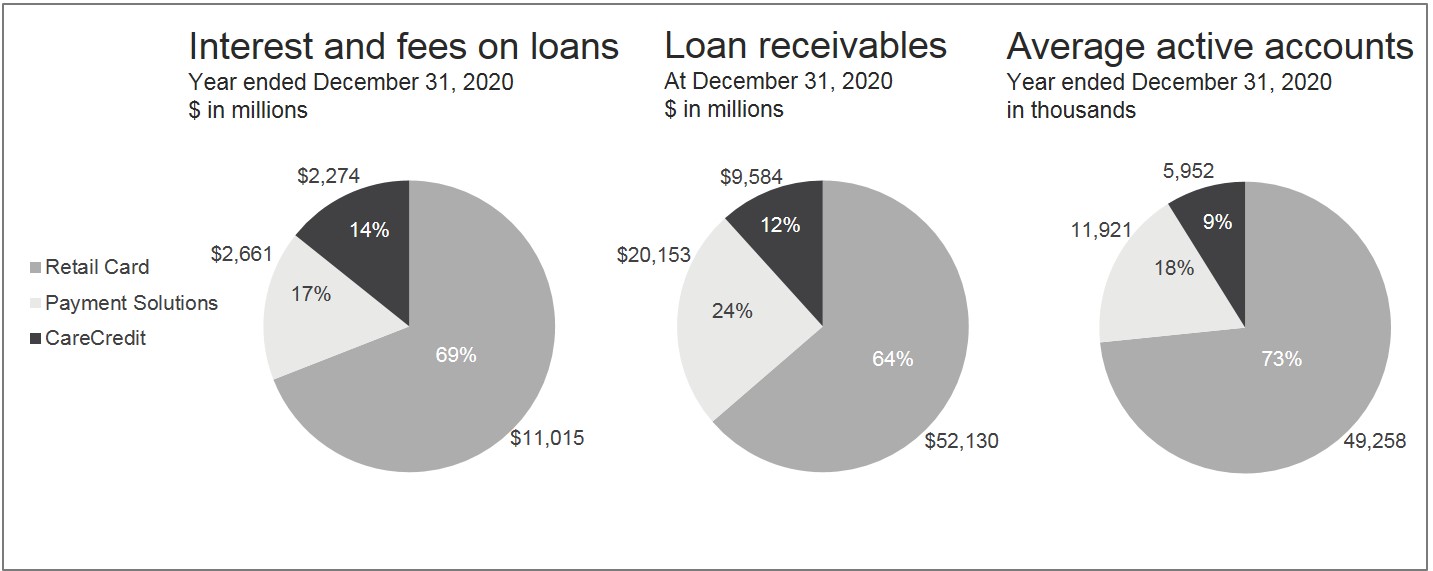
We conduct our operations through a single business segment. Profitability and expenses, including funding costs, credit losses and operating expenses, are managed for the business as a whole. Substantially all of our operations are within the United States. We offer our credit products through three sales platforms (Retail Card, Payment Solutions and CareCredit). Those platforms are organized by the types of products we offer and the partners we work with, and are measured on interest and fees on loans, loan receivables, active accounts and other sales metrics. Retail Card is a leading provider of private label credit cards, and also provides Dual Cards, general purpose co-branded credit cards and small and medium-sized business credit products. Payment Solutions is a leading provider of promotional financing for major consumer purchases, offering primarily private label credit cards, Dual Cards and installment loans. CareCredit is a leading provider of promotional financing to consumers for health, veterinary and personal care procedures, services and products, including dental, vision, audiology and cosmetic.
We offer our credit products primarily through our wholly-owned subsidiary, the Bank. In addition, through the Bank, we offer, directly to retail and commercial customers, a range of deposit products insured by the Federal Deposit Insurance Corporation (“FDIC”), including certificates of deposit, individual retirement accounts (“IRAs”), money market accounts and savings accounts. We also take deposits at the Bank through third-party securities brokerage firms that offer our FDIC-insured deposit products to their customers. We have significantly expanded our online direct banking operations in recent years and our deposit base serves as a source of stable and diversified low cost funding for our credit activities. At December 31, 2020, we had $62.8 billion in deposits, which represented 80% of our total funding sources.
Our Sales Platforms
____________________________________________________________________________________________
We offer our credit products through three sales platforms: Retail Card, Payment Solutions and CareCredit. Set forth below is a summary of certain information relating to our Retail Card, Payment Solutions and CareCredit platforms:
Retail Card
Retail Card is a leading provider of private label credit cards, and also provides Dual Cards, general purpose co-branded credit cards and small and medium-sized business credit products. Retail Card accounted for $11.0 billion, or 69%, of our total interest and fees on loans for the year ended December 31, 2020. Substantially all of the credit extended in this platform is on standard (i.e., non-promotional) terms.
Retail Card’s revenue primarily consists of interest and fees on our loan receivables. Other income primarily consists of interchange fees earned when our Dual Card or general purpose co-branded cards are used outside of our partners’ sales channels and fees paid to us by customers who purchase our debt cancellation products, less loyalty program payments.
Retail Card Partners
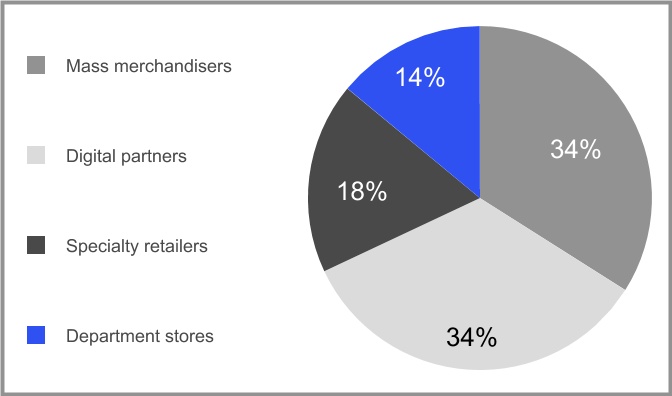
We have Retail Card programs with 25 national and regional retailers, which have approximately 20,000 retail locations and include department stores, specialty retailers, mass merchandisers and digital (multi-channel and online retailers). The average length of our relationship with our Retail Card partners is 23 years.
| | |
Interest and fees on loans by retail market from our Retail Card partners Year ended December 31, 2020 |
| | |
Note: Travel & Entertainment <1% |
| | | | | | | | |
| Retail Card partners |
At December 31, 2020 (length of relationship in years) |
| Mass merchandisers | Specialty retailers | Department stores |
| Lowe's (41) | American Eagle (24) | Belk (15) |
| Sam's Club (27) | At Home (3) | JCPenney (21) |
| Crate and Barrel (2) | |
| Digital | Dick's Sporting Goods (17) | Travel & Entertainment |
| Amazon (13) | Fleet Farm (15) | Cathay Pacific Airways (3) |
| eBay (16) | Gap (22) | Fareportal (4) |
| Google Store (4) | Harbor Freight Tools (2) | Marvel (4) |
| PayPal (16) | Nissan (3) | Norwegian Air (1) |
| Qurate (15) | TJX (9) | |
| Rakuten (7) | | |
| ShopHQ (14) | | |
| Verizon (1) | | |
Our five largest programs are with Retail Card partners. Based upon interest and fees on loans for the year ended December 31, 2020, our five largest programs were: Gap, JCPenney, Lowe’s, PayPal and Sam’s Club. These programs accounted in aggregate for 51% of our total interest and fees on loans for the year ended December 31, 2020, and 47% of loan receivables at December 31, 2020. Our programs with Lowe's and PayPal, which includes our Venmo program, each accounted for more than 10% of our total interest and fees on loans for the year ended December 31, 2020.
The length of our relationship with each of our five largest Retail Card partners is over 16 years, and in the case of Lowe's, 41 years. The current expiration dates for these agreements range from 2022 through 2030.
The share of our Retail Card sales platform from our digital partners continues to grow. Our digital partners accounted in aggregate for 34% of our interest and fees on loans for the year ended December 31, 2020, and 38% of our loan receivables at December 31, 2020 attributable to our Retail Card partners. We expect loan receivables attributable to our digital partners to continue to grow through organic growth and establishment of new programs such as the launch of the Verizon Credit Card in June 2020 and the first-ever Venmo Credit Card in October 2020.
New and Extended Partner Programs
During the year ended December 31, 2020 we launched new programs with Harbor Freight Tools, Venmo and Verizon, and also extended our program agreements with Google and Sam's Club.
A total of 14 of our 25 ongoing Retail Card program agreements now have an expiration date in 2025 or beyond. These 14 program agreements represented in the aggregate 87% of our Retail Card interest and fees on loans for the year ended December 31, 2020 and 88% of our Retail Card loan receivables at December 31, 2020 attributable to our ongoing programs.
Retail Card Program Agreements
Our Retail Card programs are governed by program agreements that are each negotiated separately with our partners. Although the terms of the agreements are partner-specific, and may be amended from time to time, under a typical program agreement, our partner agrees to support and promote the program to its customers, but we control credit criteria and issue credit cards to customers who qualify under those criteria. We own the underlying accounts and all loan receivables generated under the program from the time of origination. Other key provisions in the Retail Card program agreements include:
Term
Retail Card program agreements typically have contract terms ranging from approximately five to ten years. Many program agreements have renewal clauses that provide for automatic renewal for one or more years until terminated by us or our partner. We typically seek to renew the program agreements well in advance of their termination dates.
Exclusivity
The program agreements typically are exclusive for the products we offer and limit our partners’ ability to originate or promote other private label or co-branded credit cards during the term of the agreement.
Retailer Share Arrangements
Most of our Retail Card program agreements contain retailer share arrangements that provide for payments to our partner if the economic performance of the program exceeds a contractually-defined threshold. Economic performance for the purposes of these arrangements is typically measured based on agreed upon program revenues (including interest income and certain other income) less agreed upon program expenses (including interest expense, provision for credit losses, retailer payments and operating expenses). We may also provide other economic benefits to our partners such as royalties on purchase volume or payments for new accounts, in some cases instead of retailer share arrangements (for example, on our co-branded credit cards). All of these arrangements align our interests and provide an additional incentive to our partners to promote our credit products.
Other Economic Terms
In addition to the retailer share arrangements, the program agreements typically provide that the parties will develop a marketing plan to support the program, and they set the terms by which a joint marketing budget is funded, the basic terms of the rewards program linked to the use of our product (such as opportunities to receive double rewards points for purchases made on a Retail Card product), and the allocation of costs related to the rewards program.
Termination
The program agreements set forth the circumstances in which a party may terminate the agreement prior to expiration. Our program agreements generally permit us and our partner to terminate the agreement prior to its scheduled termination date for various reasons, including if the other party materially breaches its obligations. Some program agreements also permit our partner to terminate the program if we fail to meet certain service levels or change certain key cardholder terms or our credit criteria, we fail to achieve certain approval rate targets with respect to approvals of new customers, we elect not to increase the program size when the outstanding loan receivables under the program reach certain thresholds, we are not adequately capitalized, certain force majeure events occur or certain changes in our ownership occur. Certain program agreements are also subject to early termination by a party if the other party has a material adverse change in its financial condition. Historically, these rights have not typically been triggered or exercised. Some of our program agreements provide that, upon termination or expiration, our partner may purchase or designate a third party to purchase the accounts and loan receivables generated with respect to its program at fair market value or a stated price, including all related customer data.
Payment Solutions
Payment Solutions is a leading provider of promotional financing for major consumer purchases, offering consumer choice for financing at the point of sale, including primarily private label credit cards, Dual Cards and installment loans. Payment Solutions accounted for $2.7 billion, or 17%, of our total interest and fees on loans for the year ended December 31, 2020. Credit extended in this platform, other than for our oil and gas retail partners, is primarily promotional financing.
Payment Solutions’ revenue primarily consists of interest and fees on our loan receivables, including “merchant discounts,” which are fees paid to us by our partners in almost all cases to compensate us for all or part of the foregone interest income associated with promotional financing. The types of promotional financing we offer include deferred interest (interest accrues during a promotional period and becomes payable if the full purchase amount is not paid off during the promotional period), no interest (no interest on a promotional purchase) and reduced interest (interest is assessed monthly at a promotional interest rate during the promotional period). As a result, during the promotional period we do not generate interest income or generate it at a lower rate, although we continue to generate fee income relating to late fees on required minimum payments.
Payment Solutions Partners
In Payment Solutions, we create customized credit programs for national and regional retailers, manufacturers, buying groups, and industry associations. In addition, we create our own industry vertical programs, which are available to local, small and medium size merchants to provide financing offers to their customers.
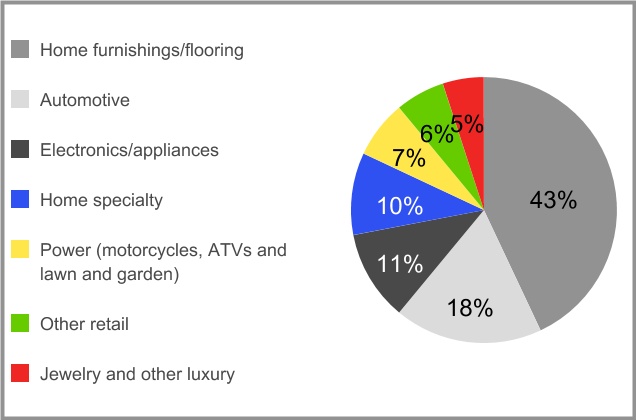
At December 31, 2020, our Payment Solutions partners had approximately 170,000 retail locations, including oil and gas retail locations. Payment Solutions is diversified by program, with no one Payment Solutions program accounting for more than 1.5% of our total interest and fees on loans for the year ended December 31, 2020. At December 31, 2020, the average length of our relationships with our ten largest ongoing Payment Solutions programs was 14 years.
| | |
Payment Solutions interest and fees on loans by retail market Year ended December 31, 2020 |
| | | | | |
Top 10 Payment Solutions programs(1) |
At December 31, 2020 |
| Partner (length of relationship in years) | Category |
| Ashley HomeStore (9) | Home furnishings |
| BP (5) | Automotive |
| Chevron (13) | Automotive |
| Discount Tire (22) | Automotive |
| Home Furnishings Association (11) | Home furnishings |
| Mattress Firm (20) | Home furnishings |
| Nationwide Marketing Group (20) | Home furnishings |
| Polaris (14) | Power |
| Rooms to Go (18) | Home furnishings |
| Sleep Number (17) | Home furnishings |
_____________________ | |
| (1) Based on interest and fees on loans for the year ended December 31, 2020. |
In Payment Solutions, we generally partner with sellers of “big-ticket” products or services (generally priced from $500 to $25,000) to consumers where our financing products and industry expertise provide strong incremental value to our partners and their customers. We also promote our programs to sellers through direct marketing activities such as industry trade publications, trade shows and sales efforts by dedicated internal and external sales teams, leveraging our existing partner network or through endorsements from manufacturers, buying groups and industry associations. Our broad array of point-of-sale technologies and quick enrollment process allow us to quickly and cost-effectively integrate new partners.
During the year ended December 31, 2020, we:
▪announced our new partnerships with:
◦Adorama, Club Champion, Doosan Bobcat, HiSun, Levin Furniture and Mattress, Modani Furniture and Piaggio.
•extended our program agreements with:
◦ABC Warehouse, Bernina, CarX, Englert, 4 Wheel Parts, Hanks, Icahn Enterprises LP automotive brands (Pep Boys, AAMCO Transmissions, Precision Tune Auto Care, Cottman Transmission and Auto Plus Auto Parts), Kane's Furniture, Kawasaki, Living Spaces, Mattress Firm, Puronics, SVP Sewing Brands LLC, System Pavers and Vanderhall.
▪completed the sale of loan receivables associated with our program agreement with Yamaha.
Payment Solutions Program Agreements
National and Regional Retailers and Manufacturers
The terms of our program agreements with national and regional retailers and manufacturers are typically similar to the terms of our Retail Card program agreements in that we are the exclusive program provider of financing for the national or regional retailer or manufacturer with respect to the financing products that we offer. Some program agreements, however, allow the merchant to use a second source lender after an application has been submitted to us and declined, or in the case of some of our programs, may allow the manufacturer to have several primary lenders. The terms of the program agreements generally run from three to five years and are subject to termination prior to the scheduled termination date by us or our partner for various reasons, including if the other party materially breaches its obligations. Some of these programs also permit our partner to terminate the program if we change certain key cardholder terms, exceed certain pricing thresholds, certain force majeure events occur, certain changes in our ownership occur or there is a material adverse change in our financial condition. A few of these programs also may be terminated at will by the partner on specified notice to us (e.g., several months). Many of these program agreements have renewal clauses which allow the program agreement to be renewed for successive one or more year terms until terminated by us or our partner. We typically negotiate with program participants to renew the program agreements well in advance of their termination dates.
We control credit criteria and issue credit cards or provide installment loans to customers who qualify under those credit criteria. We own the underlying accounts and all loan receivables generated under the program from the time of origination. Our Payment Solutions program agreements set forth the program’s economic terms, including the merchant discount applicable to each promotional finance offering. We typically do not pay fees to our Payment Solutions partners pursuant to any retailer share arrangements, but in some cases we pay a sign-up fee to a partner or provide volume-based rebates on the merchant discount paid by the partner.
Buying Groups and Industry Associations
The programs we have established with buying groups and industry associations, such as the Home Furnishings Association, Jewelers of America and Nationwide Marketing Group, are governed by program agreements under which we make our credit products available to their respective members or dealers, but these agreements generally do not require the members or dealers to offer our products to their customers. Under the terms of the program agreements, buying groups and industry associations generally agree to support and promote the respective programs. These arrangements may include sign-up fees and volume-based incentives paid by us to the groups and their members.
Synchrony-Branded Networks
Our Synchrony-branded networks are focused on specific industries, where we create either company-branded or company and partner-branded private label credit cards that are usable across all participating locations within the industry-specific network. For example, our Synchrony Car Care network, comprised of merchants selling automotive parts, repair services and tires, covers over 1,000,000 locations across the United States, and cards issued may be dual branded with Synchrony Car Care and partners such as Midas, Michelin Tires or Pep Boys. Under the terms of these networks, we establish merchant discounts applicable to each financing offer, and, in some cases, the fees we charge partners for their membership in the network. In addition, we also earn interchange fees through credit card transactions outside of the program network. The Synchrony Car Care network allows for expanded use outside of the program network at certain related merchants, such as gas stations. Similarly, the Synchrony HOME credit card is accepted at hundreds of thousands of home-related retail locations nationwide, including both partner locations and retailers outside of our program network.
Dealer Agreements
For the programs we have established with manufacturers, buying groups, industry associations, industry vertical programs and Synchrony-branded networks described above, we enter into individual agreements with the merchants and dealers that offer our credit products under these programs. These agreements generally are not exclusive and some parties who offer our financing products also offer financing from our competitors. Our agreements generally continue until terminated by either party, with termination typically available to either party at will upon 15 days’ written notice. Our dealer agreements set forth the economic terms associated with the program, including the fees charged to dealers to offer promotional financing, and in some cases, allow us to periodically change the fees we charge.
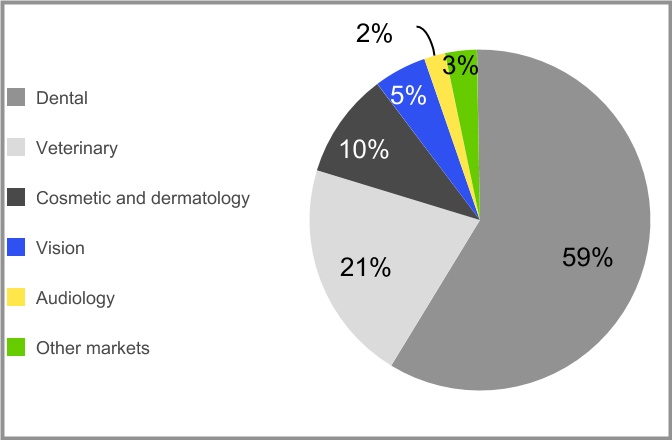
CareCredit
CareCredit is a leading provider of promotional financing to consumers for health, veterinary and personal care procedures, services and products. CareCredit accounted for $2.3 billion, or 14%, of our total interest and fees on loans for the year ended December 31, 2020. Substantially all of the credit extended in CareCredit is promotional financing.
We offer customers a CareCredit-branded private label credit card that may be used across our network of CareCredit providers and our CareCredit Dual Card offering, along with complementary products such as Pets Best pet insurance. We generate revenue in CareCredit primarily from interest and fees on our loan receivables and from merchant discounts paid by providers to compensate us for all or part of the foregone interest income associated with promotional financing.
CareCredit Partners
The vast majority of our partners are individual and small groups of independent healthcare providers, which includes networks of healthcare practitioners that provide elective and other procedures that generally are not fully covered by insurance. The remainder are primarily national and regional healthcare providers and health-focused retailers, such as pharmacies. At December 31, 2020, we had a network of CareCredit providers and health-focused retailers that collectively have over 250,000 locations. In January 2021, we announced our new program agreement with Walgreens to become the issuer of the first co-branded credit card program for a national health retailer in the United States. We expect to launch this new program in the second half of 2021.
| | |
CareCredit interest and fees on loans by specialty Year ended December 31, 2020 |
| | | | | |
| CareCredit key relationships |
|
Approximately 185,000 providers across over 250,000 locations at December 31, 2020 |
| Expansive network of independent healthcare providers |
| |
| National and regional healthcare providers and retailers |
| Aspen Dental | Heartland Dental |
| LCA Vision | Mars Petcare |
| Rite Aid | Walgreens |
| Professional and other associations |
| American Dental Association | American Society of Plastic Surgeons |
| American Veterinary Medical Association |
| |
During 2020, over 195,000 locations either processed a CareCredit application or made a sale on a CareCredit credit card. No single CareCredit partner accounted for more than 0.2% of our total interest and fees on loans for the year ended December 31, 2020.
We enter into provider agreements with individual healthcare providers who become part of our CareCredit network. These provider agreements are similar to the dealer agreements that govern our relationships with the merchants and dealers offering our Payment Solutions products in that the agreements are not exclusive and typically may be terminated at will upon 15 days’ notice. Multi-year agreements are in place for larger multi-location relationships across all markets. There are typically no retailer share arrangements with partners in CareCredit.
At December 31, 2020, we had relationships with over 130 professional and other associations (including the American Dental Association and the American Veterinary Medical Association), manufacturers and buying groups, which endorse and promote our credit products to their members. Of these relationships, over 80 were paid endorsements linked to member enrollment in, and volume under, the relevant program.
We screen potential partners using a variety of criteria, including whether the potential provider specializes in one of our approved specialties, carries the appropriate licensing and certifications, and meets our underwriting criteria. We also screen potential partners for reputational issues. We work with professional and other associations, manufacturers, buying groups, industry associations and healthcare consultants to educate their constituents about the products and services we offer. We believe our ability to attract new partners is aided by our customer satisfaction rate, which our research in 2020 showed is 92%. We also approach individual healthcare service providers through direct mail, advertising, and at trade shows.
During the year ended December 31, 2020 and to date, we:
•announced our new partnership with Walgreens discussed above.
•expanded our network through our new partnerships with AdventHealth and Community Veterinary Partners.
•launched other healthcare system partnerships with Lehigh Valley Health Network, St. Luke's University Health Network and Cox Health.
•acquired Allegro Credit, a leading provider of point-of-sale consumer financing for audiology products and dental services.
•renewed our agreements with Aspen Dental, Blue River Petcare, NVA, Vision Group Holdings and West Coast Dental and extended Pets Best's relationship with Progressive.
Our Customers
____________________________________________________________________________________________
Acquiring and Marketing to Retail Card & Payment Solutions Customers
In our Retail Card and Payment Solutions platforms we work directly with our partners using their distribution network, communication channels and customer interactions to market our products to their existing and potential customers. We believe our presence at partners’ points of sale (in-store, online and mobile) locations and our ability to make credit decisions instantly for a customer already predisposed to make a purchase enables us to acquire new customer accounts at a lower cost than issuers of general purpose cards.
To acquire new customers, we collaborate and deeply integrate with our partners and leverage our marketing expertise to create programs promoting our products to creditworthy customers. Frequently, our partners market the availability of credit as part of the advertising for their goods and services. Our marketing programs include marketing offers (e.g., 10% off the customer’s first purchase) and consumer communications delivered through a variety of channels, including in-store signage, online advertising, retailer website placement, associate communication, emails, text messages, direct mail campaigns, advertising circulars, and outside marketing via television, radio, print, and digital marketing (search engine optimization, paid search and personalization). We also employ our proprietary Quickscreen acquisition method to make targeted pre-approved credit offers at the point-of-sale. Our Quickscreen technology allows us to process customer information obtained from our partners through our risk models such that when these customers seek to make payment for goods and services at our partners' points-of-sale, we can offer them credit instantly, if appropriate. Based on our experience, due to the personalized and immediate nature of the offer, Quickscreen significantly outperforms traditional direct-to-consumer pre-approved channels, such as direct mail or email, in response rate and dollar spending.
In Payment Solutions we also market the value of cross-network benefits to our partners. For example, the Synchrony Car Care credit card offers motorists the convenience of one card to pay for comprehensive auto care at thousands of service and parts locations, as well as fuel at gas stations nationwide. In addition, the Synchrony HOME Network, allows customers to finance items from home décor to mattresses to flooring at thousands of participating HOME locations nationwide.
Acquiring and Marketing to CareCredit Customers
We market our products through our network of providers by training them on the advantages of CareCredit and by creating marketing materials for providers to use to promote the program and educate customers. Our training helps our providers learn to discuss payment options during the pre-treatment consultation phase, including the option to apply for a CareCredit credit card and the offer of promotional credit. According to a 2020 survey of our CareCredit customers, 47% indicated they would have postponed or reduced the scope of treatment if financing was not offered by their provider. Consumers can apply for our CareCredit products in the provider’s office or online via the web or mobile device.
As the market continues to evolve, we are increasingly seeing more customers from mobile and internet channels. Consumers are going online to look for information about the types of procedures or care they need, where to receive that care and how to pay for it. As such, we are promoting CareCredit directly to potential and existing customers using digital marketing. Our provider locator, on our website, allows customers to search among the more than 250,000 locations that accept the CareCredit credit card by desired geography and provider type. According to our records, our CareCredit provider locator averaged over 1.5 million searches per month during the year ended December 31, 2020. We believe our partners recognize the locator as an important source of new customer acquisition and information about their practice.
We believe going direct to consumers through digital marketing will have several benefits. Customers will have a better understanding of the types of care they can pay for, the different financing options available and where they can use CareCredit. In addition, whether they choose to apply online or in the provider’s office, once approved, they can move forward with the care they want or need to feel better.
Enterprise Customer Engagement ("ECE") / Analytics
After a customer obtains one of our products, our marketing programs encourage ongoing card usage by communicating the benefits of our products’ value propositions. Examples of such programs include: promotional financing offers, cardholder events, product and partner discounts, dollar-off certificates, account holder sales, reward points and offers, new product announcements and previews, and other specific partner value offerings. These programs are executed through our partners’ and our own (direct to consumer) distribution channels.
Our ECE and data analytics teams help us expand and optimize customer relationships through the building of targeting tools and the deployment of detailed test-and-learn tracking of cardholder responsiveness to these omni-channel marketing campaigns. Leveraging thousands of customer data points curated through customer interactions with Synchrony and accessed through third-party relationships, Synchrony's more than 200 business analysts and data scientists apply sophisticated analytic techniques to create signals and tools allowing customized marketing messages and treatments. For example, if through test and learn, we see cardholders of a certain type consistently click on a banner with a combination of a certain font, color, and message, we will display future marketing messages to these type of customers in a similar manner. This closed loop learning process uses a set of analytics tools to read and react in real time using machine learning algorithms to the customer’s response to these treatments. This example is repeated thousands of times a month across digital and non-digital use cases to constantly maximize campaign response, customer share of wallet, and program profitability.
Our understanding of our Dual Card and general purpose co-branded credit card programs are further enhanced by the collection and analysis of data on customers' spending patterns (merchant category code, online spend, etc.) at other retailers. These additional signals and scores help drive incremental volume for our programs while maximizing return on investment.
Our extensive marketing activities targeted to existing customers have yielded high levels of re-use across both our Payment Solutions and CareCredit sales platforms. During the year ended December 31, 2020, 32% (excluding oil and gas retail partner programs) and 58% of purchase volume across our Payment Solutions platform and CareCredit network, respectively, resulted from repeat use at one or more retailers or providers.
Digital and mobile capabilities
We remain focused on investing in our digital and mobile capabilities, bringing to market new features, channels and experiences for our customers and enhancing our existing digital design and user experience. Our approach continues to be customer and partner-centric to reach our customers in unique ways at home, in store, online or wherever they prefer. Our investment is focused on all aspects of our customer journey through application, purchase and service. We believe these investments are critical to driving growth in our existing programs, including supporting our partners as they adapt to the rapidly evolving environment resulting from the COVID-19 pandemic, and also in securing renewals and winning new programs such as our new co-branded consumer credit cards for Venmo and Verizon.
In 2020, we continued to invest in our digital apply platform (“dApply”) which has been rolled out to all of our partners which enables us to provide a simplified experience for our customers. We have launched capabilities that can securely pre-fill data from multiple sources including leveraging data from our partners, enabling improved fraud prevention and a streamlined customer experience. With more ways to start a new application, such as our direct to device innovation that provides a contactless way for an application to begin at a point-of-sale and complete on a customer’s personal mobile phone, combined with new capabilities such as our SetPay installment product and offering consumers an option for prequalification, the dApply platform continues to be critical in how we engage with our customers. In 2020, digital applications represented approximately 60% of our total applications received.
We have also continued to introduce new ways for our customers to interact with their accounts. We have added multiple new features such as pay as guest, online activation, freeze my account and IVR to text, enabling a customer to seamlessly transition from a customer service phone call to completing the task online. With the changing needs during COVID-19, our investments in contactless digital tools both in-store and online were essential. From our digital card and mobile wallet capabilities, to text-to-apply and mobile account lookup which provides a fast and easy way for a customer to access a digital representation of their card, these features enabled our customers and partners to adapt to the new environment.
Digital account servicing now represents over 65% of all account servicing done by our customers and we continue to invest in capabilities to improve this experience including a complete user experience redesign of our SyPI native app platform. Through our investment in opening our platform to partners via application program interfaces (APIs), we have more than doubled the number of APIs available in our Synchrony Developer Portal. By offering an increasing array of APIs for the credit life-cycle, we are creating opportunities to build new and richer experiences with our partners and in 2020 we launched multiple new experiences with partners integrating our APIs into their digital assets focused on credit applications, rewards and account servicing. We have also added new capabilities during our Venmo product launch, including enhanced cardholder alerts and virtual card capability. This will continue to be a significant strategic focus for Synchrony.
Finally, we have continued to expand the reach of our virtual assistant, Sydney, across our digital platforms and mobile servicing, and deepened her knowledge and ability to respond to the questions and tasks that our customers ask.
Loyalty Programs
Many of the credit rewards loyalty programs we manage provide rewards points, which are redeemable for a variety of products or awards, or merchandise discounts earned by achieving a pre-set spending level on their private label credit card, Dual Card or general purpose co-branded credit card. Other programs include statement credit or cash back rewards. The rewards can be mailed to the cardholder, accessed digitally or may be immediately redeemable at the partner’s store. These loyalty programs are designed to generate incremental purchase volume per customer, while reinforcing the value of the card to the customer and strengthening customer loyalty. We continue to support and integrate into our partners’ loyalty programs which are offered to customers who utilize non-credit payment types such as cash, debit or check. These multi-tender loyalty programs allow our partners to market to an expanded customer base and allow us access to additional prospective cardholders.
Commercial Customers
In addition to our efforts to acquire consumer cardholders, we continue to increase our focus on small to mid-sized commercial customers. We offer these customers private label credit cards and Dual Cards that can be used primarily at our Retail Card partners and are similar to our consumer offerings. We are also increasing our focus on marketing our commercial pay-in-full accounts receivable product that supports a wide range of business customers.
Our Credit Products
____________________________________________________________________________________________
Through our platforms, we offer three principal types of credit products: credit cards, commercial credit products and consumer installment loans. We also offer a debt cancellation product.
The following table sets forth each credit product by type and indicates the percentage of our total loan receivables that are under standard terms only or pursuant to a promotional financing offer at December 31, 2020.
| | | | | | | | | | | | | | | | | | | | | | | |
| | | Promotional Offer | | |
| Credit Product | Standard Terms Only | | Deferred Interest | | Other Promotional | | Total |
| Credit cards | 62.4 | % | | 18.0 | % | | 15.5 | % | | 95.9 | % |
| Commercial credit products | 1.5 | | | — | | | — | | | 1.5 | |
| Consumer installment loans | — | | | — | | | 2.6 | | | 2.6 | |
| Other | — | | | — | | | — | | | — | |
| Total | 63.9 | % | | 18.0 | % | | 18.1 | % | | 100.0 | % |
Credit Cards
Our credit card products are loans we extend through open-ended revolving credit card accounts. We offer the following principal types of credit cards:
Private Label Credit Cards
Private label credit cards are partner-branded credit cards (e.g., Lowe’s or Amazon) or program-branded credit cards (e.g., Synchrony Car Care or CareCredit) that are used primarily for the purchase of goods and services from the partner or within the program network. In addition, in some cases, cardholders may be permitted to access their credit card accounts for cash advances.
Credit under a private label credit card typically is extended either on standard terms only in our Retail Card sales platform, which means accounts are assessed periodic interest charges using an agreed non-promotional fixed and/or variable interest rate, or pursuant to a promotional financing offer in our Payment Solutions and CareCredit sales platforms, involving deferred interest, no interest or reduced interest during a set promotional period. Promotional periods typically range between six and 60 months, but we may agree to longer terms with the partner. In almost all cases, we receive a merchant discount from our partners to compensate us for all or part of the foregone interest income associated with promotional financing. The terms of these promotions vary by partner, but generally the longer the deferred interest, reduced interest or interest-free period, the greater the partner’s merchant discount. Some offers permit customers to pay for a purchase in equal monthly payments with no interest or at a reduced interest rate, rather than deferring or delaying interest charges. For our deferred interest products, approximately 80% of customer transactions are typically paid off before interest is assessed. In CareCredit, standard rate financing generally applies to charges under $200.
We typically do not charge interchange or other fees to our partners when a customer uses a private label credit card to purchase our partners’ goods and services through our payment system.
Most of our private label credit card business is in the United States. For some of our partners who have locations in Canada, we also support the issuance and acceptance of private label credit cards at their locations in Canada and from customers in Canada.
Dual Cards and General Purpose Co-Branded Cards
Our patented Dual Cards are credit cards that function as private label credit cards when used to purchase goods and services from our partners, and as general purpose credit cards when used to make purchases from other retailers wherever cards from those card networks are accepted or for cash advance transactions. We currently issue Dual Cards for use on the MasterCard and Visa networks and we have the potential capability to issue Dual Cards for use on the American Express and Discover networks.
We have been granted two U.S. patents relating to the process by which our Dual Cards function as a private label credit card when used to make purchases from our partners and function as a general purpose credit card when used on the systems of other credit card associations.
We also offer general purpose co-branded credit cards that do not function as private label credit cards, as well as, in limited circumstances, a Synchrony-branded general purpose credit card.
Credit extended under our Dual Cards and general purpose co-branded credit cards typically is extended on standard terms only. Dual Cards and general purpose co-branded credit cards are offered across all of our sales platforms. At December 31, 2020, we offered either Dual Cards or general purpose co-branded credit cards through 22 ongoing credit partners and our CareCredit Dual Card, of which the majority are Dual Cards. We expect to continue to increase the number of partner programs that offer Dual Cards or general purpose co-branded credit cards and seek to increase the portion of our loan receivables attributable to these products. Consumer Dual Cards and co-branded cards totaled 24% of our total loan receivables portfolio at December 31, 2020.
Charges using a Dual Card or general purpose co-branded credit card generate interchange income for us in connection with purchases made by cardholders other than in-store or online from that partner.
We currently do not issue Dual Cards or general purpose co-branded credit cards in Canada.
Terms and Conditions
As a general matter, the financial terms and conditions governing our credit card products vary by program and product type and change over time, although we seek to standardize the non-financial provisions consistently across all products. The terms and conditions of our credit card products are governed by a cardholder agreement and applicable laws and regulations.
We assign each card account a credit limit when the account is initially opened. Thereafter, we may increase or decrease individual credit limits from time to time, at our discretion, based primarily on our evaluation of the customer’s creditworthiness and ability to pay.
For the vast majority of accounts, periodic interest charges are calculated using the daily balance method, which results in daily compounding of periodic interest charges, subject to, at times, a grace period on new purchases. Cash advances are not subject to a grace period, and some credit card programs do not provide a grace period for promotional purchases. In addition to periodic interest charges, we may impose other charges and fees on credit card accounts, including, as applicable and provided in the cardholder agreement, cash advance transaction fees and late fees where a customer has not paid at least the minimum payment due by the required due date.
Typically, each customer with an outstanding debit balance on his or her credit card account must make a minimum payment each month. A customer may pay the total amount due at any time without penalty. We also may enter into arrangements with delinquent customers to extend or otherwise change payment schedules and to waive interest charges and/or fees.
Commercial Credit Products
We offer private label cards and Dual Cards for commercial customers that are similar to our consumer offerings. We also offer a commercial pay-in-full accounts receivable product to a wide range of business customers. We offer our commercial credit products primarily through our Retail Card platform to the commercial customers of our Retail Card partners.
Installment Loans
In Payment Solutions, we originate installment loans to consumers (and a limited number of commercial customers) in the United States, primarily in the power products market (motorcycles, ATVs and lawn and garden). Installment loans are closed-end credit accounts where the customer pays down the outstanding balance in installments. The terms of our installment loans are governed by customer agreements and applicable laws and regulations.
Installment loans are assessed periodic finance charges using fixed interest rates. In addition to periodic finance charges, we may impose other charges and fees on loan accounts, including late fees where a customer has not made the required payment by the required due date and returned payment fees.
Debt Cancellation Products
We offer a debt cancellation product to our credit card customers via online, mobile and, on a limited basis, direct mail. Customers who choose to purchase this product are charged a monthly fee based on their ending balance on each billing statement. In return, the Bank will cancel all or a portion of a customer’s credit card balance in the event of certain qualifying life events.
Direct-to-Consumer Banking
__________________________________________________________________________________________
Through the Bank, we offer our customers a range of FDIC-insured deposit products. The Bank also takes brokered deposits through third-party securities brokerage firms that offer our FDIC-insured deposit products to their customers. At December 31, 2020, we had $62.8 billion in deposits, $52.1 billion of which were direct deposits and $10.7 billion of which were brokered deposits. At December 31, 2020, deposits represented 80% of our total funding sources. During 2020, direct deposits were received from approximately 468,000 customers that had a total of approximately 900,000 accounts. Retail customers accounted for substantially all of our direct deposits at December 31, 2020. The Bank had a 76% retention rate on certificates of deposit balances up for renewal for the year ended December 31, 2020. FDIC insurance is provided for our deposit products up to applicable limits.
We have significantly expanded our online direct banking operations in recent years and our deposit base serves as a source of stable and diversified low-cost funding for our credit activities. Our online platform is highly scalable allowing us to expand without having to rely on a traditional “brick and mortar” branch network. During 2020 we continued to make investments in our servicing and digital platforms to expand features available for self-service and improve the user experience including the integration of the Synchrony Mastercard product.
We continue to grow our direct banking operations and believe we are well-positioned to continue to benefit from the consumer-driven shift from branch banking to direct banking. According to the 2020 American Bankers Association survey, approximately 80% of customers primarily use direct channels (internet, mail, phone and mobile) to manage their bank accounts, a 3% rise since the outbreak of COVID-19 pandemic.
Our deposit products include certificates of deposit, IRAs, money market accounts and savings accounts. We market our deposit products through multiple channels including digital and print. Customers can apply for, fund, and service their deposit accounts online or via phone. We have dedicated banking representatives within our call centers to service deposit accounts. Fiserv, Inc. ("Fiserv") provides the core banking platform for our online retail deposits including a customer-facing account opening and servicing platform.
To attract new deposits and retain existing ones, we intend to introduce new deposit products, enhancements to our existing products, and deliver new capabilities. This may include the introduction of checking accounts, overdraft protection lines of credit, bill payment and person-to-person payment features, and Synchrony-branded debit cards. Our focus on deposit-taking and related branding efforts will also enable us to offer other branded direct-banking products more efficiently in the future.
We seek to differentiate our deposit product offerings from our competitors on the basis of brand, reputation, convenience, customer service and value. Our deposit products emphasize reliability, trust, security, convenience and attractive rates. We offer rewards to customers based on their tenure or balance amounts, including reduced fees, travel offers and concierge telephone support.
Credit Risk Management
____________________________________________________________________________________________
Credit risk management is a critical component of our management and growth strategy. Credit risk refers to the risk of loss arising from customer default when customers are unable or unwilling to meet their financial obligations to us. Our credit risk arising from credit products is generally highly diversified across approximately 132 million open accounts at December 31, 2020, without significant individual exposures. We manage credit risk primarily according to customer segments and product types.
Customer Account Acquisition
We have developed programs to promote credit with each of our partners and have developed varying credit decision guidelines for the different partners. We originate credit accounts through several different channels, including in-store, mail, internet, mobile, telephone and pre-approved solicitations. In addition, we have, and may in the future, acquire accounts that were originated by third parties in connection with establishing programs with new partners.
Regardless of the channel, in making the initial credit approval decision to open a credit card or other account or otherwise grant credit, we follow a series of credit risk and underwriting procedures. In most cases, when applications are made in-store or digitally, the process is fully automated and applicants are notified of our credit decision immediately. We generally obtain certain information provided by the applicant and obtain a credit bureau report from one of the major credit bureaus. The credit report information we obtain is electronically transmitted into industry scoring models and our proprietary scoring models developed to calculate a credit score. The credit risk management team determines in advance the qualifying credit scores and initial credit line assignments for each portfolio and product type. We periodically analyze performance trends of accounts originated at different score levels as compared to projected performance and adjust the minimum score or the opening credit limit to manage credit risk.
We also apply additional application screens based on various inputs, including credit bureau information, alternative data, our previous experience with the customer and information provided by our partner, to help identify additional factors, such as potential fraud and prior bankruptcies, before qualifying the application for approval. We compare applicants’ names against the Specially Designated Nationals list maintained by the Office of Foreign Assets Control of the U.S. Department of the Treasury (“OFAC”), as well as screens that account for adherence to USA PATRIOT Act of 2001 (the “Patriot Act”) and Credit Card Accountability Responsibility and Disclosure Act of 2009 (the “CARD Act”) requirements, including ability to pay requirements.
We also use pre-approved account solicitations for certain programs. Potential applicants are pre-screened using information provided by our partner or obtained from outside lists, and qualified individuals receive a pre-approved credit offer by mail or email.
Acquired Portfolio Evaluation
Our risk management team evaluates each portfolio that we acquire in connection with establishing programs with new partners to ensure the portfolio satisfies our credit risk guidelines. As part of this review, we receive data on the third-party accounts and loans, which allows us to assess the portfolio on the basis of certain core characteristics, such as historical performance of the assets and distributions of credit and loss information. In addition, we benchmark potential portfolio acquisitions against our existing programs to assess relative current and projected risks. Finally, our risk management team must approve the acquisition, taking into account the results of our risk assessment process. Once assets are migrated to our systems, our account management protocols will apply immediately as described below under “—Customer Account Management,” “—Credit Authorizations of Individual Transactions” and “—Collections.”
Customer Account Management
We regularly assess the credit risk exposure of our customer accounts. This ongoing assessment includes information relating to the customer’s performance with respect to their account with us, as well as information from credit bureaus relating to the customer’s broader credit performance. To monitor and control the quality of our loan portfolio (including the portion of the portfolio originated by third parties), we use behavioral scoring models that we have developed to score each active account on its monthly cycle date. Proprietary risk models, together with the credit scores obtained on each active account no less than quarterly, are an integral part of our credit decision-making process. Depending on the duration of the customer’s account, risk profile and other performance metrics, the account may be subject to a range of account actions, including limits on transaction authorization and increases or decreases in purchase and cash credit limits.
Credit Authorizations of Individual Transactions
Once an account has been opened, when a credit card is used to make a purchase in-store at one of our partners’ locations or online, point-of-sale terminals or online sites have an online connection with our credit authorization system, which allows for real-time updating of accounts. Each potential sales transaction is passed through a transaction authorization system, which considers a variety of behavior and risk factors to determine whether the transaction should be approved or declined, and whether a credit limit adjustment is warranted.
Fraud Investigation
We provide follow up and research with respect to different types of fraud such as fraud rings, new account fraud and transactional fraud. We have developed a proprietary fraud model to identify new account fraud and deployed tools that help identify transaction purchase behavior outside a customer’s established pattern. Our proprietary model is also complemented by externally sourced models and tools used across the industry to better identify fraud and protect our customers. We also are continuously implementing new and improved technologies to detect and prevent fraud.
Collections
All monthly billing statements of accounts with past due amounts include a request for payment of these amounts. Collections personnel generally initiate contact with customers within 30 days after any portion of their balance becomes past due. The nature and the timing of the initial contact, typically a personal call, e-mail, text message or letter, are determined by a review of the customer’s prior account activity and payment habits.
We re-evaluate our collection efforts and consider the implementation of other techniques, including internal collection activities, use of external vendors and the sale of debt to third-party buyers, as a customer becomes increasingly delinquent. We limit our exposure to delinquencies through controls within the transaction authorization processes, the imposition of credit limits and criteria-based account suspension and revocation processes. In certain situations, we may enter into arrangements to extend or otherwise change payment schedules, decrease interest rates and/or waive fees to aid customers experiencing financial difficulties in their efforts to become current on their obligations to us.
Customer Service
____________________________________________________________________________________________
Customer service is an important feature of our relationship with our partners. Our customers can contact us via phone, mail, email, eService and eChat. During the year ended December 31, 2020, we handled over 275 million inquiries.
We assign a dedicated toll-free customer service phone number to each of our Retail Card programs. Our Payment Solutions customers access customer service through one general purpose toll-free customer service phone number (except for a few large Payment Solutions programs, which have dedicated toll-free numbers). Our CareCredit platform has its own, dedicated toll-free customer service phone number. We also have dedicated toll-free customer service phone numbers for our deposit business.
We service all programs through our nine domestic geographic hubs and three off-shore call centers. We blend domestic and off-shore locations as an important part of our servicing strategy, to maintain service availability beyond normal work hours in the United States and to seek optimal costs. Customer service for cards issued to customers in Canada is supported through agents based in the United States.
Given the nature of our business and the high volume of calls, we maintain several centers of excellence to ensure the quality of our customer service across all of our sites. Examples of these centers of excellence include back office, quality assurance, customer experience, training, workforce and capacity planning, surveillance and process control.
Production Services
____________________________________________________________________________________________
Our production services organization oversees a number of services, including:
•payment processing (more than 600 million paper and electronic payments in 2020);
•embossing and mailing credit cards (more than 40 million cards in 2020);
•printing and mailing and eService delivery of credit card statements (more than 700 million paper and electronic statements in 2020); and
•other letters mailed or sent electronically (more than 90 million in 2020).
We utilize third-party providers for certain production services. U.S. credit card statement printing and mailing, card embossing and mailing and letter production and mailing for customers are provided through outsourced services with Fiserv. Fiserv also produces our statements and other mailings for deposit customers. We also utilize a third-party provider for our paper payment processing services. While these services are outsourced, we monitor and maintain oversight of these other activities.
Card production embossing, mailing, statement printing and mailing services related to cards issued to customers in Canada are outsourced to Canadian suppliers.
Technology and Data Security
____________________________________________________________________________________________
Products and Services
We leverage information technology to deliver products and services that meet the needs of our customers and partners and enables us to operate our business efficiently. The integration of our technology with our partners is at the core of our value proposition, enabling, among other things, customers to “apply and buy” at the point of sale, and many of our partners to settle transactions directly with us without an interchange fee. A key part of our strategic focus is the continued development of innovative, efficient, flexible technology and operational platforms to support marketing, risk management, account acquisition and account management, customer service, and new product innovation and development. We believe that the continued investment in and development of these platforms is an important part of our efforts to increase our competitive capabilities, reduce costs, improve quality and provide faster, more flexible technology services. Therefore, we continuously review capabilities and develop or acquire systems, processes and competencies to meet our business needs.
As part of our continuous efforts to enhance our technological capabilities, we may either develop these capabilities internally or in partnership with third-party providers. Our internal approach involves deployment of cross-functional product teams, often in collaboration with our partners, focused on driving rapid delivery of in-house product innovation and development, and the commercialization of new products. In addition, at times we also partner with third-party providers to help us deliver systems and operational infrastructure based on strategies and, in some cases, architecture, designed by us. We leverage Fiserv for our credit card transaction processing and production and our retail banking operations.
Data Security
The protection and security of financial and personal information of our consumers is one of our highest priorities. We have implemented a comprehensive information security program that includes administrative, technical and physical safeguards that we believe provide an appropriate level of protection to maintain the confidentiality, integrity, and availability of our Company's and our customers' information. This includes protecting against any known or evolving threats to the security or integrity of customer records and information, and against unauthorized access to or use of customer records or information.
Our information security program is continuously adapting to an evolving landscape of emerging threats and available technology. Through data gathering and evaluation of emerging threats from internal and external incidents and technology investment, security controls are adjusted on a continuous basis. We work directly with our partners on an ongoing basis by sharing cyber intelligence and facilitating awareness and communications of events outside of the Company.
We have developed a security strategy and implemented multiple layers of controls embedded throughout our technology environment that establish multiple control points between threats and our assets. Our security program is designed to provide oversight of third parties who store, process or have access to sensitive data, and we require the same level of protection from such third-party service providers. We evaluate the effectiveness of the key security controls through ongoing assessment and measurement.
In addition, we identify risks that may threaten customer information and utilize both internal and external resources to perform a variety of vulnerability and penetration testing on the platforms, systems and applications used to provide our products and services. We employ backup and disaster recovery procedures for all the systems that are used for storing, processing and transferring customer information, and we periodically test and validate our disaster recovery plans. Further, we regularly utilize independent assessors to evaluate the appropriateness of our overall program. We are compliant with the Payment Card Industry (PCI) Data Security Standard (DSS).
Intellectual Property
____________________________________________________________________________________________
We use a variety of methods, such as trademarks, patents, copyrights and trade secrets, to protect our intellectual property, including our brand, "Synchrony." We also place appropriate restrictions on our proprietary information to control access and prevent unauthorized disclosures. Our brands are important assets, and we take steps to protect the value of these assets and our reputation.
Human Capital
____________________________________________________________________________________________
At Synchrony, people power our business, and our success depends, in large part, on our ability to recruit, develop, motivate and retain employees with the skills to execute our long-term strategy. In 2020, we significantly revised our approach to human capital management in response to the COVID-19 pandemic. Starting in March 2020, we equipped nearly all employees to work from home, including our thousands of customer service agents in call centers, our agile developers in our innovation labs and our senior executives in corporate headquarters. We instituted safety protocols and procedures for the small number of essential employees who continued to work at our physical locations. We have also changed our overall approach to getting work done by adopting a “hub” model that will enable employees across job roles and levels to work from home when they want (or full-time) and visit a hub — e.g. a co-working space, Synchrony office, university space or other gathering spots — when they need to meet face-to-face. Once the pandemic is over, physical hubs will be used as cultural and innovation centers by hosting events, town halls, agile sprints, networking and other important business activities, allowing us to retain the human, personal connection of a traditional workplace while providing employees greater flexibility.
At December 31, 2020 we had over 16,500 full time employees. Our global workforce has decreased slightly compared to the prior year as we have focused on efficiencies, such as hiring freezes, in response to the COVID-19 pandemic. In January 2021 we further reduced headcount through a significant enhanced pandemic severance program resulting in headcount reductions that were more than 50% voluntary and provided a minimum of 6 months of pay and benefits. The enhanced voluntary and involuntary severance plan helped support our workforce during a time of economic uncertainty resulting from the pandemic. At December 31, 2020, our global workforce was 56.6% female and 43.4% male. In the United States, ethnicity of our workforce was 55.6% White, 19.8% Black, 12.3% Hispanic, 7.7% Asian, 3.3% two or more races, 0.6% Native American, 0.1% Native Hawaiian or Pacific Islander and 0.6% that did not list ethnicity.
At Synchrony, diversity and inclusion are core to our corporate culture. In 2020, we embraced our responsibility to further integrate diversity and inclusion into our long-term business strategy. To drive progress over the long term, we treat diversity and inclusion as important business priorities, with (i) new board-approved governance rules, imperatives, and accountability mechanisms to measure results and (ii) a revised annual incentive program for 2021 that incorporates diversity factors when determining payouts. We also created a senior-level committee led by our President, Chief Diversity Officer, and others, charged with developing an enterprise-wide strategy, setting measurable goals, and providing progress reports to our board and employees across all areas of the business. We used data analytics to identify gaps in our hiring and promotion processes. As a result, we are putting more focus on the hiring, development, and progression of underrepresented minorities, with an emphasis on Black and Hispanic talent. Among other actions, we have tied leaders’ performance metrics to diversity factors, provided for diverse candidate slates for senior roles, and launched a new leadership development program designed to advance diverse employees.
Regulation
____________________________________________________________________________________________
Our business, including our relationships with our customers, is subject to regulation, supervision and examination under U.S. federal, state and foreign laws and regulations. These laws and regulations cover all aspects of our business, including lending practices, treatment of our customers, safeguarding deposits, customer privacy and information security, capital structure, liquidity, dividends and other capital distributions, transactions with affiliates, and conduct and qualifications of personnel.
As a savings and loan holding company and financial holding company, Synchrony is subject to regulation, supervision and examination by the Federal Reserve Board. As a large provider of consumer financial services, we are also subject to regulation, supervision and examination by the CFPB.
The Bank is a federally chartered savings association. As such, the Bank is subject to regulation, supervision and examination by the Office of the Comptroller of the Currency of the U.S. Treasury (the “OCC”), which is its primary regulator, and by the CFPB. In addition, the Bank, as an insured depository institution, is supervised by the FDIC. For a discussion of the specific regulations related to our business see “Regulation—Regulation Relating to Our Business” of this Form 10-K Report.
Competition
____________________________________________________________________________________________
Our industry continues to be highly competitive. We compete for relationships with partners in connection with retaining existing or establishing new consumer credit programs. Our primary competitors for partners include major financial institutions such as Alliance Data Systems, American Express, Capital One, JPMorgan Chase, Citibank, TD Bank and Wells Fargo, and to a lesser extent, financial technology companies and potential partners’ own in-house financing capabilities. We compete for partners on the basis of a number of factors, including program financial and other terms, underwriting standards, marketing expertise, service levels, product and service offerings (including incentive and loyalty programs), technological capabilities and integration, brand and reputation. In addition, some of our competitors for partners have a business model that allows for their partners to manage underwriting (e.g., new account approval), customer service and collections, and other core banking responsibilities that we retain.
We also compete for customer usage of our credit products. Consumer credit provided, and credit card payments made, using our cards constitute only a small percentage of overall consumer credit provided and credit card payments in the United States. Consumers have numerous financing and payment options available to them. As a form of payment, our products compete with cash, checks, debit cards, general purpose credit cards (Visa and MasterCard, American Express and Discover Card), various forms of consumer installment loans, other private-label card brands, and, to a certain extent, prepaid cards. In the future, we expect our products may face increased competitive pressure to the extent that our products are not, or do not continue to be, accepted in, or compatible with digital wallet technologies such as Apple Pay, Samsung Pay, Android Pay and other similar technologies. We may also face increased competition from current competitors or others who introduce or embrace disruptive technology that significantly changes the consumer credit and payment industry. We compete for customers and their usage of our deposit products, and to minimize transfers to competitors of our customers’ outstanding balances, based on a number of factors, including pricing (interest rates and fees), product offerings, credit limits, incentives (including loyalty programs) and customer service. Some of our competitors provide a broader selection of services, including home and automobile loans, debit cards and bank branch ATM access, which may position them better among customers who prefer to use a single financial institution to meet all of their financial needs. In addition, some of our competitors are substantially larger than we are, may have substantially greater resources than we do or may offer a broader range of products and services than we do. Moreover, some of our competitors, including new and emerging competitors in the digital and mobile payments space, are not subject to the same regulatory requirements or legislative scrutiny to which we are subject. Non-bank providers of pay-over-time solutions, such as Affirm, Afterpay and others, extend consumer credit-like offerings but do not face the same restrictions, such as capital requirements and other regulatory requirements, as banks which also could place us at a competitive disadvantage.
In our retail deposits business, we have acquisition and servicing capabilities similar to other direct-banking competitors. We compete for deposits with traditional banks, and in seeking to grow our direct-banking business, we compete with other banks that have direct-banking models similar to ours, such as Ally Financial, American Express, Capital One 360 (ING), CIT, Citi, Citizens Bank, Discover, Marcus by Goldman Sachs and PurePoint. Competition among direct banks is intense because online banking provides customers the ability to quickly and easily deposit and withdraw funds and open and close accounts in favor of products and services offered by competitors.
MANAGEMENT’S DISCUSSION AND ANALYSIS OF FINANCIAL CONDITION AND RESULTS OF OPERATIONS
The following discussion and analysis of our financial condition and results of operations should be read in conjunction with our consolidated financial statements and related notes included elsewhere in this report. For a discussion and analysis of our financial condition and results of operations comparing 2019 vs. 2018, see “Management’s Discussion and Analysis of Financial Condition and Results of Operations” in our Annual Report on Form 10-K for the year ended December 31, 2019 (our “2019 Form 10-K”). The discussion below contains forward-looking statements that are based upon current expectations and are subject to uncertainty and changes in circumstances. Actual results may differ materially from these expectations. See “Cautionary Note Regarding Forward-Looking Statements.”
Results of Operations for the Three Years Ended December 31, 2020
____________________________________________________________________________________________
Key Earnings Metrics
| | | | | | | | |
Net earnings $ in millions | | Net interest income $ in millions |
| | | | | | | | |
Net interest margin % of average interest-earning assets | | Efficiency Ratio "Other expense" as a % of "NII, after RSA" plus "Other income" |
Growth Metrics
| | | | | | | | |
Purchase volume $ in billions | | Loan receivables $ in billions |
| | | | | | | | |
Average active accounts in millions | | Interest and fees on loans $ in millions |
Asset Quality Metrics
| | | | | | | | |
30+ days past due % of period-end loan receivables | | Net charge-offs % of average loan receivables including held for sale |
| | | | | | | | |
90+ days past due % of period-end loan receivables | | Allowance for credit losses(1) % of period-end loan receivables |
_____________________
(1)Allowance for credit losses reflects adoption of CECL on January 1, 2020, which included a $3.0 billion increase in reserves upon adoption.
Capital and Liquidity
| | | | | | | | |
Capital ratios Common equity Tier1 - Basel III | | Liquidity Liquid assets and undrawn credit facilities $ in billions |
Highlights for Year Ended December 31, 2020
Below are highlights of our performance for the year ended December 31, 2020 compared to the year ended December 31, 2019, as applicable, except as otherwise noted.
•Net earnings decreased 63.0% to $1.4 billion for the year ended December 31, 2020, primarily driven by lower net interest income and higher provision for credit losses, partially offset by a decrease in retailer share arrangements and other expense. These changes were primarily due to the following key factors:
◦impact of COVID-19 on purchase volume and loan receivables at our partners and increases to our allowance for credit losses.
◦the effects from the sale of the Walmart consumer portfolio in 2019, including the prior year impact from reductions in reserves of loan losses of $857 million after-tax.
◦increase in provision for credit losses attributable to applying the CECL guidance as compared to the prior accounting guidance of $215 million after-tax.
•We adopted the CECL accounting guidance in January 2020 and recorded an increase to our allowance for credit losses of $3.0 billion. In addition, the increase in provision for credit losses for the year ended December 31, 2020 included $285 million, or $215 million after-tax, attributable to applying the CECL guidance as compared to the prior accounting guidance.
•Loan receivables decreased 6.1% to $81.9 billion at December 31, 2020 compared to December 31, 2019, primarily driven by lower purchase volume and a decrease in average active accounts due to the impact of COVID-19.
•Net interest income decreased 14.3% to $14.4 billion for the year ended December 31, 2020, primarily due to a decrease in interest and fees on loans related to the Walmart consumer portfolio sale and the impact of COVID-19, partially offset by a decrease in interest expense reflecting lower benchmark interest rates.
•Retailer share arrangements decreased 5.5% to $3.6 billion for the year ended December 31, 2020, reflecting the impact of COVID-19 on program performance.
•Over-30 day loan delinquencies as a percentage of period-end loan receivables decreased 137 basis points to 3.07% at December 31, 2020 from 4.44% at December 31, 2019, and our net charge-off rate decreased 107 basis points to 4.58% for the year ended December 31, 2020.
•Provision for credit losses increased by $1.1 billion, or 27.0%, for the year ended December 31, 2020, primarily driven by the effects of the prior year sale of the Walmart consumer portfolio and a higher reserve build in the current year, partially offset by lower net charge-offs. The higher reserve build reflects the projected impact of COVID-19 and the increase attributable to CECL discussed above. The prior year reductions in reserves for credit losses related to the Walmart consumer portfolio totaled $1.1 billion. Our allowance coverage ratio (allowance for credit losses as a percentage of end of period loan receivables) increased to 12.54% at December 31, 2020, as compared to 6.42% at December 31, 2019, primarily due to the impact of the CECL implementation and impacts from COVID-19.
•Other expense decreased by $190 million, or 4.5%, for the year ended December 31, 2020, primarily driven by the cost reductions related to the sale of the Walmart consumer portfolio, lower professional fees, lower purchase volume and average active accounts, and reductions in certain discretionary spend, partially offset by a restructuring charge of $87 million and higher operational losses.
•At December 31, 2020, deposits represented 80% of our total funding sources. Total deposits decreased 3.6% to $62.8 billion at December 31, 2020, compared to December 31, 2019.
•During the year ended December 31, 2020, we declared and paid cash dividends on our Series A 5.625% non-cumulative preferred stock of $56.40 per share, or $42 million.
•During the year ended December 31, 2020, we repurchased $1.0 billion of our outstanding common stock, and declared and paid cash dividends of $0.88 per common share, or $520 million. In January 2021, we announced that the Board of Directors approved a new share repurchase program of up to $1.6 billion through December 31, 2021, beginning in the first quarter, subject to the Company's capital plan, market conditions and other factors, including regulatory restrictions and required approvals, if any.
2020 Partner Agreements
•In our Retail Card sales platform, we:
•launched new partnerships with Harbor Freight Tools, Venmo and Verizon.
•extended our program agreements with Google and Sam's Club.
•In our Payment Solutions sales platform, we:
▪announced our new partnerships with:
◦Adorama, Club Champion, Doosan Bobcat, HiSun, Levin Furniture and Mattress, Modani Furniture and Piaggio.
•extended our program agreements with:
◦ABC Warehouse, Bernina, CarX, Englert, 4 Wheel Parts, Hanks, Icahn Enterprises LP automotive brands (Pep Boys, AAMCO Transmissions, Precision Tune Auto Care, Cottman Transmission and Auto Plus Auto Parts), Kane's Furniture, Kawasaki, Living Spaces, Mattress Firm, Puronics, SVP Sewing Brands LLC, System Pavers and Vanderhall.
▪completed the sale of loan receivables associated with our program agreement with Yamaha.
•In our CareCredit sales platform, we:
▪announced our new partnership with Walgreens.
▪expanded our network through our new partnerships with AdventHealth and Community Veterinary Partners.
▪launched other healthcare system partnerships with Lehigh Valley Health Network, St. Luke's University Health Network and Cox Health.
▪acquired Allegro Credit, a leading provider of point-of-sale consumer financing for audiology products and dental services.
▪renewed our agreements with Aspen Dental, Blue River Petcare, NVA, Vision Group Holdings and West Coast Dental and extended Pets Best's relationship with Progressive.
Information About Our Executive Officers and Board of Directors
•On January 12, 2021, as part of a planned succession process, the Company announced the following events, each effective April 1, 2021:
•Margaret Keane, 61, Synchrony’s Chief Executive Officer (“CEO”), will transition roles from CEO to Executive Chair of the Board.
•Brian Doubles, 45, Synchrony’s President, will succeed Ms. Keane to become President and CEO, and will join the Board as a director.
•Rick Hartnack, 75, Non-Executive Chair of the Board, will retire.
•Jeffrey Naylor, 62, will become Lead Independent Director of the Board.
Other Financial and Statistical Data
The following table sets forth certain other financial and statistical data for the periods indicated.
| | | | | | | | | | | | | | | | | | | | | |
| At and for the years ended December 31 ($ in millions) | | | | | 2020 | | 2019 | | 2018 |
| Financial Position Data (Average): | | | | | | | | | |
| Loan receivables, including held for sale | | | | | $ | 80,138 | | | $ | 88,649 | | | $ | 83,304 | |
| Total assets | | | | | $ | 97,738 | | | $ | 105,677 | | | $ | 99,568 | |
| Deposits | | | | | $ | 64,061 | | | $ | 65,036 | | | $ | 59,498 | |
| Borrowings | | | | | $ | 16,846 | | | $ | 21,251 | | | $ | 21,951 | |
| Total equity | | | | | $ | 12,333 | | | $ | 14,917 | | | $ | 14,386 | |
| Selected Performance Metrics: | | | | | | | | | |
Purchase volume(1)(2) | | | | | $ | 139,084 | | | $ | 149,411 | | | $ | 140,657 | |
| Retail Card | | | | | $ | 107,018 | | | $ | 114,440 | | | $ | 107,685 | |
| Payment Solutions | | | | | $ | 22,041 | | | $ | 23,880 | | | $ | 22,808 | |
| CareCredit | | | | | $ | 10,025 | | | $ | 11,091 | | | $ | 10,164 | |
Average active accounts (in thousands)(2)(3) | | | | | 67,131 | | | 75,721 | | | 73,847 | |
Net interest margin(4) | | | | | 14.29 | % | | 15.78 | % | | 15.97 | % |
| Net charge-offs | | | | | $ | 3,668 | | | $ | 5,005 | | | $ | 4,692 | |
| Net charge-offs as a % of average loan receivables, including held for sale | | | | | 4.58 | % | | 5.65 | % | | 5.63 | % |
Allowance coverage ratio(5) | | | | | 12.54 | % | | 6.42 | % | | 6.90 | % |
Return on assets(6) | | | | | 1.4 | % | | 3.5 | % | | 2.8 | % |
Return on equity(7) | | | | | 11.2 | % | | 25.1 | % | | 19.4 | % |
Equity to assets(8) | | | | | 12.62 | % | | 14.12 | % | | 14.45 | % |
| Other expense as a % of average loan receivables, including held for sale | | | | | 5.06 | % | | 4.79 | % | | 4.92 | % |
Efficiency ratio(9) | | | | | 36.3 | % | | 31.9 | % | | 30.8 | % |
| Effective income tax rate | | | | | 22.9 | % | | 23.3 | % | | 23.4 | % |
| Selected Period End Data: | | | | | | | | | |
| Loan receivables | | | | | $ | 81,867 | | | $ | 87,215 | | | $ | 93,139 | |
| Allowance for credit losses | | | | | $ | 10,265 | | | $ | 5,602 | | | $ | 6,427 | |
30+ days past due as a % of period-end loan receivables(10) | | | | | 3.07 | % | | 4.44 | % | | 4.76 | % |
90+ days past due as a % of period-end loan receivables(10) | | | | | 1.40 | % | | 2.15 | % | | 2.29 | % |
Total active accounts (in thousands)(2)(3) | | | | | 68,540 | | | 75,471 | | | 80,339 | |
__________________
(1)Purchase volume, or net credit sales, represents the aggregate amount of charges incurred on credit cards or other credit product accounts less returns during the period.
(2)Includes activity and accounts associated with loan receivables held for sale.
(3)Active accounts represent credit card or installment loan accounts on which there has been a purchase, payment or outstanding balance in the current month.
(4)Net interest margin represents net interest income divided by average interest-earning assets.
(5)Allowance coverage ratio represents allowance for credit losses divided by total period-end loan receivables.
(6)Return on assets represents net earnings as a percentage of average total assets.
(7)Return on equity represents net earnings as a percentage of average total equity.
(8)Equity to assets represents average equity as a percentage of average total assets.
(9)Efficiency ratio represents (i) other expense, divided by (ii) sum of net interest income, plus other income, less retailer share arrangements.
(10)Based on customer statement-end balances extrapolated to the respective period-end date.
Average Balance Sheet
The following table sets forth information for the periods indicated regarding average balance sheet data, which are used in the discussion of interest income, interest expense and net interest income that follows.
| | | | | | | | | | | | | | | | | | | | | | | | | | | | | | | | | | | | | | | | | | | | | | | | | | | | | | | |
| | 2020 | | 2019 | 2018 | |
Years ended December 31
($ in millions) | Average
Balance | | Interest
Income /
Expense | | Average Yield / Rate(1) | | Average
Balance | | Interest
Income/
Expense | | Average Yield / Rate(1) | | Average
Balance | | Interest
Income/
Expense | | Average Yield / Rate(1) | | |
| Assets | | | | | | | | | | | | | | | | | | | |
| Interest-earning assets: | | | | | | | | | | | | | | | | | | | |
Interest-earning cash and equivalents(2) | $ | 13,301 | | | $ | 53 | | | 0.40 | % | | $ | 12,320 | | | $ | 258 | | | 2.09 | % | | $ | 11,059 | | | $ | 207 | | | 1.87 | % | | |
| Securities available for sale | 7,367 | | | 64 | | | 0.87 | % | | 5,464 | | | 127 | | | 2.32 | % | | 6,566 | | | 137 | | | 2.09 | % | | |
| | | | | | | | | | | | | | | | | | | |
Loan receivables, including held for sale(3): | | | | | | | | | | | | | | | | | | | |
| Credit cards | 77,115 | | | 15,672 | | | 20.32 | % | | 85,334 | | | 18,384 | | | 21.54 | % | | 80,219 | | | 17,342 | | | 21.62 | % | | |
| Consumer installment loans | 1,733 | | | 168 | | | 9.69 | % | | 1,963 | | | 182 | | | 9.27 | % | | 1,698 | | | 156 | | | 9.19 | % | | |
| Commercial credit products | 1,231 | | | 108 | | | 8.77 | % | | 1,306 | | | 137 | | | 10.49 | % | | 1,333 | | | 144 | | | 10.80 | % | | |
| Other | 59 | | | 2 | | | 3.39 | % | | 46 | | | 2 | | | 4.35 | % | | 54 | | | 2 | | | 3.70 | % | | |
| Total loan receivables, including held for sale | 80,138 | | | 15,950 | | | 19.90 | % | | 88,649 | | | 18,705 | | | 21.10 | % | | 83,304 | | | 17,644 | | | 21.18 | % | | |
| Total interest-earning assets | 100,806 | | | 16,067 | | | 15.94 | % | | 106,433 | | | 19,090 | | | 17.94 | % | | 100,929 | | | 17,988 | | | 17.82 | % | | |
| Non-interest-earning assets: | | | | | | | | | | | | | | | | | | | |
| Cash and due from banks | 1,488 | | | | | | | 1,327 | | | | | | | 1,224 | | | | | | | |
| Allowance for credit losses | (9,488) | | | | | | | (5,902) | | | | | | | (5,900) | | | | | | | |
| Other assets | 4,932 | | | | | | | 3,819 | | | | | | | 3,315 | | | | | | | |
| Total non-interest-earning assets | (3,068) | | | | | | | (756) | | | | | | | (1,361) | | | | | | | |
| Total assets | $ | 97,738 | | | | | | | $ | 105,677 | | | | | | | $ | 99,568 | | | | | | | |
| Liabilities | | | | | | | | | | | | | | | | | | | |
| Interest-bearing liabilities: | | | | | | | | | | | | | | | | | | | |
| Interest-bearing deposit accounts | $ | 63,755 | | | $ | 1,094 | | | 1.72 | % | | $ | 64,756 | | | $ | 1,566 | | | 2.42 | % | | $ | 59,216 | | | $ | 1,186 | | | 2.00 | % | | |
| Borrowings of consolidated securitization entities | 8,675 | | | 237 | | | 2.73 | % | | 11,941 | | | 358 | | | 3.00 | % | | 12,694 | | | 344 | | | 2.71 | % | | |
| | | | | | | | | | | | | | | | | | | |
| Senior unsecured notes | 8,171 | | | 334 | | | 4.09 | % | | 9,310 | | | 367 | | | 3.94 | % | | 9,257 | | | 340 | | | 3.67 | % | | |
| | | | | | | | | | | | | | | | | | | |
| Total interest-bearing liabilities | 80,601 | | | 1,665 | | | 2.07 | % | | 86,007 | | | 2,291 | | | 2.66 | % | | 81,167 | | | 1,870 | | | 2.30 | % | | |
| Non-interest-bearing liabilities: | | | | | | | | | | | | | | | | | | | |
| Non-interest-bearing deposit accounts | 306 | | | | | | | 280 | | | | | | | 282 | | | | | | | |
| Other liabilities | 4,498 | | | | | | | 4,473 | | | | | | | 3,733 | | | | | | | |
| Total non-interest-bearing liabilities | 4,804 | | | | | | | 4,753 | | | | | | | 4,015 | | | | | | | |
| Total liabilities | 85,405 | | | | | | | 90,760 | | | | | | | 85,182 | | | | | | | |
| Equity | | | | | | | | | | | | | | | | | | | |
| Total equity | 12,333 | | | | | | | 14,917 | | | | | | | 14,386 | | | | | | | |
| Total liabilities and equity | $ | 97,738 | | | | | | | $ | 105,677 | | | | | | | $ | 99,568 | | | | | | | |
Interest rate spread(4) | | | | | 13.87 | % | | | | | | 15.28 | % | | | | | | 15.52 | % | | |
| Net interest income | | | $ | 14,402 | | | | | | | $ | 16,799 | | | | | | | $ | 16,118 | | | | | |
Net interest margin(5) | | | | | 14.29 | % | | | | | | 15.78 | % | | | | | | 15.97 | % | | |
____________________
(1)Average yields/rates are based on total interest income/expense over average balances.
(2)Includes average restricted cash balances of $475 million, $754 million and $512 million for the years ended December 31, 2020, 2019 and 2018, respectively.
(3)Interest income on loan receivables includes fees on loans of $2.2 billion, $2.8 billion and $2.7 billion for the years ended December 31, 2020, 2019 and 2018, respectively.
(4)Interest rate spread represents the difference between the yield on total interest-earning assets and the rate on total interest-bearing liabilities.
(5)Net interest margin represents net interest income divided by average total interest-earning assets.
The following table sets forth the amount of changes in interest income and interest expense due to changes in average volume and average yield/rate. Variances due to changes in both average volume and average yield/rate have been allocated between the average volume and average yield/rate variances on a consistent basis based upon the respective percentage changes in average volume and average yield/rate.
| | | | | | | | | | | | | | | | | | | | | | | | | | | | | | | | | | | |
| 2020 vs. 2019 | | 2019 vs. 2018 |
| Increase (decrease) due to change in: | | Increase (decrease) due to change in: |
| ($ in millions) | Average Volume | | Average Yield / Rate | | Net Change | | Average Volume | | Average Yield / Rate | | Net Change |
| Interest-earning assets: | | | | | | | | | | | |
| Interest-earning cash and equivalents | $ | 19 | | | $ | (224) | | | $ | (205) | | | $ | 25 | | | $ | 26 | | | $ | 51 | |
| Securities available for sale | 34 | | | (97) | | | (63) | | | (24) | | | 14 | | | (10) | |
| Loan receivables, including held for sale: | | | | | | | | | | | |
| Credit cards | (1,708) | | | (1,004) | | | (2,712) | | | 1,106 | | | (64) | | | 1,042 | |
| Consumer installment loans | (22) | | | 8 | | | (14) | | | 25 | | | 1 | | | 26 | |
| Commercial credit products | (8) | | | (21) | | | (29) | | | (3) | | | (4) | | | (7) | |
| Other | — | | | — | | | — | | | — | | | — | | | — | |
| Total loan receivables, including held for sale | (1,738) | | | (1,017) | | | (2,755) | | | 1,128 | | | (67) | | | 1,061 | |
| Change in interest income from total interest-earning assets | $ | (1,685) | | | $ | (1,338) | | | $ | (3,023) | | | $ | 1,129 | | | $ | (27) | | | $ | 1,102 | |
| | | | | | | | | | | |
| Interest-bearing liabilities: | | | | | | | | | | | |
| Interest-bearing deposit accounts | $ | (24) | | | $ | (448) | | | $ | (472) | | | $ | 117 | | | $ | 263 | | | $ | 380 | |
| Borrowings of consolidated securitization entities | (91) | | | (30) | | | (121) | | | (21) | | | 35 | | | 14 | |
| | | | | | | | | | | |
| Senior unsecured notes | (47) | | | 14 | | | (33) | | | 2 | | | 25 | | | 27 | |
| | | | | | | | | | | |
| Change in interest expense from total interest-bearing liabilities | (162) | | | (464) | | | (626) | | | 98 | | | 323 | | | 421 | |
| Total change in net interest income | $ | (1,523) | | | $ | (874) | | | $ | (2,397) | | | $ | 1,031 | | | $ | (350) | | | $ | 681 | |
Business Trends and Conditions
We believe our business and results of operations will be impacted in the future by various trends and conditions, including the following:
•Growth in loan receivables and interest income. We have experienced significant declines in consumer purchase activity following the outbreak of COVID-19 and associated governmental preventative measures, such as closures of non-essential businesses. Interest and fees on loans decreased 14.7% for the year ended December 31, 2020 compared to the prior year period. The sale of the Walmart consumer portfolio sale drove a decline compared to the prior year period of approximately 9%. The remaining decrease in interest and fees on loans, along with a decline in loan receivables of 6% and a reduction in purchase volume for our ongoing partners of 2%, in all instances at or for the year ended December 31, 2020, were primarily due to the impacts of COVID-19. In addition, we have experienced a reduction in benchmark interest rates and we have also provided, for a temporary period of time, forbearance in terms of deferrals of minimum payments and waivers of interest and fees for qualifying cardholders that were impacted by COVID-19 and requested relief. The decreases in loan receivables and benchmark interest rates along with the forbearance actions have led to the reductions in interest income for the year ended December 31, 2020. We expect both loan receivables and interest income, which experienced the most significant adverse effects from COVID-19, to increase in 2021 as compared to the prior year, and also expect to see slowing payment rates and increasing purchase volume in the second half of 2021 which will also contribute to a return to asset growth and increases in interest income. The extent of the impacts from these conditions is currently uncertain and dependent on various factors. These factors include, the nature of and duration for which any preventative measures remain in place, including responses to increases in COVID-19 infections nationally that may occur, the pace of the national rollout of vaccinations and the type and size of any additional stimulus measures and other policy responses that the U.S. government may adopt.
•Asset quality. The COVID-19 pandemic has driven significant improvement in customer payment behavior such that our asset quality metrics have seen historic lows during 2020. Our over-30 day loan delinquencies as a percentage of period-end loan receivables decreased to 3.07% at December 31, 2020 from 4.44% at December 31, 2019. We anticipate that the current levels of filings for unemployment benefits in the United States will result in an increase from current levels in the Company’s delinquencies and net charge-off rate in 2021. We expect these increases to be partially mitigated by the effects of governmental actions such as the CARES Act, as amended by the Consolidated Appropriations Act, 2021, as well as any further proposed stimulus in 2021. As such, we anticipate experiencing increases to both delinquencies and net charge-offs to occur in the second half of 2021. During 2020 we also took certain forbearance actions for our customers impacted by COVID-19. While we have experienced a higher incidence rate of accounts becoming delinquent following their exit from these short-term programs, as compared to accounts that did not enter the forbearance program, we do not expect these actions to have a material impact to the Company's overall delinquency metrics. We have also experienced an increase to our allowance for credit losses and provision for credit losses during the year ended December 31, 2020 attributable to the impact of COVID-19, and our allowance coverage ratio at December 31, 2020 was 12.54%. As the economic environment develops during 2021, we anticipate that our loan loss reserve builds will be lower than those experienced in 2020. However, to the extent the current environment continues beyond our expectations or deteriorates further, we may experience further increases to our allowance for credit losses and provision for credit losses related to COVID-19.
•Retailer share arrangement payments under our program agreements. Retailer share arrangements decreased 5.5% to $3.6 billion for the year ended December 31, 2020, reflecting the impact of COVID-19 on program performance. We believe that the payments we make to our partners under our retailer share arrangements, in the aggregate, in 2021 are likely to decrease in absolute terms compared to the year ended December 31, 2020, primarily as a result of the performance of our programs, which would reflect the expected credit trends discussed above. This decrease will be partially offset by growth of the programs. See Management’s Discussion and Analysis—Retailer Share Arrangements for additional information on these agreements.
•Extended duration of our Retail Card program agreements. Our Retail Card program agreements typically have contract terms ranging from approximately five to ten years, and the average length of our relationship with our Retail Card partners is 23 years. We expect to continue to benefit from these programs on a long-term basis.
A total of 14 of our 25 ongoing Retail Card program agreements have an expiration date in 2025 or beyond. These 14 program agreements represented in the aggregate 87% and 88% of our Retail Card interest and fees on loans for the year ended December 31, 2020 and of our Retail Card loan receivables at December 31, 2020 attributable to our ongoing programs.
•Growth in interchange revenues and loyalty program costs. We believe that as a result of the overall growth in Dual Card and general purpose co-branded credit card transactions occurring outside of our Retail Card partners’ locations, interchange revenues will increase in excess of the growth of our Retail Card loan receivables. The expected growth in these transactions is driven, in part, by both existing and new loyalty programs with our Retail Card partners. In addition, we continue to offer and add new loyalty programs for our private label credit cards, for which we typically do not receive interchange fees. The growth in these existing and new loyalty programs will result in an increase in costs associated with these programs. Overall, we expect our loyalty program costs to continue to be largely offset by our interchange revenues. These changes have been contemplated in our program agreements with our Retail Card partners and are a component of the calculation of our payments due under our retailer share arrangements.
•Capital and liquidity levels. We continue to expect to maintain sufficient capital and liquidity resources to support our daily operations, our business growth, and our credit ratings as well as regulatory and compliance requirements in a cost effective and prudent manner through expected and unexpected market environments. During the year ended December 31, 2020, we declared and paid dividends of $520 million and repurchased $1.0 billion of our outstanding common stock. In response to the COVID-19 outbreak, we temporarily suspended our share repurchase plans in 2020. We plan to continue to deploy capital through both dividends and share repurchases subject to regulatory approval, as well as to support business growth. In January 2021, we announced that the Board of Directors approved a new share repurchase program of up to $1.6 billion through December 31, 2021, beginning in the first quarter of 2021, subject to the Company’s capital plan, market conditions and other factors, including regulatory restrictions and required approvals, if any. We continue to expect to maintain capital ratios well in excess of minimum regulatory requirements. At December 31, 2020, the Company had a Basel III common equity Tier 1 ratio of 15.9%, which reflects our election to defer the impact of CECL on our regulatory capital, which will now be phased-in over a three-year period from January 1, 2022 through December 31, 2024.
We expect that our liquidity portfolio will continue to be sufficient to support all of our business objectives and to meet all regulatory requirements for the foreseeable future. At December 31, 2020, due to the reduction in loan receivables and strength in our deposit platform, we continued to carry a high level of liquidity, which we expect to continue through the first half of 2021 in line with our expectations of customer payment behavior. We expect to deploy this excess liquidity during the second half of 2021 in line with our expectations of receivable growth, which will contribute to an increase in net interest margin in the second half of 2021 as we deploy this excess liquidity.
Seasonality
In our Retail Card and Payment Solutions platforms, we experience fluctuations in transaction volumes and the level of loan receivables as a result of higher seasonal consumer spending and payment patterns that typically result in an increase of loan receivables from August through a peak in late December, with reductions in loan receivables occurring over the first and second quarters of the following year as customers pay their balances down.
The seasonal impact to transaction volumes and the loan receivables balance typically results in fluctuations in our results of operations, delinquency metrics and the allowance for credit losses as a percentage of total loan receivables between quarterly periods. These fluctuations are generally most evident between the fourth quarter and the first quarter of the following year.
In addition to the seasonal variance in loan receivables discussed above, we also typically experience a seasonal increase in delinquency rates and delinquent loan receivables balances during the third and fourth quarters of each year due to lower customer payment rates resulting in higher net charge-off rates in the first and second quarters. Our delinquency rates and delinquent loan receivables balances typically decrease during the subsequent first and second quarters as customers begin to pay down their loan balances and return to current status resulting in lower net charge-off rates in the third and fourth quarters. Because customers who were delinquent during the fourth quarter of a calendar year have a higher probability of returning to current status when compared to customers who are delinquent at the end of each of our interim reporting periods, we expect that a higher proportion of delinquent accounts outstanding at an interim period end will result in charge-offs, as compared to delinquent accounts outstanding at a year end. Consistent with this historical experience, we generally experience a higher allowance for credit losses as a percentage of total loan receivables at the end of an interim period, as compared to the end of a calendar year. In addition, despite improving credit metrics such as declining past due amounts, we may experience an increase in our allowance for credit losses at an interim period end compared to the prior year end, reflecting these same seasonal trends.
Interest Income
Interest income is comprised of interest and fees on loans, which includes merchant discounts provided by partners to compensate us in almost all cases for all or part of the promotional financing provided to their customers, and interest on cash and equivalents and investment securities. We include in interest and fees on loans any past due interest and fees deemed to be collectible. Direct loan origination costs on credit card loans are deferred and amortized on a straight-line basis over a one-year period and recorded in interest and fees on loans. For non-credit card receivables, direct loan origination costs are deferred and amortized over the life of the loan and recorded in interest and fees on loans.
We analyze interest income as a function of two principal components: average interest-earning assets and yield on average interest-earning assets. Key drivers of average interest-earning assets include:
•purchase volumes, which are influenced by a number of factors including macroeconomic conditions and consumer confidence generally, our partners’ sales and our ability to increase our share of those sales;
•payment rates, reflecting the extent to which customers maintain a credit balance;
•charge-offs, reflecting the receivables that are deemed not to be collectible;
•the size of our liquidity portfolio; and
•portfolio acquisitions when we enter into new partner relationships.
Key drivers of yield on average interest-earning assets include:
•pricing (contractual rates of interest, movement in prime rates, late fees and merchant discount rates);
•changes to our mix of loans (e.g., the number of loans bearing promotional rates as compared to standard rates);
•frequency of late fees incurred when account holders fail to make their minimum payment by the required due date;
•credit performance and accrual status of our loans; and
•yield earned on our liquidity portfolio.
Interest income decreased by $3.0 billion, or 15.8%, for the year ended December 31, 2020. The decrease was driven primarily by a decrease in interest and fees on loans related to the Walmart consumer portfolio sale, as well as the impact of COVID-19. The sale of the Walmart consumer portfolio drove a decline in interest and fees on loans compared to the prior year period of approximately 9%.
Average interest-earning assets
| | | | | | | | | | | | | |
| Years ended December 31 ($ in millions) | 2020 | | 2019 | | |
| Loan receivables, including held for sale | $ | 80,138 | | | $ | 88,649 | | | |
| Liquidity portfolio and other | 20,668 | | | 17,784 | | | |
| Total average interest-earning assets | $ | 100,806 | | | $ | 106,433 | | | |
The decrease in average loan receivables, including held for sale, of 9.6% for the year ended December 31, 2020 was primarily driven by the sale of loan receivables associated with the Walmart and Yamaha portfolios, in October 2019 and January 2020, respectively. In addition, the decreases also reflect a decline in average active accounts of 4.2% at our ongoing partner programs, primarily due to the impact of COVID-19.
Yield on average interest-earning assets
The yield on average interest-earning assets decreased for the year ended December 31, 2020 primarily due to a decrease in the yield on average loan receivables and a decrease in the percentage of interest-earning assets attributable to loan receivables. The yield on average loan receivables, including held for sale, decreased 120 basis points to 19.90% for the year ended December 31, 2020, primarily driven by lower benchmark rates and the sale of the Walmart consumer portfolio, as well as fee and interest waivers related to COVID-19.
Interest Expense
Interest expense is incurred on our interest-bearing liabilities, which consisted of interest-bearing deposit accounts, borrowings of consolidated securitization entities and senior unsecured notes.
Key drivers of interest expense include:
•the amounts outstanding of our deposits and borrowings;
•the interest rate environment and its effect on interest rates paid on our funding sources; and
•the changing mix in our funding sources.
Interest expense decreased by $626 million, or 27.3%, for the year ended December 31, 2020, primarily driven by lower benchmark interest rates and a decrease in borrowings of our securitization entities and senior unsecured notes. Our cost of funds decreased to 2.07% for the year ended December 31, 2020 compared to 2.66% for the year ended December 31, 2019.
Average interest-bearing liabilities
| | | | | | | | | | | | | | | | | |
| Years ended December 31 ($ in millions) | | | | | 2020 | | 2019 | | |
| Interest-bearing deposit accounts | | | | | $ | 63,755 | | | $ | 64,756 | | | |
| Borrowings of consolidated securitization entities | | | | | 8,675 | | | 11,941 | | | |
| Senior unsecured notes | | | | | 8,171 | | | 9,310 | | | |
| | | | | | | | | |
| Total average interest-bearing liabilities | | | | | $ | 80,601 | | | $ | 86,007 | | | |
The decrease in average interest-bearing liabilities for the year ended December 31, 2020 was primarily driven by a decrease in borrowings of our securitization entities and senior unsecured notes.
Net Interest Income
Net interest income represents the difference between interest income and interest expense.
Net interest income decreased by $2.4 billion, or 14.3%, for the year ended December 31, 2020, primarily driven by a decrease in interest and fees on loans related to the Walmart consumer portfolio sale and the impact of COVID-19, partially offset by a decrease in interest expense reflecting lower benchmark interest rates.
Retailer Share Arrangements
Most of our Retail Card program agreements and certain other program agreements contain retailer share arrangements that provide for payments to our partners if the economic performance of the program exceeds a contractually defined threshold. We also provide other economic benefits to our partners such as royalties on purchase volume or payments for new accounts, in some cases instead of retailer share arrangements (for example, on our co-branded credit cards). All of these arrangements are designed to align our interests and provide an additional incentive to our partners to promote our credit products. Although the retailer share arrangements vary by partner, these arrangements are generally structured to measure the economic performance of the program, based typically on agreed upon program revenues (including interest income and certain other income) less agreed upon program expenses (including interest expense, provision for credit losses, retailer payments and operating expenses), and share portions of this amount above a negotiated threshold. The threshold and economic performance of a program that are used to calculate payments to our partners may be based on, among other things, agreed upon measures of program expenses rather than our actual expenses, and therefore increases in our actual expenses (such as funding costs or operating expenses) may not necessarily result in reduced payments under our retailer share arrangements. These arrangements are typically designed to permit us to achieve an economic return before we are required to make payments to our partners based on the agreed contractually defined threshold. Our payments to partners pursuant to these retailer share arrangements have generally increased in recent years, primarily as a result of the growth and performance of the programs in which we have retailer share arrangements, as well as changes to the terms of certain program agreements that have been renegotiated in the past few years.
We believe that our retailer share arrangements have been effective in helping us to grow our business by aligning our partners’ interests with ours. We also believe that the changes to the terms of certain program agreements in recent years will help us to grow our business by providing an additional incentive to the relevant partners to promote our credit products going forward. Payments to partners pursuant to these retailer share arrangements would generally decrease, and mitigate the impact on our profitability, in the event of declines in the performance of the programs or the occurrence of other unfavorable developments that impact the calculation of payments to our partners pursuant to our retailer share arrangements.
Retailer share arrangements decreased by $213 million, or 5.5%, for the year ended December 31, 2020, reflecting the impact of COVID-19 on program performance.
Provision for Credit Losses
Provision for credit losses is the expense related to maintaining the allowance for credit losses at an appropriate level to absorb the expected credit losses for the life of the loan balance as of the period end date. Provision for credit losses in each period is a function of net charge-offs (gross charge-offs net of recoveries) and the required level of the allowance for credit losses. Our process to determine our allowance for credit losses is based upon our estimate of expected credit losses for the life of the loan balance as of the period end date. See “Critical Accounting Estimates - Allowance for Credit Losses” and Note 2. Basis of Presentation and Summary of Significant Accounting Policies to our consolidated financial statements for additional information on our allowance for credit loss methodology.
Provision for credit losses increased by $1.1 billion, or 27.0%, for the year ended December 31, 2020, primarily driven by the effects of the prior year reductions in reserves for credit losses related to the Walmart consumer portfolio sale and higher reserve build in the current year, partially offset by lower net charge-offs.
The higher reserve build reflects both the projected impacts of COVID-19 and the increase attributable to the CECL implementation of $285 million for the year ended December 31, 2020. The prior year reductions in reserves related to the Walmart consumer portfolio were $1.1 billion for the year ended December 31, 2019. Our allowance coverage ratio increased to 12.54% at December 31, 2020, as compared to 6.42% at December 31, 2019.
Other Income
| | | | | | | | | | | | | | | | | |
| Years ended December 31 ($ in millions) | | | | | 2020 | | 2019 | | |
| Interchange revenue | | | | | $ | 652 | | | $ | 748 | | | |
| Debt cancellation fees | | | | | 278 | | | 265 | | | |
| Loyalty programs | | | | | (649) | | | (743) | | | |
| Other | | | | | 124 | | | 101 | | | |
| Total other income | | | | | $ | 405 | | | $ | 371 | | | |
Interchange revenue
We earn interchange fees on Dual Card and other co-branded credit card transactions outside of our partners’ sales channels, based on a flat fee plus a percentage of the purchase amount. Interchange revenue has been, and is expected to continue to be, driven primarily by growth in our Dual Card and general purpose co-branded credit card products.
Interchange revenue decreased by $96 million, or 12.8%, for the year ended December 31, 2020, driven by lower purchase volume and the effects from the Walmart consumer portfolio sale.
Debt cancellation fees
Debt cancellation fees relate to payment protection products purchased by our credit card customers. Customers who choose to purchase these products are charged a monthly fee based on their account balance. In return, we will cancel all or a portion of a customer’s credit card balance in the event of certain qualifying life events. We offer our debt cancellation product to our credit card customers via online, mobile and, on a limited basis, direct mail.
Debt cancellation fees increased by $13 million, or 4.9%, for the year ended December 31, 2020, primarily as a result of increases in our CareCredit and Payment Solutions sales platforms, partially offset by the effects from the Walmart consumer portfolio sale.
Loyalty programs
We operate a number of loyalty programs primarily in our Retail Card platform that are designed to generate incremental purchase volume per customer, while reinforcing the value of the card and strengthening cardholder loyalty. These programs typically provide cardholders with statement credit or cash back rewards. Other programs include rewards points, which are redeemable for a variety of products or awards, or merchandise discounts that are earned by achieving a pre-set spending level on their private label credit card, Dual Card or general purpose co-branded credit card. Growth in loyalty program payments has been, and is expected to continue to be, driven by growth in purchase volume related to existing loyalty programs and the rollout of new loyalty programs.
Loyalty programs cost decreased by $94 million, or 12.7%, for the year ended December 31, 2020, primarily as a result of the Walmart consumer portfolio sale and lower purchase volume due to the effects of COVID-19, partially offset by growth related to our digital partners.
Other
Other includes a variety of items including ancillary fees, commission fees related to Pets Best, changes in the fair value of equity investments, realized gains or losses associated with the sale of investments or other assets and changes in contingent consideration obligations.
Other increased by $23 million, or 22.8%, for the year ended December 31, 2020 primarily due to gains related to investment securities and commission fees related to Pets Best.
Other Expense
| | | | | | | | | | | | | | | | | |
| Years ended December 31 ($ in millions) | | | | | 2020 | | 2019 | | |
| Employee costs | | | | | $ | 1,380 | | | $ | 1,455 | | | |
| Professional fees | | | | | 759 | | | 867 | | | |
| Marketing and business development | | | | | 448 | | | 549 | | | |
| Information processing | | | | | 492 | | | 485 | | | |
| Other | | | | | 976 | | | 889 | | | |
| Total other expense | | | | | $ | 4,055 | | | $ | 4,245 | | | |
Employee costs
Employee costs primarily consist of employee compensation and benefit costs.
Employee costs decreased by $75 million, or 5.2%, for the year ended December 31, 2020, primarily driven by reductions in headcount, partially offset by a restructuring charge of $41 million incurred in 2020.
Professional fees
Professional fees consist primarily of outsourced provider fees (e.g., collection agencies and call centers), legal, accounting, consulting, and recruiting expenses.
Professional fees decreased by $108 million, or 12.5%, for the year ended December 31, 2020, primarily due to interim servicing costs in the prior year associated with acquired portfolios.
Marketing and business development
Marketing and business development costs consist primarily of our contractual and discretionary marketing and business development spend, as well as amortization expense associated with retail partner contract acquisitions and extensions.
Marketing and business development costs decreased by $101 million, or 18.4%, for the year ended December 31, 2020, primarily due to lower brand advertising and lower portfolio marketing investments.
Information processing
Information processing costs primarily consist of fees related to outsourced information processing providers, credit card associations and software licensing agreements.
Information processing costs increased slightly by $7 million, or 1.4%, for the year ended December 31, 2020, primarily due to higher amortization of capitalized software related to strategic investments, partially offset by lower data processing costs.
Other
Other primarily consists of postage, operational losses, litigation and regulatory matters expense and various other corporate overhead items such as facilities' costs and telephone charges. Postage is driven primarily by the number of our active accounts and the percentage of customers that utilize our electronic billing option. Fraud, or operational losses, are driven primarily by the number of our active Dual Card and general purpose co-branded credit card accounts.
The “other” component increased by $87 million, or 9.8%, for the year ended December 31, 2020, primarily due to a restructuring charge of $46 million related to operating lease and other asset impairments, as well as higher operational losses.
Provision for Income Taxes
| | | | | | | | | | | | | |
| Years ended December 31 ($ in millions) | 2020 | | 2019 | | |
| Effective tax rate | 22.9 | % | | 23.3 | % | | |
| Provision for income taxes | $ | 412 | | | $ | 1,140 | | | |
The effective tax rate for the year ended December 31, 2020, decreased compared to the prior year primarily due to the decline in pre-tax income, which led to a proportionally larger impact related to discrete tax benefits. The effective tax rate differs from the U.S. federal statutory tax rate primarily due to state income taxes.
Platform Analysis
As discussed above under “Our Business—Our Sales Platforms,” we offer our products through three sales platforms (Retail Card, Payment Solutions and CareCredit), which management measures based on their revenue-generating activities. The following is a discussion of certain supplemental information for the year ended December 31, 2020, for each of our sales platforms.
Retail Card
| | | | | | | | | | | | | | | | | |
| Years ended December 31 ($ in millions) | | | | | 2020 | | 2019 | | |
| Purchase volume | | | | | $ | 107,018 | | | $ | 114,440 | | | |
| Period-end loan receivables | | | | | $ | 52,130 | | | $ | 56,387 | | | |
| Average loan receivables, including held for sale | | | | | $ | 50,943 | | | $ | 58,984 | | | |
| Average active accounts (in thousands) | | | | | 49,258 | | | 57,073 | | | |
| | | | | | | | | |
| Interest and fees on loans | | | | | $ | 11,015 | | | $ | 13,557 | | | |
| Retailer share arrangements | | | | | $ | (3,559) | | | $ | (3,762) | | | |
| Other income | | | | | $ | 249 | | | $ | 277 | | | |
Retail Card interest and fees on loans decreased by $2,542 million, or 18.8%, for the year ended December 31, 2020. The sale of the Walmart consumer portfolio drove a decline compared to the prior year period of approximately 12%. The remaining decrease was primarily due to the impact of COVID-19.
Retailer share arrangements decreased by $203 million, or 5.4%, for the year ended December 31, 2020, primarily as a result of the factors discussed under the heading “Retailer Share Arrangements” above.
Other income decreased by $28 million, or 10.1%, for the year ended December 31, 2020, primarily driven by a decrease in interchange revenue and the effects from the Walmart consumer portfolio sale, partially offset by lower loyalty costs.
Payment Solutions
| | | | | | | | | | | | | | | | | |
| Years ended December 31 ($ in millions) | | | | | 2020 | | 2019 | | |
| Purchase volume | | | | | $ | 22,041 | | | $ | 23,880 | | | |
| Period-end loan receivables | | | | | $ | 20,153 | | | $ | 20,528 | | | |
| Average loan receivables, including held for sale | | | | | $ | 19,597 | | | $ | 19,918 | | | |
| Average active accounts (in thousands) | | | | | 11,921 | | | 12,451 | | | |
| | | | | | | | | |
| Interest and fees on loans | | | | | $ | 2,661 | | | $ | 2,829 | | | |
| Retailer share arrangements | | | | | $ | (73) | | | $ | (85) | | | |
| Other income | | | | | $ | 44 | | | $ | 15 | | | |
Payment Solutions interest and fees on loans decreased by $168 million, or 5.9%, for the year ended December 31, 2020. The decrease was primarily driven by lower yield on loan receivables and the sale of the Yamaha portfolio.
CareCredit
| | | | | | | | | | | | | | | | | |
| | | |
| Years ended December 31 ($ in millions) | | | | | 2020 | | 2019 | | |
| Purchase volume | | | | | $ | 10,025 | | | $ | 11,091 | | | |
| Period-end loan receivables | | | | | $ | 9,584 | | | $ | 10,300 | | | |
| Average loan receivables | | | | | $ | 9,598 | | | $ | 9,747 | | | |
| Average active accounts (in thousands) | | | | | 5,952 | | | 6,197 | | | |
| | | | | | | | | |
| Interest and fees on loans | | | | | $ | 2,274 | | | $ | 2,319 | | | |
| Retailer share arrangements | | | | | $ | (13) | | | $ | (11) | | | |
| Other income | | | | | $ | 112 | | | $ | 79 | | | |
CareCredit interest and fees on loans decreased by $45 million, or 1.9%, for the year ended December 31, 2020. The decrease was primarily driven by lower merchant discount as a result of the decline in purchase volume and a reduction in average loan receivables.
Other income increased by $33 million, or 41.8%, for the year ended December 31, 2020 primarily due to commission fees earned by Pets Best.
Loan Receivables
____________________________________________________________________________________________
Loan receivables are our largest category of assets and represent our primary source of revenues. The following discussion provides supplemental information regarding our loan receivables portfolio. See Note 2. Basis of Presentation and Summary of Significant Accounting Policies and Note 4. Loan Receivables and Allowance for Credit Losses to our consolidated financial statements for additional information related to our Loan Receivables, including troubled debt restructurings.
Our loan receivables portfolio, excluding held for sale, had the following maturity distribution at December 31, 2020.
| | | | | | | | | | | | | | | | | | | | | | | | | | | | | |
| ($ in millions) | Within 1 Year(1) | | 1-5 Years(2) | | 5-15 Years | | After
15 Years | | Total |
| Loans | | | | | | | | | |
| Credit cards | $ | 77,698 | | | $ | 757 | | | $ | — | | | $ | — | | | $ | 78,455 | |
Consumer installment loans(3) | 670 | | | 1,443 | | | 12 | | | — | | | 2,125 | |
| Commercial credit products | 1,245 | | | 5 | | | — | | | — | | | 1,250 | |
| Other | 13 | | | 6 | | | 16 | | | 2 | | | 37 | |
| Total loans | $ | 79,626 | | | $ | 2,211 | | | $ | 28 | | | $ | 2 | | | $ | 81,867 | |
| Loans due after one year at fixed interest rates | N/A | | $ | 2,211 | | | $ | 28 | | | $ | 2 | | | $ | 2,241 | |
| Loans due after one year at variable interest rates | N/A | | — | | | — | | | — | | | — | |
| Total loans due after one year | N/A | | $ | 2,211 | | | $ | 28 | | | $ | 2 | | | $ | 2,241 | |
______________________
(1)Credit card loans have minimum payment requirements but no stated maturity and therefore are included in the due within one year category. However, many of our credit card holders will revolve their balances, which may extend their repayment period beyond one year for balances at December 31, 2020.
(2)Credit card and commercial loans due after one year relate to Troubled Debt Restructuring ("TDR") assets.
(3)Reflects scheduled repayments up to the final contractual maturity of our installment loans.
Our loan receivables portfolio had the following geographic concentration at December 31, 2020.
| | | | | | | | | | | | | | |
| ($ in millions) | | Loan Receivables
Outstanding | | % of Total Loan
Receivables
Outstanding |
| State | |
| Texas | | $ | 8,392 | | | 10.3 | % |
| California | | $ | 8,367 | | | 10.2 | % |
| Florida | | $ | 7,072 | | | 8.6 | % |
| New York | | $ | 4,507 | | | 5.5 | % |
| North Carolina | | $ | 3,384 | | | 4.1 | % |
COVID-19 Related Loan Modifications
TDRs are those loans for which we have granted a concession to a borrower experiencing financial difficulties where we do not receive adequate compensation. These loans are identified at the point when the borrower enters into a modification program. See Note 4. Loan Receivables and Allowance for Credit Losses to our consolidated financial statements for additional information on loans classified as TDRs. However, short-term loan modifications to support our customers impacted by COVID-19 are not accounted for as a TDR.
Under the CARES Act, banks may elect to deem that loan modifications do not result in TDRs if they are (1) related to COVID-19; (2) executed on a loan that was not more than 30 days past due as of December 31, 2019; and (3) executed between March 1, 2020, and the earlier of (A) 60 days after the date of termination of the National Emergency or (B) January 1, 2022. At December 31, 2020, we have not made such an election.
However, certain other short-term modifications made on a good faith basis in response to COVID-19 are also not considered TDRs under ASC Subtopic 310-40. This includes delays in payment that are insignificant or short-term (e.g., up to six months) modifications such as payment deferrals, fee waivers or extensions of repayment terms to borrowers who were current prior to any relief. Borrowers considered current are those that are less than 30 days past due on their contractual payments at the time a modification program is implemented.
During 2020 we provided support to our customers impacted by COVID-19 through various actions, such as minimum payment deferrals and interest and late fee waivers. Loans enrolled in minimum payment deferrals generally continued to accrue interest and their delinquency status as of the modification date did not advance through the deferment period.
During the year ended December 31, 2020, we enrolled approximately 2.1 million customers in short-term modifications to defer minimum payments, representing $3.9 billion in loan receivables. The substantial majority of these enrollments were for our credit card customers. For certain customers we also provided waivers of interest charges or late fees. During the year ended December 31, 2020, the waivers of interest and late fees provided to our customers resulted in foregone interest and fee income of $88 million.
At December 31, 2020, all of the enrolled accounts have exited our forbearance programs. While we have experienced a higher incidence rate of accounts becoming delinquent following their exit from these short-term programs, as compared to accounts that did not enter the forbearance program, these accounts did not have a material impact to the Company's overall delinquency metrics at December 31, 2020.
Delinquencies
Over-30 day loan delinquencies as a percentage of period-end loan receivables decreased to 3.07% at December 31, 2020, as compared to 4.44% at December 31, 2019. The 137 basis point decrease in 2020 was primarily driven by an improvement in customer payment behavior.
Net Charge-Offs
Net charge-offs consist of the unpaid principal balance of loans held for investment that we determine are uncollectible, net of recovered amounts. We exclude accrued and unpaid finance charges and fees and third-party fraud losses from charge-offs. Charged-off and recovered finance charges and fees are included in interest and fees on loans while third-party fraud losses are included in other expense. Charge-offs are recorded as a reduction to the allowance for credit losses and subsequent recoveries of previously charged-off amounts are credited to the allowance for credit losses. Costs incurred to recover charged-off loans are recorded as collection expense and included in other expense in our Consolidated Statements of Earnings.
The table below sets forth the ratio of net charge-offs to average loan receivables, including held for sale, (“net charge-off rate”) for the periods indicated.
| | | | | | | | | | | | | | | | | | | | | | | | | |
| Years ended December 31 | | | | | 2020 | | 2019 | | 2018 | | | | |
| Net charge-off rate | | | | | 4.58 | % | | 5.65 | % | | 5.63 | % | | | | |
Allowance for Credit Losses and Impact of Adoption of CECL
The allowance for credit losses totaled $10.3 billion at December 31, 2020, compared with allowance for loan losses of $5.6 billion at December 31, 2019. Similarly, our allowance for credit losses as a percentage of total loan receivables increased to 12.54% at December 31, 2020, from 6.42% at December 31, 2019.
The increases in the allowance for credit losses and allowance coverage ratio reflect the impact of the CECL adoption and implementation in January 2020. Upon adoption of the accounting standard on January 1, 2020, we recorded an increase to our allowance for loan losses of $3.0 billion. The allowance for credit losses at December 31, 2020 reflects our estimate of expected credit losses for the life of the loan receivables on our consolidated statement of financial position at December 31, 2020, which includes the consideration of current and expected macroeconomic conditions that existed at that date.
During the initial year of implementation of the CECL accounting standard we continued to determine what our allowance for credit losses and allowance coverage ratio would have been if the prior accounting guidance were still in effect, in order to help provide comparability with our prior year results. The following table illustrates the effects of the implementation of the accounting standard to our allowance for credit losses and allowance coverage ratio at December 31, 2020.
| | | | | | | | | | | | | | | | | | | | | | | | | | |
| ($ in millions) | | Amounts under prior accounting guidance(1) | | Impact of adoption of CECL (January 1, 2020) | | Ongoing implementation of CECL model | | GAAP reported amounts |
| At December 31, 2020 | | | | |
| Allowance for credit losses | | $ | 6,959 | | | $ | 3,021 | | | $ | 285 | | | $ | 10,265 | |
| Allowance coverage ratio | | 8.50 | % | | 3.69 | % | | 0.35 | % | | 12.54 | % |
______________________
(1)Amounts shown above as if the prior accounting guidance remained in effect are non-GAAP measures and are presented only in this initial year after adoption for comparability with the prior year reported GAAP metrics.
In addition to the effects of the increases attributable to CECL noted in the above table, our allowance coverage ratio increased as compared to December 31, 2019 primarily due to the projected impacts from COVID-19.
Credit Quality Indicators
As part of our credit risk management activities, on an ongoing basis, we assess overall credit quality by reviewing information related to the performance of a customer’s account with us, as well as information from credit bureaus relating to the customer’s broader credit performance. We now utilize VantageScore (“Vantage”) credit scores to assist in our assessment of credit quality as we believe Vantage scores more U.S. consumers, and potential applicants, as compared to our prior use of FICO credit scores. Vantage credit scores are obtained at origination of the account and are refreshed, at a minimum quarterly, but could be as often as weekly, to assist in predicting customer behavior. We categorize these credit scores into the following three credit score categories: (i) 651 or higher, which are considered the strongest credits; (ii) 591 to 650, considered moderate credit risk; and (iii) 590 or less, which are considered weaker credits. We believe these three categories of Vantage credit scores represent an approximation of the categories previously reported using FICO data in terms of both probability of default and customer account distribution.
The following charts show the proportion of our loan portfolios that were from customers with a Vantage score of 651 or higher, as compared to those customers with a FICO score of 661 or higher. The quarterly information presented illustrates the comparability of credit trends under each scoring method and category of strongest credit.
See Note 4. Loan Receivables and Allowance for Credit Losses to our consolidated financial statements for additional information related to our credit quality indicators related to our loan receivables.
Funding, Liquidity and Capital Resources
____________________________________________________________________________________________
We maintain a strong focus on liquidity and capital. Our funding, liquidity and capital policies are designed to ensure that our business has the liquidity and capital resources to support our daily operations, our business growth, our credit ratings and our regulatory and policy requirements, in a cost effective and prudent manner through expected and unexpected market environments.
Funding Sources
Our primary funding sources include cash from operations, deposits (direct and brokered deposits), securitized financings and senior unsecured notes.
The following table summarizes information concerning our funding sources during the periods indicated:
| | | | | | | | | | | | | | | | | | | | | | | | | | | | | | | | | | | | | | | | | | | | | | | | | | | | | |
| | 2020 | | 2019 | | 2018 |
| Years ended December 31 ($ in millions) | Average
Balance | | % | | Average
Rate | | Average
Balance | | % | | Average
Rate | | Average
Balance | | % | | Average
Rate |
Deposits(1) | $ | 63,755 | | | 79.1 | % | | 1.7 | % | | $ | 64,756 | | | 75.3 | % | | 2.4 | % | | $ | 59,216 | | | 73.0 | % | | 2.0 | % |
| Securitized financings | 8,675 | | | 10.8 | | | 2.7 | | | 11,941 | | | 13.9 | | | 3.0 | | | 12,694 | | | 15.6 | | | 2.7 | |
| Senior unsecured notes | 8,171 | | | 10.1 | | | 4.1 | | | 9,310 | | | 10.8 | | | 3.9 | | | 9,257 | | | 11.4 | | | 3.7 | |
| | | | | | | | | | | | | | | | | |
| | | | | | | | | | | | | | | | | |
| Total | $ | 80,601 | | | 100.0 | % | | 2.1 | % | | $ | 86,007 | | | 100.0 | % | | 2.7 | % | | $ | 81,167 | | | 100.0 | % | | 2.3 | % |
______________________
(1)Excludes $306 million, $280 million and $282 million average balance of non-interest-bearing deposits for the years ended December 31, 2020, 2019 and 2018, respectively. Non-interest-bearing deposits comprise less than 10% of total deposits for the years ended December 31, 2020, 2019 and 2018.
Deposits
We obtain deposits directly from retail and commercial customers (“direct deposits”) or through third-party brokerage firms that offer our deposits to their customers (“brokered deposits”). At December 31, 2020, we had $52.1 billion in direct deposits and $10.7 billion in deposits originated through brokerage firms (including network deposit sweeps procured through a program arranger that channels brokerage account deposits to us). A key part of our liquidity plan and funding strategy is to continue to utilize our direct deposits base as a source of stable and diversified low cost funding.
Our direct deposits include a range of FDIC-insured deposit products, including certificates of deposit, IRAs, money market accounts and savings accounts.
Brokered deposits are primarily from retail customers of large brokerage firms. We have relationships with 11 brokers that offer our deposits through their networks. Our brokered deposits consist primarily of certificates of deposit that bear interest at a fixed rate and at December 31, 2020, had a weighted average remaining life of 1.7 years. These deposits generally are not subject to early withdrawal.
Our ability to attract deposits is sensitive to, among other things, the interest rates we pay, and therefore, we bear funding risk if we fail to pay higher rates, or interest rate risk if we are required to pay higher rates, to retain existing deposits or attract new deposits. To mitigate these risks, our funding strategy includes a range of deposit products, and we seek to maintain access to multiple other funding sources, including securitized financings (including our undrawn committed capacity) and unsecured debt.
The following table summarizes certain information regarding our interest-bearing deposits by type (all of which constitute U.S. deposits) for the periods indicated:
| | | | | | | | | | | | | | | | | | | | | | | | | | | | | | | | | | | | | | | | | | | | | | | | | | | | | |
| Years ended December 31 ($ in millions) | 2020 | | 2019 | | 2018 |
Average
Balance | | % | | Average
Rate | | Average
Balance | | % | | Average
Rate | | Average
Balance | | % | | Average
Rate |
| Direct deposits: | | | | | | | | | | | | | | | | | |
| Certificates of deposit (including IRA certificates of deposit) | $ | 30,816 | | | 48.3 | % | | 2.1 | % | | $ | 33,482 | | | 51.7 | % | | 2.5 | % | | $ | 28,152 | | | 47.5 | % | | 1.9 | % |
| Savings accounts (including money market accounts) | 21,910 | | | 34.4 | % | | 1.1 | | | 18,773 | | | 29.0 | | | 2.1 | | | 17,989 | | | 30.4 | | | 1.7 | |
| Brokered deposits | 11,029 | | | 17.3 | % | | 1.8 | | | 12,501 | | | 19.3 | | | 2.7 | | | 13,075 | | | 22.1 | | | 2.5 | |
| Total interest-bearing deposits | $ | 63,755 | | | 100.0 | % | | 1.7 | % | | $ | 64,756 | | | 100.0 | % | | 2.4 | % | | $ | 59,216 | | | 100.0 | % | | 2.0 | % |
Our deposit liabilities provide funding with maturities ranging from one day to ten years. At December 31, 2020, the weighted average maturity of our interest-bearing time deposits was 1.0 years. See Note 7. Deposits to our consolidated financial statements for more information on their maturities.
The following table summarizes deposits by contractual maturity at December 31, 2020.
| | | | | | | | | | | | | | | | | | | | | | | | | | | | | |
| ($ in millions) | 3 Months or
Less | | Over
3 Months
but within
6 Months | | Over
6 Months
but within
12 Months | | Over
12 Months | | Total |
U.S. deposits (less than FDIC insurance limit)(1)(2) | $ | 30,096 | | | $ | 5,222 | | | $ | 6,214 | | | $ | 8,403 | | | $ | 49,935 | |
U.S. deposits (in excess of FDIC insurance limit)(2) | | | | | | | | | |
| Direct deposits: | | | | | | | | | |
| Certificates of deposit (including IRA certificates of deposit) | 1,979 | | | 1,381 | | | 1,783 | | | 1,347 | | | 6,490 | |
| Savings accounts (including money market accounts) | 6,336 | | | — | | | — | | | — | | | 6,336 | |
| Brokered deposits: | | | | | | | | | |
| Sweep accounts | 21 | | | — | | | — | | | — | | | 21 | |
| Total | $ | 38,432 | | | $ | 6,603 | | | $ | 7,997 | | | $ | 9,750 | | | $ | 62,782 | |
______________________
(1)Includes brokered certificates of deposit for which underlying individual deposit balances are assumed to be less than $250,000.
(2)The standard deposit insurance amount is $250,000 per depositor, for each account ownership category. Deposits in excess of FDIC insurance limit presented above include partially uninsured accounts.
Securitized Financings
We access the asset-backed securitization market using the Synchrony Credit Card Master Note Trust (“SYNCT”) and the Synchrony Card Issuance Trust (“SYNIT”) through which we may issue asset-backed securities through both public transactions and private transactions funded by financial institutions and commercial paper conduits. In addition, we issue asset-backed securities in private transactions through the Synchrony Sales Finance Master Trust (“SFT”).
At December 31, 2020, we had $2.3 billion of outstanding private asset-backed securities and $5.5 billion of outstanding public asset-backed securities, in each case held by unrelated third parties.
The following table summarizes expected contractual maturities of the investors’ interests in securitized financings, excluding debt premiums, discounts and issuance costs at December 31, 2020.
| | | | | | | | | | | | | | | | | | | | | | | | | | | | | |
| ($ in millions) | Less Than
One Year | | One Year
Through
Three
Years | | Four
Years
Through
Five
Years | | After Five
Years | | Total |
| Scheduled maturities of long-term borrowings—owed to securitization investors: | | | | | | | | | |
SYNCT(1) | $ | 2,325 | | | $ | 2,591 | | | $ | — | | | $ | — | | | $ | 4,916 | |
| SFT | — | | | 300 | | | — | | | — | | | 300 | |
SYNIT(1) | 1,000 | | | 1,600 | | | — | | | — | | | 2,600 | |
| Total long-term borrowings—owed to securitization investors | $ | 3,325 | | | $ | 4,491 | | | $ | — | | | $ | — | | | $ | 7,816 | |
______________________
(1)Excludes any subordinated classes of SYNCT notes and SYNIT notes that we owned at December 31, 2020.
We retain exposure to the performance of trust assets through: (i) in the case of SYNCT, SFT and SYNIT, subordinated retained interests in the loan receivables transferred to the trust in excess of the principal amount of the notes for a given series that provide credit enhancement for a particular series, as well as a pari passu seller’s interest in each trust and (ii) in the case of SYNCT and SYNIT, any subordinated classes of notes that we own.
All of our securitized financings include early repayment triggers, referred to as early amortization events, including events related to material breaches of representations, warranties or covenants, inability or failure of the Bank to transfer loan receivables to the trusts as required under the securitization documents, failure to make required payments or deposits pursuant to the securitization documents, and certain insolvency-related events with respect to the related securitization depositor, Synchrony (solely with respect to SYNCT) or the Bank. In addition, an early amortization event will occur with respect to a series if the excess spread as it relates to a particular series or for the trust, as applicable, falls below zero. Following an early amortization event, principal collections on the loan receivables in the applicable trust are applied to repay principal of the trust's asset-backed securities rather than being available on a revolving basis to fund the origination activities of our business. The occurrence of an early amortization event also would limit or terminate our ability to issue future series out of the trust in which the early amortization event occurred. No early amortization event has occurred with respect to any of the securitized financings in SYNCT, SFT or SYNIT.
The following table summarizes for each of our trusts the three-month rolling average excess spread at December 31, 2020.
| | | | | | | | | | | | | | | | | |
| Note Principal Balance
($ in millions) | | # of Series
Outstanding | | Three-Month Rolling Average Excess Spread(1) |
| SYNCT | $ | 5,144 | | | 9 | | | ~18.6% to 20.9% |
| SFT | $ | 300 | | | 7 | | | 16.8 | % |
| SYNIT | $ | 2,600 | | | 1 | | | 18.1 | % |
______________________
(1)Represents the excess spread (generally calculated as interest income collected from the applicable pool of loan receivables less applicable net charge-offs, interest expense and servicing costs, divided by the aggregate principal amount of loan receivables in the applicable pool) for SFT or, in the case of SYNCT and SYNIT, a range of the excess spreads relating to the particular series issued within each trust, in all cases omitting any series that have not been outstanding for at least three full monthly periods and calculated in accordance with the applicable trust or series documentation, for the three securitization monthly periods ended December 31, 2020.
Senior Unsecured Notes
During the year ended December 31, 2020 we made repayments of $1.5 billion, which included all of our previously outstanding floating rate senior unsecured notes.
The following table provides a summary of our outstanding senior unsecured notes at December 31, 2020.
| | | | | | | | | | | | | | | | | | | | |
| Issuance Date | | Interest Rate(1) | | Maturity | | Principal Amount Outstanding(2) |
| ($ in millions) | | | | | | |
| Fixed rate senior unsecured notes: | | | | | | |
| Synchrony Financial | | | | | | |
| August 2014 | | 3.750% | | August 2021 | | $ | 750 | |
| August 2014 | | 4.250% | | August 2024 | | 1,250 | |
| July 2015 | | 4.500% | | July 2025 | | 1,000 | |
| August 2016 | | 3.700% | | August 2026 | | 500 | |
| December 2017 | | 3.950% | | December 2027 | | 1,000 | |
| March 2019 | | 4.375% | | March 2024 | | 600 | |
| March 2019 | | 5.150% | | March 2029 | | 650 | |
| July 2019 | | 2.850% | | July 2022 | | 750 | |
| Synchrony Bank | | | | | | |
| June 2017 | | 3.000% | | June 2022 | | 750 | |
| May 2018 | | 3.650% | | May 2021 | | 750 | |
| Total fixed rate senior unsecured notes | | | | | | $ | 8,000 | |
| | | | | | |
| | | | | | |
| | | | | | |
| | | | | | |
| | | | | | |
| | | | | | |
| | | | | | |
______________________
(1)Weighted average interest rate of all senior unsecured notes at December 31, 2020 was 3.94%
(2)The amounts shown exclude unamortized debt discounts, premiums and issuance costs.
Short-Term Borrowings
Except as described above, there were no material short-term borrowings for the periods presented.
Other
At December 31, 2020, we had more than $25.0 billion of unencumbered assets in the Bank available to be used to generate additional liquidity through secured borrowings or asset sales or to be pledged to the Federal Reserve Board for credit at the discount window.
Covenants
The indenture pursuant to which our senior unsecured notes have been issued includes various covenants, including covenants that restrict (subject to certain exceptions) Synchrony’s ability to dispose of, or incur liens on, any of the voting stock of the Bank or otherwise permit the Bank to be merged, consolidated, leased or sold in a manner that results in the Bank being less than 80% controlled by us.
If we do not satisfy any of these covenants discussed above, the maturity of amounts outstanding thereunder may be accelerated and become payable. We were in compliance with all of these covenants at December 31, 2020.
At December 31, 2020, we were not in default under any of our credit facilities.
Credit Ratings
Our borrowing costs and capacity in certain funding markets, including securitizations and senior and subordinated debt, may be affected by the credit ratings of the Company, the Bank and the ratings of our asset-backed securities.
The table below reflects our current credit ratings and outlooks:
| | | | | | | | | | | | | | |
| | S&P | | Fitch Ratings |
| Synchrony Financial | | | | |
| Senior unsecured debt | | BBB- | | BBB- |
| Preferred stock | | BB- | | B+ |
| Outlook for Synchrony Financial senior unsecured debt | | Negative | | Negative |
| Synchrony Bank | | | | |
| Senior unsecured debt | | BBB | | BBB- |
| Outlook for Synchrony Bank senior unsecured debt | | Negative | | Negative |
In addition, certain of the asset-backed securities issued by SYNCT and SYNIT are rated by Fitch, S&P and/or Moody’s. A credit rating is not a recommendation to buy, sell or hold securities, may be subject to revision or withdrawal at any time by the assigning rating organization, and each rating should be evaluated independently of any other rating. Downgrades in these credit ratings could materially increase the cost of our funding from, and restrict our access to, the capital markets.
Liquidity
____________________________________________________________________________________________
We seek to ensure that we have adequate liquidity to sustain business operations, fund asset growth, satisfy debt obligations and to meet regulatory expectations under normal and stress conditions.
We maintain policies outlining the overall framework and general principles for managing liquidity risk across our business, which is the responsibility of our Asset and Liability Management Committee, a subcommittee of the Risk Committee of our Board of Directors. We employ a variety of metrics to monitor and manage liquidity. We perform regular liquidity stress testing and contingency planning as part of our liquidity management process. We evaluate a range of stress scenarios including Company specific and systemic events that could impact funding sources and our ability to meet liquidity needs.
We maintain a liquidity portfolio, which at December 31, 2020 had $18.3 billion of liquid assets, primarily consisting of cash and equivalents and short-term obligations of the U.S. Treasury, less cash in transit which is not considered to be liquid, compared to $17.3 billion of liquid assets at December 31, 2019. The increase in liquid assets was primarily due to the reduction in our loan receivables and the retention of excess cash flows from operations. Additionally, on March 15, 2020, in response to the COVID-19 pandemic, the Federal Reserve Board reduced reserve requirements for insured depository institutions to zero percent, which further increased the Bank's available liquidity. We believe our liquidity position at December 31, 2020 remains strong as we continue to operate in a period of uncertain economic conditions related to COVID-19 and we will continue to closely monitor our liquidity as economic conditions change.
As additional sources of liquidity, at December 31, 2020, we had an aggregate of $4.9 billion of undrawn committed capacity on our securitized financings, subject to customary borrowing conditions, from private lenders under our securitization programs and $0.5 billion of undrawn committed capacity under our unsecured revolving credit facility with private lenders, and we had more than $25.0 billion of unencumbered assets in the Bank available to be used to generate additional liquidity through secured borrowings or asset sales or to be pledged to the Federal Reserve Board for credit at the discount window.
As a general matter, investments included in our liquidity portfolio are expected to be highly liquid, giving us the ability to readily convert them to cash. The level and composition of our liquidity portfolio may fluctuate based upon the level of expected maturities of our funding sources as well as operational requirements and market conditions.
We rely significantly on dividends and other distributions and payments from the Bank for liquidity; however, bank regulations, contractual restrictions and other factors limit the amount of dividends and other distributions and payments that the Bank may pay to us. For a discussion of regulatory restrictions on the Bank’s ability to pay dividends, see “Regulation—Risk Factors Relating to Regulation—We are subject to restrictions that limit our ability to pay dividends and repurchase our common stock; the Bank is subject to restrictions that limit its ability to pay dividends to us, which could limit our ability to pay dividends, repurchase our common stock or make payments on our indebtedness.” and “Regulation—Savings Association Regulation—Dividends and Stock Repurchases.”
Quantitative and Qualitative Disclosures About Market Risk
____________________________________________________________________________________________
Market risk refers to the risk that a change in the level of one or more market prices, rates, indices, correlations or other market factors will result in losses for a position or portfolio. We are exposed to market risk primarily from changes in interest rates. See “Risks—Risk Factors Relating to Our Business—Changes in market interest rates could have a material adverse effect on our net earnings, funding and liquidity” and “—A reduction in our credit ratings could materially increase the cost of our funding from, and restrict our access to, the capital markets.”
Interest Rate Risk
We borrow money from a variety of depositors and institutions in order to provide loans to our customers. Changes in market interest rates cause our net interest income to increase or decrease, as some of our assets and liabilities carry interest rates that fluctuate with market benchmarks. The interest rate benchmark for our floating rate assets is generally the prime rate, and the interest rate benchmark for our floating rate liabilities is generally either LIBOR or the federal funds rate. The prime rate and the LIBOR or federal funds rate could reset at different times or could diverge, leading to mismatches in the interest rates on our floating rate assets and floating rate liabilities.
Competitive factors and future regulatory reform may limit or restrict our ability to raise interest rates on our loans. In addition, some of our program agreements limit the rate of interest we can charge to customers. If interest rates were to rise materially over a sustained period of time, and we are unable to sufficiently raise our interest rates in a timely manner, our net interest income and margin could be adversely impacted, which could have a material adverse effect on our net earnings.
Interest rates may also adversely impact our customers’ spending levels and ability and willingness to pay outstanding amounts owed to us. Our floating rate products bear interest rates that fluctuate with the prime rate. Higher interest rates often lead to higher payment obligations by customers to us and other lenders under mortgage, credit card and other consumer loans, which may reduce our customers’ ability to remain current on their obligations to us and therefore lead to increased delinquencies, charge-offs and allowances for credit losses, which could have a material adverse effect on our net earnings.
Changes in interest rates and competitor responses to these changes may also impact customer decisions to maintain deposits with us, and reductions in deposits could materially adversely affect our funding costs and liquidity.
At December 31, 2020, 53.2% of our loan receivables were priced at a fixed interest rate to the customer, with the remaining 46.8% at a floating interest rate. We fund our assets with a combination of fixed rate and floating rate funding sources that include deposits, asset-backed securities and unsecured debt. To manage interest rate risk, we seek to match the interest rate repricing characteristics of our assets and liabilities. Historically, we have not used interest rate derivative contracts to manage interest rate risk; however, we may choose to do so in the future. To the extent we are unable to effectively match the interest rate sensitivity of our assets and liabilities, our net earnings could be materially adversely affected.
We assess our interest rate risk by estimating the effect of various interest rate scenarios on our net interest income.
For purposes of presenting the possible earnings effect of a hypothetical, adverse change in interest rates over the 12-month period from our reporting date, we assume that all interest rate sensitive assets and liabilities will be impacted by a hypothetical, immediate 100 basis point increase or decrease in interest rates as of the beginning of the period. The sensitivity is based upon the hypothetical assumption that all relevant types of interest rates that affect our results would increase or decrease instantaneously, simultaneously and to the same degree.
Our interest rate sensitive assets include our variable rate loan receivables and the assets that make up our liquidity portfolio. At December 31, 2020, 46.8% of our receivables were priced at a floating interest rate. Assets with rates that are fixed at period end but which will mature, or otherwise contractually reset to a market-based indexed rate or other fixed rate prior to the end of the 12-month period, are considered to be rate sensitive. The latter category includes certain loans that may be offered at below-market rates for an introductory period, such as balance transfers and special promotional programs, after which the loans will contractually reprice under standard terms in accordance with our normal market-based pricing structure. For purposes of measuring rate sensitivity for such loans, only the effect of the hypothetical 100 basis point change in the underlying market-based indexed rate or other fixed rate has been considered rather than the full change in the rate to which the loan would contractually reprice (i.e. assets are categorized as fixed or floating according to their underlying contractual terms). For assets that have a fixed interest rate at the period end but which contractually will, or are assumed to, reset to a market-based indexed rate or other fixed rate during the next 12 months, net interest income sensitivity is measured from the expected repricing date.
Interest rate sensitive liabilities are assumed to be those for which the stated interest rate is not contractually fixed for the next 12-month period. Thus, liabilities that vary with changes in a market-based index, such as the federal funds rate or LIBOR, which will reset before the end of the 12-month period, or liabilities whose rates are fixed at the period end but which will mature and are assumed to be replaced with a market-based indexed rate prior to the end of the 12-month period, also are considered to be rate sensitive. For these fixed rate liabilities, net interest income sensitivity is measured from the expected repricing date.
The following table presents the approximate net interest income impacts forecasted over the next twelve months from an immediate and parallel change in interest rates affecting all interest rate sensitive assets and liabilities at December 31, 2020.
| | | | | | | | |
| Basis Point Change | | At December 31, 2020 |
| ($ in millions) | | |
| -100 basis points | | $ | (98) | |
| +100 basis points | | $ | 61 | |
Limitations of Market Risk Measures
The interest rate risk models that we use in deriving these measures incorporate contractual information, internally-developed assumptions and proprietary modeling methodologies, which project borrower and deposit behavior patterns in certain interest rate environments. Other market inputs, such as interest rates, market prices and interest rate volatility, are also critical components of our interest rate risk measures. We regularly evaluate, update and enhance these assumptions, models and analytical tools as we believe appropriate to reflect our best assessment of the market environment and the expected behavior patterns of our existing assets and liabilities.
There are inherent limitations in any methodology used to estimate the exposure to changes in market interest rates. The sensitivity analysis provided above contemplates only certain movements in interest rates and is based on the existing balance sheet as well as assumptions around future growth, pricing and balance sheet composition. It does not attempt to estimate the effect of a more significant interest rate increase over a sustained period of time, which as described in “—Interest Rate Risk” above, could adversely affect our net interest income. In addition, the strategic actions that management may take to manage our balance sheet may differ from our projections, which could cause our actual net interest income to differ from the above sensitivity analysis.
Capital
____________________________________________________________________________________________
Our primary sources of capital have been earnings generated by our business and existing equity capital. We seek to manage capital to a level and composition sufficient to support the risks of our business, meet regulatory requirements, adhere to rating agency targets and support future business growth. The level, composition and utilization of capital are influenced by changes in the economic environment, strategic initiatives and legislative and regulatory developments. Within these constraints, we are focused on deploying capital in a manner that will provide attractive returns to our stockholders.
Synchrony is not currently required to conduct stress tests. See “Regulation—Regulation Relating to Our Business—Recent Legislative and Regulatory Developments.” In addition, while we have not been subject to the Federal Reserve Board's formal capital plan submission requirements to-date, we have submitted a capital plan to the Federal Reserve Board in 2020. While not required, our capital plan process does include certain internal stress testing.
Dividend and Share Repurchases
| | | | | | | | | | | | | | | | | | | | |
| Common Stock Cash Dividends Declared | | Month of Payment | | Amount per Common Share | | Amount |
| ($ in millions, except per share data) | | | | | | |
Three months ended March 31, 2020 | | February 2020 | | $ | 0.22 | | | $ | 135 | |
Three months ended June 30, 2020 | | May 2020 | | 0.22 | | | 128 | |
Three months ended September 30, 2020 | | August 2020 | | 0.22 | | | 129 | |
Three months ended December 31, 2020 | | November 2020 | | 0.22 | | | 128 | |
| Total dividends declared | | | | $ | 0.88 | | | $ | 520 | |
| | | | | | | | | | | | | | | | | | | | |
| Preferred Stock Cash Dividends Declared | | Month of Payment | | Amount per Preferred Share | | Amount |
| ($ in millions, except per share data) | | | | | | |
Three months ended March 31, 2020 | | February 2020 | | $ | 14.22 | | | $ | 11 | |
Three months ended June 30, 2020 | | May 2020 | | 14.06 | | | 11 | |
Three months ended September 30, 2020 | | August 2020 | | 14.06 | | | 10 | |
Three months ended December 31, 2020 | | November 2020 | | 14.06 | | | 10 | |
| Total dividends declared | | | | $ | 56.40 | | | $ | 42 | |
The declaration and payment of future dividends to holders of our common and preferred stock will be at the discretion of the Board and will depend on many factors. For a discussion of regulatory and other restrictions on our ability to pay dividends and repurchase stock, see “Regulation—Risk Factors Relating to Regulation—We are subject to restrictions that limit its ability to pay dividends and repurchase its common stock; the Bank is subject to restrictions that limit its ability to pay dividends to Synchrony, which could limit Synchrony's ability to pay dividends, repurchase its common stock or make payments on its indebtedness.”
| | | | | | | | | | | | | | |
| Common Shares Repurchased Under Publicly Announced Programs | | Total Number of Shares Purchased | | Dollar Value of Shares Purchased |
| ($ and shares in millions) | | | | |
Three months ended March 31, 2020 | | 33.6 | | | $ | 984 | |
Three months ended June 30, 2020 | | — | | | — | |
Three months ended September 30, 2020 | | — | | | — | |
Three months ended December 31, 2020 | | — | | | — | |
| Total | | 33.6 | | | $ | 984 | |
Our previously announced share repurchase program (the "2019 Share Repurchase Program") expired on June 30, 2020. Under this program we repurchased a total of $3.6 billion of common stock. In response to COVID-19, we temporarily suspended our share repurchase activities in 2020. In January 2021, we announced that the Board of Directors approved a new share repurchase program of up to $1.6 billion through December 31, 2021, beginning in the first quarter of 2021 subject to the Company's capital plan, market conditions and other factors, including regulatory restrictions and required approvals, if any.
Regulatory Capital Requirements - Synchrony Financial
As a savings and loan holding company, we are required to maintain minimum capital ratios, under the applicable U.S. Basel III capital rules. For more information, see “Regulation—Savings and Loan Holding Company Regulation.”
For Synchrony Financial to be a well-capitalized savings and loan holding company, Synchrony Bank must be well-capitalized and Synchrony Financial must not be subject to any written agreement, order, capital directive, or prompt corrective action directive issued by the Federal Reserve Board to meet and maintain a specific capital level for any capital measure. As of December 31, 2020 and 2019, Synchrony Financial met all the requirements to be deemed well-capitalized.
The following table sets forth the composition of our capital ratios for the Company calculated under the Basel III Standardized Approach rules at December 31, 2020 and 2019, respectively.
| | | | | | | | | | | | | | | | | | | | | | | |
| Basel III |
| At December 31, 2020 | | At December 31, 2019 |
| ($ in millions) | Amount | | Ratio(1) | | Amount | | Ratio(1) |
| Total risk-based capital | $ | 14,604 | | | 18.1 | % | | $ | 14,211 | | | 16.3 | % |
| Tier 1 risk-based capital | $ | 13,525 | | | 16.8 | % | | $ | 13,064 | | | 15.0 | % |
| Tier 1 leverage | $ | 13,525 | | | 14.0 | % | | $ | 13,064 | | | 12.6 | % |
| Common equity Tier 1 capital | $ | 12,791 | | | 15.9 | % | | $ | 12,330 | | | 14.1 | % |
| Risk-weighted assets | $ | 80,561 | | | | | $ | 87,302 | | | |
______________________
(1)Tier 1 leverage ratio represents total tier 1 capital as a percentage of total average assets, after certain adjustments. All other ratios presented above represent the applicable capital measure as a percentage of risk-weighted assets.
In response to the COVID-19 pandemic, in March 2020 the joint federal bank regulatory agencies issued an interim final rule that allows banking organizations to mitigate the effects of the CECL accounting standard in their regulatory capital. Banking organizations that adopt CECL in 2020 can elect to mitigate the estimated cumulative regulatory capital effects of CECL for two years. This two-year delay is in addition to the three-year transition period that the agencies had already made available. The Company has elected to adopt the option provided by the interim final rule, which will largely delay the effects of CECL on its regulatory capital for the next two years, after which the effects will be phased-in over a three-year period from January 1, 2022 through December 31, 2024. Under the interim final rule, the amount of adjustments to regulatory capital deferred until the phase-in period includes both the initial impact of our adoption of CECL at January 1, 2020 and 25% of subsequent changes in our allowance for credit losses during each quarter of the two-year period ended December 31, 2021, collectively the “CECL regulatory capital transition adjustment”.
Capital amounts and ratios at December 31, 2020 in the above table all reflect the application of the CECL regulatory capital transition adjustment. The increase in our common equity Tier 1 capital ratio compared to December 31, 2019 was primarily due to the decrease in loan receivables and a corresponding decrease in risk-weighted assets in the year ended December 31, 2020.
Regulatory Capital Requirements - Synchrony Bank
At December 31, 2020 and 2019, the Bank met all applicable requirements to be deemed well-capitalized pursuant to OCC regulations and for purposes of the Federal Deposit Insurance Act. The following table sets forth the composition of the Bank’s capital ratios calculated under the Basel III Standardized Approach rules at December 31, 2020 and December 31, 2019, and also reflects the CECL regulatory capital transition adjustment in the December 31, 2020 amounts and ratios.
| | | | | | | | | | | | | | | | | | | | | | | | | | | | | | | |
| | At December 31, 2020 | | At December 31, 2019 | | | | Minimum to be Well-
Capitalized under
Prompt Corrective Action Provisions |
| ($ in millions) | Amount | | Ratio | | Amount | | Ratio | | | | Ratio |
| Total risk-based capital | $ | 12,784 | | | 17.8 | % | | $ | 11,911 | | | 15.6 | % | | | | 10.0 | % |
| Tier 1 risk-based capital | $ | 11,821 | | | 16.5 | % | | $ | 10,907 | | | 14.3 | % | | | | 8.0 | % |
| Tier 1 leverage | $ | 11,821 | | | 13.6 | % | | $ | 10,907 | | | 11.9 | % | | | | 5.0 | % |
| Common equity Tier 1 capital | $ | 11,821 | | | 16.5 | % | | $ | 10,907 | | | 14.3 | % | | | | 6.5 | % |
Failure to meet minimum capital requirements can result in the initiation of certain mandatory and possibly additional discretionary actions by regulators that, if undertaken, could limit our business activities and have a material adverse effect on our business, results of operations and financial condition. See “Regulation—Risk Factors Relating to Regulation—Failure by Synchrony and the Bank to meet applicable capital adequacy and liquidity requirements could have a material adverse effect on us.”
Off-Balance Sheet Arrangements and Unfunded Lending Commitments
____________________________________________________________________________________________
We do not have any material off-balance sheet arrangements, including guarantees of third-party obligations. Guarantees are contracts or indemnification agreements that contingently require us to make a guaranteed payment or perform an obligation to a third-party based on certain trigger events. At December 31, 2020, we had not recorded any contingent liabilities in our Consolidated Statements of Financial Position related to any guarantees. See Note 9 - Fair Value Measurements to our consolidated financial statements for information on contingent consideration liabilities related to business acquisitions.
We extend credit, primarily arising from agreements with customers for unused lines of credit on our credit cards, in the ordinary course of business. Each unused credit card line is unconditionally cancellable by us. See Note 4. Loan Receivables and Allowance for Credit Losses to our consolidated financial statements for more information on our unfunded lending commitments.
Critical Accounting Estimates
____________________________________________________________________________________________
In preparing our consolidated financial statements, we have identified certain accounting estimates and assumptions that we consider to be the most critical to an understanding of our financial statements because they involve significant judgments and uncertainties. The critical accounting estimates we have identified relate to allowance for credit losses and fair value measurements. These estimates reflect our best judgment about current, and for some estimates future, economic and market conditions and their effects based on information available as of the date of these financial statements. If these conditions change from those expected, it is reasonably possible that these judgments and estimates could change, which may result in incremental losses on loan receivables, or material changes to our Consolidated Statement of Financial Position, among other effects. See Note 2. Basis of Presentation and Summary of Significant Accounting Policies to our consolidated financial statements, which discusses the significant accounting policies related to these estimates.
Allowance for Credit Losses
Effective January 1, 2020, losses on loan receivables are estimated and recognized upon origination of the loan, based on expected credit losses for the life of the loan balance as of the period end date. This requires us to estimate expected losses in the portfolio as of each balance sheet date. The method for calculating the estimate of expected credit loss takes into account historical experience, and current conditions and future expectations for pools of loans with similar risk characteristics, and reasonable and supportable forecasts about the future. The model utilizes a macroeconomic forecast, with unemployment claims as the primary macroeconomic variable. We also perform a qualitative assessment in addition to model estimates and apply qualitative adjustments as necessary. The reasonable and supportable forecast period is determined primarily based upon an assessment of the current economic outlook, including the effects of COVID-19, and our ability to use available data to accurately forecast losses over time. The reasonable and supportable forecast period used in our estimate of credit losses at December 31, 2020 was 12 months, consistent with the forecast period utilized since adoption of CECL. The Company reassesses the reasonable and supportable forecast period on a quarterly basis. Beyond the reasonable and supportable forecast period, we revert to historical loss information at the loan receivables segment level over a 6-month period, gradually increasing the weight of historical losses by an equal amount each month during the reversion period, and utilize historical loss information thereafter for the remaining life of the portfolio. The reversion period, similar to the reasonable and supportable forecast period, may change in the future depending on multiple factors such as forecasting methods, portfolio changes, and macroeconomic environment.
We evaluate each portfolio quarterly. For credit card receivables, our estimation process includes analysis of historical data, and there is a significant amount of judgment applied in selecting inputs and analyzing the results produced by the models to determine the allowance. Our risk process includes standards and policies for reviewing major risk exposures and concentrations, and evaluates relevant data either for individual loans or on a portfolio basis, as appropriate. More specifically, we use an enhanced migration analysis to estimate the likelihood that a loan will progress through the various stages of delinquency. The enhanced migration analysis considers uncollectible principal, interest and fees reflected in the loan receivables, segmented by credit and business parameters. We use other analyses to estimate expected losses on non-delinquent accounts, which include past performance, bankruptcy activity such as filings, policy changes, loan volumes and amounts. Holistically, for assessing the portfolio credit loss content, we also evaluate portfolio risk management techniques applied to various accounts, historical behavior of different account vintages, account seasoning, economic conditions, recent trends in delinquencies, account collection management, forecasting uncertainties, expectations about the future, and a qualitative assessment of the adequacy of the allowance for credit losses.
We estimate our allowance for credit losses using pools of loans with similar risk characteristics. Further, experience is not available for new portfolios; therefore, while we accumulate experience, we utilize our experience with the most closely analogous products and segments in our portfolio. The underlying assumptions, estimates and assessments we use to provide for losses are updated periodically to reflect our view of current and forecasted conditions and are subject to the regulatory examination process, which can result in changes to our assumptions. Changes in such estimates can significantly affect the allowance and provision for credit losses. It is possible that we will experience credit losses that are different from our current estimates.
Fair Value Measurements
Assets and liabilities measured at fair value every reporting period include investments in debt and equity securities as well as contingent consideration obligations. Assets that are not measured at fair value every reporting period, but that are subject to fair value measurements in certain circumstances, primarily include acquired loans, loans that have been reduced to fair value when they are held for sale, loans that have been reduced based on the fair value of the underlying collateral, cost method and equity method investments that are written down to fair value when they are impaired.
Assets that are written down to fair value when impaired are not subsequently adjusted to fair value unless further impairment occurs. A fair value measurement is determined as the price that we would receive to sell an asset or pay to transfer a liability in an orderly transaction between market participants at the measurement date. In the absence of active markets for the identical assets or liabilities, such measurements involve developing assumptions based on market observable data and, in the absence of such data, internal information that is consistent with what market participants would use in a hypothetical transaction that occurs at the measurement date. The determination of fair value often involves significant judgments about assumptions such as determining an appropriate discount rate that factors in both risk and liquidity premiums, identifying the similarities and differences in market transactions, weighting those differences accordingly and then making the appropriate adjustments to those market transactions to reflect the risks specific to our asset being valued.
New Accounting Standards
____________________________________________________________________________________________
See Note 2. Basis of Presentation and Summary of Significant Accounting Policies — New Accounting Standards, to our consolidated financial statements for additional information related to recent accounting pronouncements, including ASU 2016-13, Financial Instruments-Credit Losses: Measurement of Credit Losses on Financial Instruments, which was effective and adopted by the Company on January 1, 2020.
RISKS
Risk Factors Summary
____________________________________________________________________________________________
We are providing the following summary of the risk factors contained in this Annual Report on Form 10-K to enhance the readability and accessibility of our risk factor disclosures. We encourage you to carefully review the full risk factors contained in this Annual Report on Form 10-K in their entirety for additional information regarding the material factors that make an investment in our securities speculative or risky. These risks and uncertainties include, but are not limited to, the following:
Macroeconomic and Operational Risks
•COVID-19 and other macroeconomic conditions could have a material adverse effect on our business, results of operations and financial condition and heighten many of our known risks.
•Our results of operations and growth depend on our ability to retain existing partners and attract new partners.
•A significant percentage of our interest and fees on loans comes from relationships with a small number of Retail Card partners, and the loss of any of these Retail Card partners could adversely affect our business and results of operations.
•Our business is heavily concentrated in U.S. consumer credit, and therefore our results are more susceptible to fluctuations in that market than a more diversified company.
•Our results are impacted, to a significant extent, on the active and effective promotion and support of our products by our partners and on the financial performance of our partners.
•Competition in the consumer finance industry is intense.
•We may be unable to successfully develop and commercialize new or enhanced products and services.
•Fraudulent activity associated with our products and services could negatively impact our operating results, brand and reputation and cause the use of our products and services to decrease and our fraud losses to increase.
•The failure of third parties to provide various services that are important to our operations could have a material adverse effect on our business and results of operations.
Technological Risks
•Cyber-attacks or other security breaches could have a material adverse effect on our business.
•Disruptions in the operation of our and our outsourced partners' computer systems and data centers could have a material adverse effect on our business.
Financial Risks
•Our allowance for credit losses may prove to be insufficient to cover losses on our loans.
•If assumptions or estimates we use in preparing our financial statements, including those related to the CECL accounting guidance, are incorrect or are required to change, our reported results of operations and financial condition may be adversely affected.
•Adverse financial market conditions or our inability to effectively manage our funding and liquidity risk could have a material adverse effect on our funding, liquidity and ability to meet our obligations.
•Our inability to grow our deposits in the future could materially adversely affect our liquidity and ability to grow our business.
•A reduction in our credit ratings could materially increase the cost of our funding from, and restrict our access to, the capital markets.
•Various risks related to the securitization of our loan receivables that could have a material adverse effect on our business, liquidity, cost of funds and financial condition.
•We rely extensively on models in managing many aspects of our business, and if they are not accurate or are misinterpreted, it could have a material adverse effect on our business and results of operations.
•Our business depends on our ability to successfully manage our credit risk, and failing to do so may result in high charge-off rates.
•We may not be able to offset increases in our costs with decreased payments under our retailer share arrangements, which could reduce our profitability.
•Reductions in interchange fees may reduce the competitive advantages our private label credit card products currently have by virtue of not charging interchange fees and would reduce our income from those fees.
Legal Risks
•We have international operations that subject us to various international risks as well as increased compliance and regulatory risks and costs.
•Litigation, regulatory actions and compliance issues could subject us to significant fines, penalties, judgments, remediation costs and/or requirements resulting in increased expenses.
Regulatory Risks
•We face various risks related to the government regulation, supervision, examination and enforcement our business faces.
•Legislative and regulatory developments may have a significant impact on our business, financial condition and results of operations.
•Federal or state tax rules and regulations could change and adversely affect our results of operations.
•Failure by us to meet applicable capital adequacy and liquidity requirements could limit our ability to pay dividends and repurchase our common stock or otherwise have a material adverse effect on us.
•Regulations relating to privacy, information security and data protection could increase our costs, affect or limit how we collect and use personal information and adversely affect our business opportunities.
Risk Factors Relating to Our Business
____________________________________________________________________________________________
The following discussion of risk factors contains “forward-looking statements,” as discussed in “Cautionary Note Regarding Forward-Looking Statements.” These risk factors may be important to understanding any statement in this Annual Report on Form 10-K or elsewhere. The following information should be read in conjunction with “Management’s Discussion and Analysis of Financial Condition and Results of Operations” (MD&A), the consolidated financial statements and related notes in “Consolidated Financial Statements and Supplementary Data” and “Regulation—Risk Factors Relating to Regulation” of this Form 10-K Report.
Our business routinely encounters and address risks, some of which will cause our future results to be different - sometimes materially different - than we anticipate. Discussion about important operational risks that our business encounters can be found in the business descriptions in “Our Business” and the MD&A section of this Form 10-K Report. The key categories of risks our business faces are macro-economic, operational, technological (including cyber-security), financial, legal and regulatory. Our reactions to material future developments as well as our competitors’ reactions to those developments will affect our future results.
Macroeconomic and Operational Risks
Macroeconomic conditions could have a material adverse effect on our business, results of operations and financial condition.
Key macroeconomic conditions historically have affected our business, results of operations and financial condition and are likely to affect them in the future. Consumer confidence, unemployment and other economic indicators are among the factors that often impact consumer spending behavior and demand for credit. Poor economic conditions reduce the usage of our credit cards and other financing products and the average purchase amount of transactions on our credit cards and through our other products, which, in each case, reduces our interest and fee income. We rely primarily on interest and fees on our loan receivables to generate our net earnings. Our interest and fees on our loan receivables was $16.0 billion for the year ended December 31, 2020. Poor economic conditions also adversely affect the ability and willingness of customers to pay amounts owed to us, increasing delinquencies, bankruptcies, charge-offs and allowances for credit losses, and decreasing recoveries. For example, our over-30 day delinquency rate as a percentage of period-end loan receivables was 8.25% at December 31, 2009 during the financial crisis, compared to 3.07% at December 31, 2020, and our full-year net charge-off rate was 11.26% for the year ended December 31, 2009, compared to 4.58% for the year ended December 31, 2020. The assessment of our credit profile includes the evaluation of portfolio mix, account maturation, as well as broader consumer trends, such as payment behavior and overall indebtedness.
Economic growth in the United States can slow due to higher unemployment rates, lower housing values, concerns about the level of U.S. government debt and fiscal actions that may be taken to address this, as well as economic and political conditions in the U.S. and global markets. A prolonged period of slow economic growth or a significant deterioration in economic conditions or broader consumer trends, including wage growth, savings rates and consumer indebtedness, would likely affect consumer spending levels and the ability and willingness of customers to pay amounts owed to us, and could have a material adverse effect on our business, key credit trends, results of operations and financial condition.
Macroeconomic conditions may also cause net earnings to fluctuate and diverge from expectations of securities analysts and investors, who may have differing assumptions regarding the impact of these conditions on our business, and this may adversely impact our stock price.
The extent to which COVID-19 and measures taken in response thereto impact our business, results of operations and financial condition will depend on future developments, which are highly uncertain and are difficult to predict. COVID-19 has and is likely to have a material adverse impact on our results of operations and financial condition and heighten many of our known risks.
The outbreak of the global pandemic of COVID-19 and economic effects of preventative measures taken across the United States and worldwide have weighed on the macroeconomic environment, negatively impacting consumer confidence, unemployment and other economic indicators that contribute to consumer spending and payment behavior and demand for credit. Such economic conditions reduce the usage of our credit cards and other financing products and the average purchase amount of transactions on our credit cards and through our other products, which, in each case, reduces our interest and fee income. For more information on the risks related to the extent to which key macroeconomic conditions could have a material adverse effect on our business, results of operations and financial condition, see “—Macroeconomic conditions could have a material adverse effect on our business, results of operations and financial condition.”
The extent of the impact of COVID-19 on our business, results of operations and financial condition will depend on future developments, which are highly uncertain and are difficult to predict, including, but not limited to, the duration and spread of the outbreak, its severity, the actions to contain the virus or treat its impact, and how quickly and to what extent normal economic and operating conditions can resume. While the magnitude of the impact from COVID-19 is uncertain, we could see:
•a continued decline and/or volatility in purchase volume, which ultimately impacts the growth of our loan receivables;
•a decline in our interest income and/or our net interest margin, due to reductions in benchmark interest rates; and
•increases in our delinquencies and net charge-off rate and our allowance for credit losses, given the levels of filings for unemployment benefits in the U.S.
For more information, see “Management's Discussion and Analysis-Results of Operations-Business Trends and Conditions.”
In addition, the spread of COVID-19 has caused us to modify our business practices (including restricting employee travel and transitioning nearly all of our employees to working from home), and we may take further actions as may be required by government authorities or as we determine are in the best interests of our employees, partners and customers. The outbreak has adversely impacted and may further adversely impact our workforce and operations and the operations of our partners, customers, suppliers and third-party vendors, throughout the time period during which the spread of COVID-19 continues and related restrictions remain in place, and even after the COVID-19 outbreak has subsided. In particular, we may experience financial losses due to a number of operational factors, including:
•continued store closures by partners or if one or more partners becomes subject to a bankruptcy proceeding;
•third-party disruptions, including potential outages at third-party operated call centers and other suppliers;
•increased cyber and payment fraud risk related to COVID-19, as cybercriminals attempt to profit from the disruption, given increased online banking, e-commerce and other online activity;
•challenges to the availability and reliability of our network due to changes to normal operations, including the possibility of one or more clusters of COVID-19 cases affecting our employees or affecting the systems or employees of our partners; and
•an increased volume of unanticipated customer and regulatory requests for information and support, or additional regulatory requirements, which could require additional resources and costs to address, including, for example, government initiatives to reduce or eliminate payments costs.
Even after the COVID-19 outbreak has subsided, our business may continue to experience materially adverse impacts as a result of the virus’s economic impact, social and behavioral impact, including the availability and cost of funding and any recession that has occurred or may occur in the future. There are no comparable recent events that provide guidance as to the effect COVID-19 as a global pandemic may have, and, as a result, the ultimate impact of the outbreak is highly uncertain and subject to change.
We do not yet know the full extent of the impacts on our business, our operations or the economy as a whole. However, the effects have, and are likely to continue to have, a material impact on our results of operations and heighten many of our known risks described herein.
Our results of operations and growth depend on our ability to retain existing partners and attract new partners.
Substantially all of our revenue is generated from the credit products we provide to customers of our partners pursuant to program agreements we enter into with our partners. As a result, our results of operations and growth depend on our ability to retain existing partners and attract new partners. Historically, there has been turnover in our partners, and we expect this will continue in the future. For example, in 2018, we announced that we would not be renewing our Retail Card program agreement with Walmart.
Program agreements with our Retail Card partners and national and regional retailer and manufacturer Payment Solutions partners typically are for multi-year terms. These program agreements generally permit our partner to terminate the agreement prior to its scheduled termination date for various reasons, including, in some cases, if we fail to meet certain service levels or change certain key cardholder terms or our credit criteria, we fail to achieve certain targets with respect to approvals of new customers as a result of the credit criteria we use, we elect not to increase the program size when the outstanding loan receivables under the program reach certain thresholds or we are not adequately capitalized, or certain force majeure events or changes in our ownership occur or a material adverse change in our financial condition occurs. A few Payment Solutions programs with national and regional retailer and manufacturer partners also may be terminated at will by the partner on specified notice to us (e.g., several months). In addition, programs with manufacturers, buying groups and industry associations generally are made available to Payment Solutions partners such as individual retail outlets, dealers and merchants under dealer agreements, which typically may be terminated at will by the partner on short notice to us (e.g., 15 days).
There is significant competition for our existing partners, and our failure to retain our existing larger partner relationships upon the expiration or our earlier loss of a relationship upon the exercise of a partner’s early termination rights, or the expiration or termination of a substantial number of smaller partner relationships, could have a material adverse effect on our results of operations (including growth rates) and financial condition to the extent we do not acquire new partners of similar size and profitability or otherwise grow our business. In addition, existing relationships may be renewed with less favorable terms to the Company in response to increased competition for such relationships. The competition for new partners is also significant, and our failure to attract new partners could adversely affect our ability to grow.
A significant percentage of our interest and fees on loans comes from relationships with a small number of Retail Card partners, and the loss of any of these Retail Card partners could adversely affect our business and results of operations.
Based upon interest and fees on loans for the year ended December 31, 2020, our five largest programs were: Gap, JCPenney, Lowe’s, PayPal and Sam’s Club. These programs accounted in aggregate for 51% of our total interest and fees on loans for the year ended December 31, 2020, and 47% of loan receivables at December 31, 2020. Our programs with Lowe's and PayPal, which includes our Venmo program, each accounted for more than 10% of our total interest and fees on loans for the year ended December 31, 2020. See "Our Business—Our Sales Platforms—Retail Card Partners."
The program agreements generally permit us or our partner to terminate the agreement prior to its scheduled termination date under various circumstances as described in the preceding risk factor. Some of our program agreements also provide that, upon expiration or termination, our partner may purchase or designate a third party to purchase the accounts and loans generated with respect to its program and all related customer data. The loss of any of our largest partners or a material reduction in the interest and fees we receive from their customers could have a material adverse effect on our results of operations and financial condition.
Our business is heavily concentrated in U.S. consumer credit, and therefore our results are more susceptible to fluctuations in that market than a more diversified company.
Our business is heavily concentrated in U.S. consumer credit. As a result, we are more susceptible to fluctuations and risks particular to U.S. consumer credit than a more diversified company. For example, our business is particularly sensitive to macroeconomic conditions that affect the U.S. economy, consumer spending and consumer credit. We are also more susceptible to the risks of increased regulations and legal and other regulatory actions that are targeted at consumer credit or the specific consumer credit products that we offer (including promotional financing). Due to our CareCredit platform, we are also more susceptible to increased regulations and legal and other regulatory actions targeted at healthcare related procedures or services, in contrast to other industries. Our business concentration could have an adverse effect on our results of operations.
Our results depend, to a significant extent, on the active and effective promotion and support of our products by our partners.
Our partners generally accept most major credit cards and various other forms of payment, and therefore our success depends on their active and effective promotion of our products to their customers. We depend on our partners to integrate the use of our credit products into their store culture by training their sales associates about our products, having their sales associates encourage their customers to apply for, and use, our products and otherwise effectively marketing our products. In addition, although our Retail Card programs and our Payment Solutions programs with national and regional retailer partners typically are exclusive with respect to the credit products we offer at that partner, some Payment Solutions programs and most CareCredit provider relationships are not exclusive to us, and therefore a partner may choose to promote a competitor’s financing over ours, depending upon cost, availability or attractiveness to consumers or other factors. Typically, we do not have, or utilize, any recourse against these non-exclusive partners when they do not sufficiently promote our products. Partners may also implement or fail to implement changes in their systems and technologies that may disrupt the integration between their systems and technologies and ours, which could disrupt the use of our products. The failure by our partners to effectively promote and support our products as well as changes they may make in their business models that negatively impact card usage could have a material adverse effect on our business and results of operations. In addition, if our partners engage in improper business practices, do not adhere to the terms of our program agreements or other contractual arrangements or standards, or otherwise diminish the value of our brand, we may suffer reputational damage and customers may be less likely to use our products, which could have a material adverse effect on our business and results of operations.
Our results are impacted, to a significant extent, by the financial performance of our partners.
Our ability to generate new loans and the interest and fees and other income associated with them is dependent upon sales of merchandise and services by our partners. The retail and healthcare industries in which our partners operate are intensely competitive. Our partners compete with retailers and department stores in their own geographic areas, as well as catalog and online sales businesses. Our partners in the healthcare industry compete with other healthcare providers. Our partners’ sales may decrease or may not increase as we anticipate for various reasons, some of which are in the partners’ control and some of which are not. For example, partner sales may be adversely affected by macroeconomic conditions having a national, regional or more local effect on consumer spending, business conditions affecting the general retail environment or a particular partner or industry, or catastrophes affecting broad or more discrete geographic areas. If our partners’ sales decline for any reason, it generally results in lower credit sales, and therefore lower loan volume and associated interest and fees and other income for us from their customers. In addition, if a partner closes some or all of its stores or becomes subject to a voluntary or involuntary bankruptcy proceeding (or if there is a perception that it may become subject to a bankruptcy proceeding), its customers who have used our financing products may have less incentive to pay their outstanding balances to us, which could result in higher charge-off rates than anticipated and our costs for servicing its customers’ accounts may increase. This risk is particularly acute with respect to our largest partners that account for a significant amount of our interest and fees on loans. See “—A significant percentage of our interest and fees on loans comes from relationships with a small number of Retail Card partners, and the loss of any of these Retail Card partners could adversely affect our business and results of operations.” Moreover, if the financial condition of a partner deteriorates significantly or a partner becomes subject to a bankruptcy proceeding, we may not be able to recover for customer returns, customer payments made in partner stores or other amounts due to us from the partner. A decrease in sales by our partners for any reason or a bankruptcy proceeding involving any of them could have a material adverse impact on our business and results of operations.
Competition in the consumer finance industry is intense.
The success of our business depends on our ability to retain existing partners and attract new partners. The competition for partners is intense and highly competitive. Our primary competitors for partners include major financial institutions, such as Alliance Data Systems, American Express, Capital One, JPMorgan Chase, Citibank, TD Bank and Wells Fargo, and to a lesser extent, financial technology companies and potential partners’ own in-house financing capabilities. Some of our competitors are substantially larger, have substantially greater resources and may offer a broader range of products and services. We compete for partners on the basis of a number of factors, including program financial and other terms, underwriting standards, marketing expertise, service levels, product and service offerings (including incentive and loyalty programs), technological capabilities and integration, brand and reputation. In addition, some of our competitors for partners have a business model that allows for their partners to manage underwriting (e.g., new account approval), customer service and collections, and other core banking responsibilities that we retain but some partners may prefer to handle. As a result of competition, we may be unable to acquire new partners, lose existing relationships to competing companies or find it more costly to maintain our existing relationships.
Our success also depends on our ability to attract and retain customers and generate usage of our products by them. The consumer credit and payments industry is highly competitive and we face an increasingly dynamic industry as emerging technologies enter the marketplace. As a form of payment, our products compete with cash, checks, debit cards, general purpose credit cards (including Visa and MasterCard, American Express and Discover Card), various forms of consumer installment loans, other private label card brands and, to a certain extent, prepaid cards. In the future, we expect our products may face increased competitive pressure to the extent that our products are not, or do not continue to be, accepted in, or compatible with digital wallet technologies such as Apple Pay, Samsung Pay, Android Pay and other similar technologies.
We may also face increased competition from current competitors or others who introduce or embrace disruptive technology that significantly changes the consumer credit and payment industry. We compete for customers and their usage of our products, and to minimize transfers to competitors of our customers’ outstanding balances, based on a number of factors, including pricing (interest rates and fees), product offerings, credit limits, incentives (including loyalty programs) and customer service. Although we offer a variety of consumer credit products, some of our competitors provide a broader selection of services, including home and automobile loans, debit cards and bank branch ATM access, which may position them better among customers who prefer to use a single financial institution to meet all of their financial needs. Some of our competitors are substantially larger than we are, which may give those competitors advantages, including a more diversified product and customer base, the ability to reach out to more customers and potential customers, operational efficiencies, more versatile technology platforms, broad-based local distribution capabilities and lower-cost funding. In addition, some of our competitors, including new and emerging competitors in the digital and mobile payments space, are not subject to the same regulatory requirements or legislative scrutiny to which we are subject. Non-bank providers of pay-over-time solutions, such as Affirm, Afterpay and others, extend consumer credit-like offerings but do not face the same restrictions, such as capital requirements and other regulatory requirements, as banks which also could place us at a competitive disadvantage. Customer attrition from any or all of our credit products or any lowering of the pricing of our products by reducing interest rates or fees in order to retain customers could reduce our revenues and therefore our earnings.
In our retail deposits business, we have acquisition and servicing capabilities similar to other direct banking competitors. We compete for deposits with traditional banks and, in seeking to grow our direct banking business, we compete with other banks that have direct banking models similar to ours, such as Ally Financial, American Express, Barclays, Capital One 360 (ING), CIT, Citi, Citizens Bank, Discover, Marcus by Goldman Sachs and PurePoint. Competition among direct banks is intense because online banking provides customers the ability to rapidly deposit and withdraw funds and open and close accounts in favor of products and services offered by competitors.
If we are unable to compete effectively for partners, customer usage or deposits, our business and results of operations could be materially adversely affected.
We may be unable to successfully develop and commercialize new or enhanced products and services.
Our industry is subject to rapid and significant changes in technologies, products, services and consumer preferences. A key part of our financial success depends on our ability to develop and commercialize new products and services or enhancements to existing products and services, including with respect to loyalty programs, mobile and point-of-sale technologies, and new Synchrony-branded bank deposit and credit products. Realizing the benefits of those products and services is uncertain. We may not assign the appropriate level of resources, priority or expertise to the development and commercialization of these new products, services or enhancements. Our ability to develop, acquire or commercialize competitive technologies, products or services on acceptable terms or at all may be limited by intellectual property rights that third parties, including competitors and potential competitors, may assert. In addition, success is dependent on factors such as partner and customer acceptance, adoption and usage, competition, the effectiveness of marketing programs, the availability of appropriate technologies and business processes and regulatory approvals. Success of a new product, service or enhancement also may depend upon our ability to deliver it on a large scale, which may require a significant investment.
We also may select, utilize and invest in technologies, products and services that ultimately do not achieve widespread adoption and therefore are not as attractive or useful to our partners, customers and service partners as we anticipate, or partners may not recognize the value of our new products and services or believe they justify any potential costs or disruptions associated with implementing them. In addition, because our products and services typically are marketed through our partners, if our partners are unwilling or unable to effectively implement our new technologies, products, services or enhancements, we may be unable to grow our business. Competitors may also develop or adopt technologies or introduce innovations that change the markets we operate in and make our products less competitive and attractive to our partners and customers.
In any event, we may not realize the benefit of new technologies, products, services or enhancements for many years or competitors may introduce more compelling products, services or enhancements. Our failure to successfully develop and commercialize new or enhanced products, services or enhancements could have a material adverse effect on our business and results of operations.
We may not realize the value of acquisitions and strategic investments that we pursue and such investments could divert resources or introduce unforeseen risks to our business.
We will acquire new partners and may execute strategic acquisitions or partnerships or make other strategic investments in businesses, products, technologies or platforms to enhance or grow our business. These acquisitions and strategic investments may introduce new costs or liabilities which could impact our ability to grow or maintain acceptable performance.
We may be unable to integrate systems, personnel or technologies from our acquisitions and strategic investments. These acquisitions and strategic investments may also present unforeseen legal, regulatory or other challenges that we may not be able to manage effectively. The planning and integration of an acquisition, including of a new partner or credit card portfolio, partnership or investment, may shift employee time and other resources which could impair our ability to focus on our core business.
New partnerships, acquisitions and strategic investments may not perform as expected due to lack of acceptance by partners, customers or employees, higher than forecasted costs or losses, lengthy transition periods, synergies or savings not being realized and a variety of other factors. This may result in a delay or unrealized benefit, or in some cases, increased costs or other unforeseen risks to our business.
Fraudulent activity associated with our products and services could negatively impact our operating results, brand and reputation and cause the use of our products and services to decrease and our fraud losses to increase.
We are subject to the risk of fraudulent activity associated with partners, customers and third parties handling customer information. Our fraud-related operational losses were $334 million, $273 million and $239 million for the years ended December 31, 2020, 2019 and 2018, respectively. Our fraud-related losses have shifted away from counterfeit fraud losses with the implementation of the embedded security chip in Dual Cards and general purpose co-branded credit cards and towards application and transactional fraud. Our products are susceptible to application fraud, because among other things, we provide immediate access to the credit line at the time of approval. In addition, sales on the internet and through mobile channels are becoming a larger part of our business and fraudulent activity is higher as a percentage of sales in those channels than in stores. Dual Cards, general purpose, general purpose co-branded credit cards and private label credit cards are susceptible to different types of fraud, and, depending on our product channel mix, we may continue to experience variations in, or levels of, fraud-related expense that are different from or higher than that experienced by some of our competitors or the industry generally.
The risk of fraud continues to increase for the financial services industry in general, and credit card fraud, identity theft and related crimes are likely to continue to be prevalent, and perpetrators are growing more sophisticated. Our resources, technologies and fraud prevention tools may be insufficient to accurately detect and prevent fraud. High profile fraudulent activity also could negatively impact our brand and reputation, which could negatively impact the use of our cards and thereby have a material adverse effect on our results of operations. In addition, significant increases in fraudulent activity could lead to regulatory intervention (such as increased customer notification requirements), which could increase our costs and also negatively impact our operating results, brand and reputation and could lead us to take steps to reduce fraud risk, which could increase our costs.
The failure of third parties to provide various services that are important to our operations could have a material adverse effect on our business and results of operations.
Some services important to our business are outsourced to third-party vendors. For example, our credit card transaction processing, production and related services (including the printing and mailing of customer statements) are handled via a contractual arrangement with First Data, and the technology platform for our online retail deposits is managed by Fiserv (in 2019, Fiserv acquired First Data). First Data, Fiserv, and, in some cases, other third-party vendors, are the sole source or one of a limited number of sources of the services they provide for us. It would be difficult and disruptive for us to replace some of our third-party vendors, particularly First Data and Fiserv, in a timely manner if they were unwilling or unable to provide us with these services in the future (as a result of their financial or business conditions or otherwise), and our business and operations likely would be materially adversely affected. Our principal agreement with First Data expires in November 2026, unless it is terminated earlier or is extended pursuant to the terms thereof. Our principal agreement with Fiserv expires in July 2022, unless it is terminated earlier or is extended pursuant to the terms thereof. In addition, if a third-party provider fails to provide the services we require, fails to meet contractual requirements, such as compliance with applicable laws and regulations, or suffers a cyber-attack or other security breach, our business could suffer economic and reputational harm that could have a material adverse effect on our business and results of operations.
Technological Risks
Cyber-attacks or other security breaches could have a material adverse effect on our business.
In the normal course of business, we collect, process and retain sensitive and confidential information regarding our partners and our customers. We also have arrangements in place with our partners and other third parties through which we share and receive information about their customers who are or may become our customers. Although we devote significant resources and management focus to ensuring the integrity of our systems through information security and business continuity programs, our facilities and systems, and those of our partners and third-party service providers, are vulnerable to external or internal security breaches, acts of vandalism, computer viruses, misplaced or lost data, programming or human errors, or other similar events. We and our partners and third-party service providers have experienced all of these events in the past and expect to continue to experience them in the future. These events could interrupt our business or operations, result in significant legal and financial exposure, supervisory liability, damage to our reputation or a loss of confidence in the security of our systems, products and services. Although the impact to date from these events has not had a material adverse effect on us, we cannot be sure this will be the case in the future.
Information security risks for large financial institutions like us have increased recently in part because of new technologies, the use of the internet and telecommunications technologies (including mobile and other connected devices) to conduct financial and other business transactions and the increased sophistication and activities of organized crime, perpetrators of fraud, hackers, terrorists and others. In addition to cyber-attacks or other security breaches involving the theft of sensitive and confidential information, hackers recently have engaged in attacks against large financial institutions that are designed to disrupt key business services, such as consumer-facing web sites. Our business performance and marketing efforts may increase our profile and therefore our risk of being targeted for cyber-attacks and other security breaches, including attacks targeting our key business services, websites, executives, and partners. We are not able to anticipate or implement effective preventive measures against all security breaches of these types, especially because the techniques used change frequently and because attacks can originate from a wide variety of sources. We employ detection and response mechanisms designed to contain and mitigate security incidents, but early detection may be thwarted by sophisticated attacks and malware designed to avoid detection.
We also face risks related to cyber-attacks and other security breaches in connection with credit card and deposit transactions that typically involve the transmission of sensitive information regarding our customers through various third-parties, including our partners, retailers that are not our partners where our Dual Cards and general purpose co-branded credit cards are used, merchant acquiring banks, payment processors, card networks (e.g., Visa and MasterCard) and our processors (e.g., First Data and Fiserv). Some of these parties have in the past been the target of security breaches and cyber-attacks, and because the transactions involve third parties and environments such as the point of sale that we do not control or secure, future security breaches or cyber-attacks affecting any of these third parties could impact us through no fault of our own, and in some cases, we may have exposure and suffer losses for breaches or attacks relating to them. We also rely on numerous other third-party service providers to conduct other aspects of our business operations and face similar risks relating to them. While we regularly conduct security assessments of significant third-party service providers, we cannot be sure that their information security protocols are sufficient to withstand a cyber-attack or other security breach.
The access by unauthorized persons to, or the improper disclosure by us of, confidential information regarding our customers or our own proprietary information, software, methodologies and business secrets could interrupt our business or operations, result in significant legal and financial exposure, supervisory liability, damage to our reputation or a loss of confidence in the security of our systems, products and services, all of which could have a material adverse impact on our business, financial condition and results of operations. In addition, there have been a number of well-publicized attacks or breaches directed at others in our industry that have heightened concern by consumers generally about the security of using credit cards, which have caused some consumers, including our customers, to use our credit cards less in favor of alternative methods of payment and has led to increased regulatory focus on, and potentially new regulations relating to, these matters. Further cyber-attacks or other breaches in the future, whether affecting us or others, could intensify consumer concern and regulatory focus and result in reduced use of our cards or other products and increased costs arising from, among other things new regulatory requirements relating to data security, all of which could have a material adverse effect on our business.
Disruptions in the operation of our and our outsourced partners' computer systems and data centers could have a material adverse effect on our business.
Our ability to deliver products and services to our partners and our customers, service our loans and otherwise operate our business and comply with applicable laws depends on the efficient and uninterrupted operation of our computer systems and data centers, as well as those of our partners and third-party service providers. These computer systems and data centers may encounter service interruptions at any time due to system or software failure, natural disaster or other reasons. In addition, the implementation of technology changes and upgrades to maintain current and integrate new systems may also cause service interruptions, transaction processing errors and system conversion delays and may cause our failure to comply with applicable laws, all of which could have a material adverse effect on our business.
We expect that new technologies and business processes applicable to the consumer credit industry will continue to emerge, and these new technologies and business processes may be better than those we currently use. The pace of technology change is high and our industry is intensely competitive, and we cannot assure you that we will be able to sustain our investment in new technology as critical systems and applications become obsolete and better ones become available. A failure to maintain current technology and business processes could cause disruptions in our operations or cause our products and services to be less competitive, all of which could have a material adverse effect on our business, financial condition and results of operations.
Financial Risks
Our allowance for credit losses may prove to be insufficient to cover losses on our loans.
We maintain an allowance for credit losses (a reserve established through a provision for credit losses charged to expense) that we believe is appropriate to provide for expected credit losses for the life of our loan portfolio. In addition, for portfolios we may acquire when we enter into new partner program agreements we are required to establish at acquisition an allowance for expected credit losses for the life of the acquired loan portfolio. Any subsequent deterioration in the performance of the purchased portfolios after acquisition results in incremental credit loss reserves. Growth in our loan portfolio generally would also lead to an increase in the allowance for credit losses.
The process for establishing an allowance for credit losses is critical to our results of operations and financial condition, and requires complex models and judgments, including forecasts of economic conditions. Effective January 1, 2020, the Company adopted ASU 2016-13, Financial Instruments-Credit Losses: Measurement of Credit Losses on Financial Instruments, which required us to adopt a new impairment model, known as the CECL model. The CECL model requires, upon origination of a loan, the recognition of all expected credit losses over the life of the loan based on historical experience, current conditions and reasonable and supportable forecasts. Changes in economic conditions affecting borrowers, new information regarding our loans and other factors, both within and outside of our control, may require an increase in the allowance for credit losses. We may underestimate our expected losses and fail to maintain an allowance for credit losses sufficient to account for these losses. In cases where we modify a loan, if the modified loans do not perform as anticipated, we may be required to establish additional allowances on these loans.
We will continue to periodically review and update our current methodology, models and the underlying assumptions, estimates and assessments we use to establish our allowance for credit losses to reflect our view of current conditions and reasonable and supportable forecasts. Moreover, our regulators, as part of their supervisory function, periodically review our methodology, models and the underlying assumptions, estimates and assessments we use for calculating, and the adequacy of, our allowance for credit losses. Our regulators, based on their judgment, may conclude that we should modify our current methodology, models or the underlying assumptions, estimates and assessments, increase our allowance for credit losses and/or recognize further losses. We will implement further enhancements or changes to our methodology, models and the underlying assumptions, estimates and assessments, as needed.
We cannot assure you that our credit loss reserves will be sufficient to cover actual losses. Future increases in the allowance for credit losses or actual losses (as a result of any review, update, regulatory guidance or otherwise) will result in a decrease in net earnings and capital and could have a material adverse effect on our business, results of operations and financial condition.
If assumptions or estimates we use in preparing our financial statements, including those related to the CECL accounting guidance, are incorrect or are required to change, our reported results of operations and financial condition may be adversely affected.
We are required to make various assumptions and estimates in preparing our financial statements under GAAP, including for purposes of determining our allowance for credit losses, asset impairment, reserves related to litigation and other legal matters, valuation of income and other taxes and regulatory exposures and the amounts recorded for certain contractual payments to be paid to or received from partners and others under contractual arrangements. Our most critical estimate used in preparing our financial statements is the determination of our allowance for credit losses, which was $10.3 billion at December 31, 2020. Upon origination of a loan, the estimate of expected credit losses, and any subsequent changes to such estimate, are recorded through provision for credit losses in our Consolidated Statement of Earnings. As a result, any subsequent changes we make to our underlying assumptions and estimates may result in a material adverse impact to our results of operations and the Company’s ability to return capital to our shareholders. In addition, significant assumptions and estimates are involved in determining certain disclosures required under GAAP, including those involving the fair value of our financial instruments. If the assumptions or estimates underlying our financial statements are incorrect or are required to change, the actual amounts realized on transactions and balances subject to those estimates will be different, and this could have a material adverse effect on our results of operations and financial condition.
For additional information on the key areas for which assumptions and estimates are used in preparing our financial statements, see “Management’s Discussion and Analysis of Financial Condition and Results of Operations—Critical Accounting Estimates” and Note 2. Basis of Presentation and Summary of Significant Accounting Policies to our consolidated financial statements.
Adverse financial market conditions or our inability to effectively manage our funding and liquidity risk could have a material adverse effect on our funding, liquidity and ability to meet our obligations.
We need to effectively manage our funding and liquidity in order to meet our cash requirements such as day-to-day operating expenses, extensions of credit to our customers, payments of principal and interest on our borrowings and payments on our other obligations. Our primary sources of funding and liquidity are collections from our customers, deposits, funds from securitized financings and proceeds from unsecured borrowings. If we do not have sufficient liquidity, we may not be able to meet our obligations, particularly during a liquidity stress event. If we maintain or are required to maintain too much liquidity, it could be costly and reduce our financial flexibility. For example, at December 31, 2020, due to the reduction in loan receivables and strength in our deposit platform, we continued to carry a high level of liquidity, which resulted in the company holding excess capital and a decrease in our net interest margin for the year ended December 31, 2020.
We will need additional financing in the future to refinance any existing debt and finance growth of our business. The availability of additional financing will depend on a variety of factors such as financial market conditions generally, including the availability of credit to the financial services industry, consumers’ willingness to place money on deposit in the Bank, our performance and credit ratings and the performance of our securitized portfolios. Disruptions, uncertainty or volatility in the capital, credit or deposit markets, such as the uncertainty and volatility experienced in the capital and credit markets during periods of financial stress and other economic and political conditions in the global markets and concerning the level of U.S. government debt and fiscal measures that may be taken over the longer term to address these matters, may limit our ability to obtain additional financing or refinance maturing liabilities on desired terms (including funding costs) in a timely manner or at all. As a result, we may be forced to delay obtaining funding or be forced to issue or raise funding on undesirable terms, which could significantly reduce our financial flexibility and cause us to contract or not grow our business, all of which could have a material adverse effect on our results of operations and financial conditions.
In addition, at December 31, 2020, we had an aggregate of $5.4 billion of undrawn credit facilities, subject to customary borrowing conditions, from private lenders under our securitization programs and an unsecured revolving credit facility. Our ability to draw on such commitments is subject to the satisfaction of certain conditions, including the applicable securitization trust having sufficient collateral to support the draw and the absence of an early amortization event. Moreover, there are regulatory reforms that have been proposed or adopted in the United States and internationally that are intended to address certain issues that affected banks in the last financial crisis. These reforms, generally referred to as “Basel III,” subject banks to more stringent capital, liquidity and leverage requirements. To the extent that the Basel III requirements result in increased costs to the banks providing undrawn committed capacity under our securitization programs, these costs are likely to be passed on to us. In addition, in response to Basel III, some banks in the market (including certain of the private lenders in our securitization programs) have added provisions to their credit agreements permitting them to delay disbursement of funding requests for 30 days or more. If our bank lenders require delayed disbursements of funding and/or higher pricing for committing undrawn capacity to us, our cost of funding and access to liquidity could be adversely affected.
While financial market conditions are generally stable, there can be no assurance that significant disruptions, uncertainties and volatility will not occur in the future. If we are unable to continue to finance our business, access capital markets and attract deposits on favorable terms and in a timely manner, or if we experience an increase in our borrowing costs or otherwise fail to manage our liquidity effectively, our results of operations and financial condition may be materially adversely affected.
Our inability to grow our deposits in the future could materially adversely affect our liquidity and ability to grow our business.
We obtain deposits directly from retail and commercial customers or through brokerage firms that offer our deposit products to their customers. At December 31, 2020, we had $52.1 billion in direct deposits and $10.7 billion in deposits originated through brokerage firms (including network deposit sweeps procured through a program arranger who channels brokerage account deposits to us). A key part of our liquidity plan and funding strategy is to continue to fund our growth through direct deposits.
The deposit business is highly competitive, with intense competition in attracting and retaining deposits. We compete on the basis of the rates we pay on deposits, features and benefits of our products, the quality of our customer service and the competitiveness of our digital banking capabilities. Our ability to originate and maintain retail deposits is also highly dependent on the strength of the Bank and the perceptions of consumers and others of our business practices and our financial health. Adverse perceptions regarding our reputation could lead to difficulties in attracting and retaining deposits accounts. Negative public opinion could result from actual or alleged conduct in a number of areas, including lending practices, regulatory compliance, inadequate protection of customer information or sales and marketing activities, and from actions taken by regulators or others in response to such conduct.
The demand for the deposit products we offer may also be reduced due to a variety of factors, such as demographic patterns, changes in customer preferences, reductions in consumers’ disposable income, regulatory actions that decrease customer access to particular products or the availability of competing products. Competition from other financial services firms and others that use deposit funding products may affect deposit renewal rates, costs or availability. Changes we make to the rates offered on our deposit products may affect our profitability and liquidity.
The Federal Deposit Insurance Act (the “FDIA”) prohibits an insured bank from accepting brokered deposits or offering interest rates on any deposits significantly higher than the prevailing rate in the bank’s normal market area or nationally (depending upon where the deposits are solicited), unless it is “well capitalized,” or it is “adequately capitalized” and receives a waiver from the FDIC. A bank that is “adequately capitalized” and accepts brokered deposits under a waiver from the FDIC may not pay an interest rate on any deposit in excess of 75 basis points over certain prevailing market rates. There are no such restrictions under the FDIA on a bank that is “well capitalized” and at December 31, 2020, the Bank met or exceeded all applicable requirements to be deemed “well capitalized” for purposes of the FDIA. However, there can be no assurance that the Bank will continue to meet those requirements. Limitations on the Bank’s ability to accept brokered deposits for any reason (including regulatory limitations on the amount of brokered deposits in total or as a percentage of total assets) in the future could materially adversely impact our funding costs and liquidity. Any limitation on the interest rates the Bank can pay on deposits could competitively disadvantage us in attracting and retaining deposits and have a material adverse effect on our business.
A reduction in our credit ratings could materially increase the cost of our funding from, and restrict our access to, the capital markets.
Synchrony's senior unsecured debt currently is rated BBB- (negative outlook) by Fitch Ratings, Inc. (“Fitch”) and BBB- (negative outlook) by Standard & Poor’s (“S&P”). The Bank’s senior unsecured debt currently is rated BBB- (negative outlook) by Fitch and BBB (negative outlook) by S&P. Although we have not requested that Moody’s Investor Services, Inc. (“Moody’s”) provide a rating for our senior unsecured debt, we believe that if Moody’s were to issue a rating on our unsecured debt, its rating would be lower than the comparable ratings issued by Fitch and S&P. The ratings for our unsecured debt are based on a number of factors, including our financial strength, as well as factors that may not be within our control, such as macroeconomic conditions and the rating agencies’ perception of the industries in which we operate and the products we offer. The ratings of our asset-backed securities are, and will continue to be, based on a number of factors, including the quality of the underlying loan receivables and the credit enhancement structure with respect to each series of asset-backed securities, as well as our credit rating as sponsor and servicer of our publicly registered securitization trusts. These ratings also reflect the various methodologies and assumptions used by the rating agencies, which are subject to change and could adversely affect our ratings. The rating agencies regularly evaluate our credit ratings as well as the credit ratings of our asset-backed securities. A downgrade in our unsecured debt or asset-backed securities credit ratings (or investor concerns that a downgrade may occur) could materially increase the cost of our funding from, and restrict our access to, the capital markets.
If the ratings on our asset-backed securities are reduced, put on negative watch or withdrawn, it may have an adverse effect on the liquidity or the market price of our asset-backed securities and on the cost of, or our ability to continue using, securitized financings to the extent anticipated.
Our inability to securitize our loan receivables would have a material adverse effect on our business, liquidity, cost of funds and financial condition.
We use the securitization of loan receivables, which involves the transfer of loan receivables to a trust and the issuance by the trust of asset-backed securities to third-party investors, as a significant source of funding. Our average level of securitized financings from third parties was $8.7 billion and $11.9 billion for the years ended December 31, 2020 and 2019, respectively. For a discussion of our securitization activities, see “Management’s Discussion and Analysis of Financial Condition and Results of Operations—Funding, Liquidity and Capital Resources—Funding Sources—Securitized Financings” and Note 5. Variable Interest Entities to our consolidated financial statements.
There can be no assurance that the securitization market for credit cards will not experience future disruptions. The extent to which we securitize our loan receivables in the future will depend in part upon the conditions in the securities markets in general and the credit card asset-backed securities market in particular, the availability of loan receivables for securitization, the overall credit quality of our loan receivables and the conformity of the loan receivables and our securitization program to rating agency requirements, the costs of securitizing our loan receivables, and the legal, regulatory, accounting and tax requirements governing securitization transactions. In the event we are unable to refinance existing asset-backed securities with new asset-backed securities, we would be required to rely on other sources of funding, which may not be available or may be available only at higher cost. Further, in the event we are unable to refinance existing asset-backed securities from our nonbank subsidiary securitization trust with new securities from the same trust, there are structural and regulatory constraints on our ability to refinance these asset-backed securities with Bank deposits or other funding at the Bank, and therefore we would be required to rely on sources outside of the Bank, which may not be available or may be available only at higher cost. A prolonged inability to securitize our loan receivables on favorable terms, or at all, or to refinance our asset-backed securities would have a material adverse effect on our business, liquidity, cost of funds and financial condition.
The occurrence of an early amortization of our securitization facilities would have a material adverse effect on our liquidity and cost of funds.
Our liquidity would be materially adversely affected by the occurrence of events resulting in the early amortization of our existing securitized financings. During an early amortization period, principal collections from the loan receivables in our asset-backed securitization trust in which the early amortization event occurred would be applied to repay principal of the trust's asset-backed securities rather than being available on a revolving basis to fund purchases of newly originated loan receivables. This would negatively impact our liquidity, including our ability to originate new loan receivables under existing accounts, and require us to rely on alternative funding sources, which might increase our funding costs or might not be available when needed.
Our loss of the right to service or subservice our securitized loan receivables would have a material adverse effect on our liquidity and cost of funds.
Synchrony currently acts as servicer with respect to our nonbank subsidiary securitization trust, and the Bank acts as servicer with respect to our other two securitization trusts. If Synchrony or the Bank, as applicable, defaults in its servicing obligations, an early amortization event could occur with respect to the relevant asset-backed securities and/or Synchrony or the Bank, as applicable, could be replaced as servicer. Servicer defaults include, for example, the failure of the servicer to make any payment, transfer or deposit in accordance with the securitization documents, a breach of representations, warranties or agreements made by the servicer under the securitization documents, the delegation of the servicer’s duties contrary to the securitization documents and the occurrence of certain insolvency events with respect to the servicer. Such an early amortization event would have the adverse consequences discussed in the immediately preceding risk factor.
If either Synchrony or the Bank defaults in its servicing obligations with respect to any of our three securitization trusts, a third party could be appointed as servicer of such trust. If a third-party servicer is appointed, there is no assurance that the third party will engage us as sub-servicer, in which event we would no longer be able to control the manner in which the related trust’s assets are serviced, and the failure of a third party to appropriately service such assets could lead to an early amortization event in the affected securitization trust, which would have the adverse consequences discussed in the immediately preceding risk factor.
Lower payment rates on our securitized loan receivables could materially adversely affect our liquidity and financial condition.
Certain collections from our securitized loan receivables come back to us through our subsidiaries, and we use these collections to fund our purchase of newly originated loan receivables to collateralize our securitized financings. If payment rates on our securitized loan receivables are lower than they have historically been, fewer collections will be remitted to us on an ongoing basis. Further, certain series of our asset-backed securities include a requirement that we accumulate principal collections in a restricted account for a specified number of months prior to the applicable security’s maturity date. We are required under the program documents to lengthen this accumulation period to the extent we expect the payment rates to be low enough that the current length of the accumulation period is inadequate to fully fund the restricted account by the applicable security’s maturity date. Lower payment rates, and in particular, payment rates that are low enough that we are required to lengthen our accumulation periods, could materially adversely affect our liquidity and financial condition.
Changes in market interest rates could have a material adverse effect on our net earnings, funding and liquidity.
Changes in market interest rates cause our net interest income to increase or decrease, as certain of our assets and liabilities carry interest rates that fluctuate with market benchmarks. At December 31, 2020, 53.2% of our loan receivables were priced at a fixed interest rate to the customer, with the remaining 46.8% at a floating interest rate. We fund our assets with a combination of fixed rate and floating rate funding sources that include deposits, asset-backed securities and unsecured debt. The interest rate benchmark for our floating rate assets is the prime rate, and the interest rate benchmark for our floating rate liabilities is generally either the LIBOR or the federal funds rate. The prime rate and LIBOR or the federal funds rate could reset at different times or could diverge, leading to mismatches in the interest rates on our floating rate assets and floating rate liabilities. Additionally, on July 27, 2017 the UK Financial Conduct Authority announced that it would no longer encourage or compel banks to continue to contribute quotes and maintain LIBOR after 2021. There is no definitive information regarding the future utilization of LIBOR or of any particular replacement rate. To the extent we are unable to position the balance sheet (naturally or using derivatives) to effectively match the interest rates on our assets and liabilities, or are unable to effectively manage any transition from LIBOR to a replacement rate or rates, our net earnings could be materially adversely affected.
Competitive and regulatory factors may limit our ability to raise interest rates on our loans. In addition, some of our program agreements limit the rate of interest we can charge to customers. If interest rates were to rise materially over a sustained period of time, and we are unable to sufficiently raise our interest rates in a timely manner, or at all, our net interest margin could be adversely impacted, which could have a material adverse effect on our net earnings.
Interest rates may also adversely impact our customers’ spending levels and ability and willingness to pay amounts owed to us. Our floating rate credit products bear interest rates that fluctuate with the prime rate. Higher interest rates often lead to higher payment obligations by customers to us and other lenders under mortgage, credit card and other consumer loans, which may reduce our customers’ ability to remain current on their obligations to us and therefore lead to increased delinquencies, bankruptcies, charge-offs, allowances for credit losses, and decreasing recoveries, all of which could have a material adverse effect on our net earnings.
Changes in interest rates and competitor responses to these changes may also impact customer decisions to maintain deposits with us, and reductions in deposits could materially adversely affect our funding costs and liquidity.
We assess our interest rate risk by estimating the net interest income impact of various interest rate scenarios. We take risk mitigation actions based on those assessments. Changes in interest rates could materially reduce our net interest income and our net earnings, and could also increase our funding costs and reduce our liquidity, especially if actual conditions turn out to be materially different from our assumptions. For a discussion of interest rate risk sensitivities, see “Quantitative and Qualitative Disclosures About Market Risk—Interest Rate Risk.”
We rely extensively on models in managing many aspects of our business, and if they are not accurate or are misinterpreted, it could have a material adverse effect on our business and results of operations.
We rely extensively on models in managing many aspects of our business, including liquidity and capital planning (including stress testing), customer selection, credit and other risk management, pricing, reserving and collections management. The models may prove in practice to be less predictive than we expect for a variety of reasons, including as a result of errors in constructing, interpreting or using the models or the use of inaccurate assumptions (including failures to update assumptions appropriately or in a timely manner). Our assumptions may be inaccurate for many reasons including that they often involve matters that are inherently difficult to predict and beyond our control (e.g., macroeconomic conditions and their impact on partner and customer behaviors) and they often involve complex interactions between a number of dependent and independent variables, factors and other assumptions. The errors or inaccuracies in our models may be material, and could lead us to make wrong or sub-optimal decisions in managing our business, and this could have a material adverse effect on our business, results of operations and financial condition.
Our business depends on our ability to successfully manage our credit risk, and failing to do so may result in high charge-off rates.
Our success depends on our ability to manage our credit risk while attracting new customers with profitable usage patterns. We select our customers, manage their accounts and establish terms and credit limits using proprietary scoring models and other analytical techniques that are designed to set terms and credit limits to appropriately compensate us for the credit risk we accept, while encouraging customers to use their available credit. The models and approaches we use to manage our credit risk may not accurately predict future charge-offs for various reasons discussed in the preceding risk factors.
Our ability to manage credit risk and avoid high charge-off rates also may be adversely affected by economic conditions that may be difficult to predict, such as the last financial crisis. The assessment of our credit profile includes the evaluation of portfolio mix, account maturation, as well as broader consumer trends, such as payment behavior and overall indebtedness. See “Management's Discussion and Analysis—Results of Operations—Business Trends and Conditions” for further discussion of our expectations of future credit trends, in the near term. Credit trends may deteriorate materially from our expectations if economic conditions were to deteriorate.
In addition, we remain subject to conditions in the consumer credit environment. Our credit underwriting and risk management strategies are used to manage our credit exposures; however, there can be no assurance that those will enable us to avoid high charge-off levels or delinquencies, or that our allowance for credit losses will be sufficient to cover actual losses.
A customer’s ability to repay us can be negatively impacted by increases in their payment obligations to other lenders under mortgage, credit card and other loans (including student loans). These changes can result from increases in base lending rates or structured increases in payment obligations, and could reduce the ability of our customers to meet their payment obligations to other lenders and to us. In addition, a customer’s ability to repay us can be negatively impacted by the restricted availability of credit to consumers generally, including reduced and closed lines of credit. Customers with insufficient cash flow to fund daily living expenses and lack of access to other sources of credit may be more likely to increase their card usage and ultimately default on their payment obligations to us, resulting in higher credit losses in our portfolio. Our collection operations may not compete effectively to secure more of customers’ diminished cash flow than our competitors. We may not identify customers who are likely to default on their payment obligations to us and reduce our exposure by closing credit lines and restricting authorizations quickly enough, which could have a material adverse effect on our business, results of operations and financial condition. In addition, our collection strategy depends in part on the sale of debt to third-party buyers. Regulatory or other factors may adversely affect the pricing of our debt sales or the performance of our third-party buyers, which may result in higher credit losses in our portfolio. At December 31, 2020, 23% of our portfolio’s loan receivables were from customers with a Vantage score of 650 or less (excluding unrated accounts), who typically have higher delinquency and credits losses than consumers with higher credit scores.
Our ability to manage credit risk also may be adversely affected by legal or regulatory changes (such as bankruptcy laws and minimum payment regulations) and collection regulations, competitors’ actions and consumer behavior, as well as inadequate collections staffing, techniques, models and performance of vendors such as collection agencies.
We may not be able to offset increases in our costs with decreased payments under our retailer share arrangements, which could reduce our profitability.
Most of our Retail Card program agreements and certain other program agreements contain retailer share arrangements that provide for payments to our partners if the economic performance of the relevant program exceeds a contractually defined threshold. Although the share arrangements vary by partner, these arrangements are generally structured to measure the economic performance of the program, based typically on agreed upon program revenues (including interest income and certain other income) less agreed upon program expenses (including interest expense, provision for credit losses, retailer payments and operating expenses), and share portions of this amount above a negotiated threshold. These arrangements are typically designed to permit us to achieve an economic return before we are required to make payments to our partners based on the agreed contractually defined threshold. However, because the threshold and the economic performance of a program that are used to calculate payments to our partners may be based on, among other things, agreed upon measures of program expenses rather than our actual expenses, we may not be able to pass on increases in our actual expenses (such as funding costs or operating expenses) in the form of reduced payments under our retailer share arrangements, and our economic return on a program could be adversely affected. While most of our agreements contain retailer share arrangements, in some cases, where we instead provide other economic benefits to our partners such as royalties on purchase volume or payments for new accounts (for example, on our co-branded credit cards), our ability to offset increases in our costs is limited.
Reductions in interchange fees may reduce the competitive advantages our private label credit card products currently have by virtue of not charging interchange fees and would reduce our income from those fees.
Interchange is a fee merchants pay to the interchange network in exchange for the use of the network’s infrastructure and payment facilitation, and which are paid to credit card issuers to compensate them for the risk they bear in lending money to customers. We earn interchange fees on Dual Card and general purpose co-branded credit card transactions but we typically do not charge or earn interchange fees from our partners or customers on our private label credit card products.
Merchants, trying to decrease their operating expenses, have sought to, and have had some success at, lowering interchange rates. Several recent events and actions indicate a continuing increase in focus on interchange by both regulators and merchants. Beyond pursuing litigation, legislation and regulation, merchants are also pursuing alternate payment platforms as a means to lower payment processing costs. To the extent interchange fees are reduced, one of our current competitive advantages with our partners—that we typically do not charge interchange fees when our private label credit card products are used to purchase our partners’ goods and services—may be reduced. Moreover, to the extent interchange fees are reduced, our income from those fees will be lower. We received $652 million of interchange fees for the year ended December 31, 2020. As a result, a reduction in interchange fees could have a material adverse effect on our business and results of operations. In addition, for our Dual Cards and general purpose co-branded credit cards, we are subject to the operating regulations and procedures set forth by the interchange network, and our failure to comply with these operating regulations, which may change from time to time, could subject us to various penalties or fees, or the termination of our license to use the interchange network, all of which could have a material adverse effect on our business and results of operations.
Legal Risks
We have international operations that subject us to various international risks as well as increased compliance and regulatory risks and costs.
We have international operations, primarily in India, the Philippines and Canada, and some of our third-party service providers provide services to us from other countries, all of which subject us to a number of international risks, including, among other things, sovereign volatility and socio-political instability. For example, the Philippines has in the past experienced severe political and social instability. Any future political or social instability in the countries in which we operate could have a material adverse effect on our business operations.
U.S. regulations also govern various aspects of the international activities of domestic corporations and increase our compliance and regulatory risks and costs. Any failure on our part or the part of our service providers to comply with applicable U.S. regulations, as well as the regulations in the countries and markets in which we or they operate, could result in fines, penalties, injunctions or other similar restrictions, any of which could have a material adverse effect on our business, results of operations and financial condition.
If we are alleged to have infringed upon the intellectual property rights owned by others or are not able to protect our intellectual property, our business and results of operations could be adversely affected.
Competitors or other third parties may allege that we, or consultants or other third parties retained or indemnified by us, infringe on their intellectual property rights. We also may face allegations that our employees have misappropriated intellectual property of their former employers or other third parties. Given the complex, rapidly changing and competitive technological and business environment in which we operate, and the potential risks and uncertainties of intellectual property-related litigation, an assertion of an infringement claim against us may cause us to spend significant amounts to defend the claim (even if we ultimately prevail), pay significant money damages, lose significant revenues, be prohibited from using the relevant systems, processes, technologies or other intellectual property, cease offering certain products or services, or incur significant license, royalty or technology development expenses. Moreover, it has become common in recent years for individuals and groups to purchase intellectual property assets for the sole purpose of making claims of infringement and attempting to extract settlements from companies like ours. Even in instances where we believe that claims and allegations of intellectual property infringement against us are without merit, defending against such claims is time consuming and expensive and could result in the diversion of time and attention of our management and employees. In addition, although in some cases a third party may have agreed to indemnify us for such costs, such indemnifying party may refuse or be unable to uphold its contractual obligations.
Moreover, we rely on a variety of measures to protect our intellectual property and proprietary information, including copyrights, trademarks, patents, trade secrets and controls on access and distribution. These measures may not prevent misappropriation or infringement of our intellectual property or proprietary information and a resulting loss of competitive advantage, and in any event, we may be required to litigate to protect our intellectual property and proprietary information from misappropriation or infringement by others, which is expensive, could cause a diversion of resources and may not be successful. Third parties may challenge, invalidate or circumvent our intellectual property, or our intellectual property may not be sufficient to provide us with competitive advantages. Our competitors or other third parties may independently design around or develop similar technology, or otherwise duplicate our services or products such that we could not assert our intellectual property rights against them. In addition, our contractual arrangements may not effectively prevent disclosure of our intellectual property or confidential and proprietary information or provide an adequate remedy in the event of an unauthorized disclosure.
Litigation, regulatory actions and compliance issues could subject us to significant fines, penalties, judgments, remediation costs and/or requirements resulting in increased expenses.
Our business is subject to increased risks of litigation and regulatory actions as a result of a number of factors and from various sources, including the highly regulated nature of the financial services industry, the focus of state and federal prosecutors on banks and the financial services industry and the structure of the credit card industry.
In the normal course of business, from time to time, we have been named as a defendant in various legal actions, including arbitrations, class actions and other litigation, arising in connection with our business activities. Certain of the legal actions include claims for substantial compensatory and/or punitive damages, or claims for indeterminate amounts of damages. In addition, while historically the arbitration provision in our customer agreements generally has limited our exposure to consumer class action litigation, there can be no assurance that we will be successful in enforcing our arbitration clause in the future. There may also be legislative or other efforts to directly or indirectly prohibit the use of pre-dispute arbitration clauses, or we may be compelled as a result of competitive pressure or reputational concerns to voluntarily eliminate pre-dispute arbitration clauses. If the arbitration provision is not enforceable or eliminated (for whatever reason), our exposure to class action litigation could increase significantly.
We are also involved, from time to time, in reviews, investigations and proceedings (both formal and informal) by governmental agencies regarding our business (collectively, “regulatory matters”), which could subject us to significant fines, penalties, obligations to change our business practices or other requirements resulting in increased expenses, diminished earnings and damage to our reputation. The current environment of additional regulation, increased regulatory compliance efforts and enhanced regulatory enforcement has resulted in significant operational and compliance costs and may prevent or make it less attractive for us to continue providing certain products and services. There is no assurance that these regulatory matters or other factors will not, in the future, affect how we conduct our business and in turn have a material adverse effect on our business, results of operations and financial condition.
We contest liability and/or the amount of damages as appropriate in each pending matter. The outcome of pending and future matters could be material to our results of operations, financial condition and cash flows depending on, among other factors, the level of our earnings for that period, and could adversely affect our business and reputation. For a discussion of certain legal proceedings, see “Regulation—Consumer Financial Services Regulation,” and Note 17. Legal Proceedings and Regulatory Matters to our consolidated financial statements.
In addition to litigation and regulatory matters, from time to time, through our operational and compliance controls, we identify compliance issues that require us to make operational changes and, depending on the nature of the issue, result in financial remediation to impacted cardholders. These self-identified issues and voluntary remediation payments could be significant depending on the issue and the number of cardholders impacted. They also could generate litigation or regulatory investigations that subject us to additional adverse effects on our business, results of operations and financial condition.
General Risks
Damage to our reputation could negatively impact our business.
Maintaining a positive reputation is critical to our attracting and retaining customers, partners, investors and employees. In particular, adverse perceptions regarding our reputation could also make it more difficult for us to execute on our strategy of increasing retail deposits at the Bank and may lead to decreases in deposits. Harm to our reputation can arise from many sources, including employee misconduct, misconduct by our partners, outsourced service providers or other counterparties, litigation or regulatory actions, failure by us or our partners to meet minimum standards of service and quality, inadequate protection of customer information and compliance failures. Negative publicity regarding us (or others engaged in a similar business or activities), whether or not accurate, may damage our reputation, which could have a material adverse effect on our business, results of operations and financial condition.
Our risk management processes and procedures may not be effective in mitigating our risks.
Our risk management processes and procedures seek to appropriately balance risk and return and mitigate risks. We have established processes and procedures intended to identify, measure, monitor and control the types of risk to which we are subject, including credit risk, market risk, liquidity risk, operational risk (including compliance risk), strategic risk, and reputational risk. Credit risk is the risk of loss that arises when an obligor fails to meet the terms of an obligation. We are exposed to both consumer credit risk, from our customer loans, and institutional credit risk, principally from our partners. Market risk refers to the risk that a change in the level of one or more market prices, rates, indices, correlations or other market factors will result in losses for a position or portfolio. Liquidity risk is the risk that financial condition or overall safety and soundness are adversely affected by an inability, or perceived inability, to meet obligations and support business growth. Operational risk is the risk of loss arising from inadequate or failed processes, people or systems, external events (i.e., natural disasters) or compliance, reputational or legal matters and includes those risks as they relate directly to us as well as to third parties with whom we contract or otherwise do business. Strategic risk is the risk from changes in the business environment, improper implementation of decisions or inadequate responsiveness to changes in the business environment. Reputational risk is the risk arising from negative perception on the part of customers, counterparties, shareholders, investors, rating agencies, regulators and employees that can adversely affect the Company’s ability to maintain existing talent and customers and establish new business relationships with continued access to sources of funding. See “Our Business—Credit Risk Management” and “Risks—Risk Management” for additional information on the types of risks affecting our business.
We seek to monitor and control our risk exposure through a framework that includes our Risk Appetite Statement, Enterprise Risk Assessment (ERA) process, risk policies, procedures and controls, reporting requirements, and corporate culture and values in conjunction with the risk management accountability incorporated into our integrated Risk Management Framework, which includes our governance structure and three distinct Lines of Defense. Management of our risks in some cases depends upon the use of analytical and/or forecasting models. If the models that we use to manage these risks are ineffective at predicting future losses or are otherwise inadequate, we may incur unexpected losses or otherwise be adversely affected. In addition, the information we use in managing our credit and other risk may be inaccurate or incomplete as a result of error or fraud, both of which may be difficult to detect and avoid. There may also be risks that exist, or that develop in the future, that we have not appropriately anticipated, identified or mitigated including when processes are changed or new products and services are introduced. If our Risk Management Framework does not effectively identify and control our risks, we could suffer unexpected losses or be adversely affected, and that could have a material adverse effect on our business, results of operations and financial condition.
Our business could be adversely affected if we are unable to attract, retain and motivate key officers and employees.
Our success depends, in large part, on our ability to retain, recruit and motivate key officers and employees. Our senior management team has significant industry experience and would be difficult to replace. Competition for senior executives in the financial services and payment industry is intense. We may not be able to attract and retain qualified personnel to replace or succeed members of our senior management team or other key personnel. Guidelines issued by the federal banking regulators prohibits our payment of "excessive" compensation, or compensation that could lead to our material financial loss, to our executives, employees, and directors. In addition, proposed rules implementing the executive compensation provisions of the Dodd-Frank Act would limit the type and structure of compensation arrangements that we may enter into with our senior executives and persons deemed "significant risk-takers." These restrictions could negatively impact our ability to compete with other companies in recruiting, retaining and motivating key personnel. Failure to retain talented senior leadership could have a material adverse effect on our business, results of operations and financial condition.
Tax legislation initiatives or challenges to our tax positions could adversely affect our results of operations and financial condition.
We operate in multiple jurisdictions and we are subject to tax laws and regulations of the U.S. federal, state and local governments, and of various foreign jurisdictions. From time to time legislative initiatives may be proposed, which may impact our effective tax rate and could adversely affect our deferred tax assets, tax positions and/or our tax liabilities. In addition, U.S. federal, state and local, as well as foreign, tax laws and regulations are extremely complex and subject to varying interpretations. There can be no assurance that our historical tax positions will not be challenged by relevant tax authorities or that we would be successful in defending our positions in connection with any such challenge.
State sales tax rules and regulations, and their application and interpretation by the respective states, could change and adversely affect our results of operations.
State sales tax rules and regulations, and their application and interpretation by the respective states, could adversely affect our results of operations. Retailers collect sales tax from retail customers and remit those collections to the applicable states. When customers fail to repay their loans, including the amount of sales tax advanced by us to the merchant on their behalf, we are entitled, in some cases, to seek a refund of the amount of sales tax from the applicable state. Sales tax laws and regulations enacted by the various states are subject to interpretation, and our compliance with such laws is routinely subject to audit and review by the states. Audit risk is concentrated in several states, and these states are conducting ongoing audits. The outcomes of ongoing and any future audits and changes in the states’ interpretation of the sales tax laws and regulations involving the recovery of tax on bad debts could materially adversely impact our results of operations.
See “Regulation—Risk Factors Relating to Regulation” on page 94 for additional risk factors.
Risk Management
____________________________________________________________________________________________
Strong risk management is at the core of our business strategy and we have developed processes to manage the major categories of risk, namely credit, market, liquidity, operational (including compliance) strategic risk and reputational risk (considered across all risk types).
As described in greater detail below under “—Risk Management Roles and Responsibilities,” we manage enterprise risk using an integrated framework that includes board-level oversight, administration by a group of cross-functional management committees, and day-to-day implementation by a dedicated risk management team led by the Chief Risk Officer (“CRO”). We also utilize the "Three Lines of Defense" risk management model to demonstrate and structure the roles, responsibilities and accountabilities in the organization for taking and managing risk. The Risk Committee of the Board of Directors has responsibility for the oversight of the risk management program, and three other board committees have other oversight roles with respect to risk management. Several management committees and subcommittees have important roles and responsibilities in administering the risk management program, including the Enterprise Risk Management Committee (the “ERMC”), the Management Committee (the “MC”), the Asset and Liability Management Committee (the “ALCO”) and the Capital Management Committee (the "CMC"). This committee-focused governance structure provides a forum through which risk expertise is applied cross-functionally to all major decisions, including development of policies, processes and controls used by the CRO and risk management team to execute the risk management philosophy.
The enterprise risk management philosophy is to ensure that all relevant risks are appropriately identified, measured, monitored and controlled. The approach in executing this philosophy focuses on leveraging risk expertise to drive enterprise risk management using a strong governance framework structure, a comprehensive enterprise risk assessment program and an effective risk appetite framework.
Risk Categories
Risk management is organized around six major risk categories: credit risk, market risk, liquidity risk, operational risk (including compliance), strategic risk, and reputational risk. We evaluate the potential impact of a risk event on us (including subsidiaries) by assessing the partner and customer, financial, reputational, and legal and regulatory impacts.
Credit Risk
Credit risk is the risk of loss that arises when an obligor fails to meet the terms of a contract and/or the underlying collateral is insufficient to satisfy the obligation. Credit risk includes exposure to consumer credit risk from customer loans as well as institutional credit risk, principally from our partners. Consumer credit risk is one of our most significant risks. See “Our Business—Credit Risk Management” for a description of the customer credit risk management procedures.
Market Risk
Market risk refers to the risk that a change in the level of one or more market prices, rates, indices, correlations or other market factors will result in losses for a position or portfolio. The principal market risk exposures arise from volatility in interest rates and their impact on economic value, capitalization levels and earnings. Market risk is managed by the ALCO, and is subject to policy and risk appetite limits on sensitivity of both earnings at risk and the economic value of equity. Market risk metrics are reviewed by ALCO monthly, the Risk Committee on a quarterly basis and the Board of Directors as required.
Liquidity Risk
Liquidity risk is the risk that an institution’s financial condition or overall safety and soundness are adversely affected by a real or perceived inability to meet contractual obligations and support planned growth. The primary liquidity objective is to maintain a liquidity profile that will enable us, even in times of stress or market disruption, to fund our existing assets and meet liabilities in a timely manner and at an acceptable cost. Policy and risk appetite limits require us and the Bank (and other entities within our business, as applicable) to ensure that sufficient liquid assets are available to survive liquidity stresses over a specified time period. Our Risk Appetite Statement requires funding diversification, monitoring early warning indicators in the capital markets, and other related limits. ALCO reviews liquidity exposures continuously in the context of approved policy and risk appetite limits and reports results quarterly to the Risk Committee, and the Board of Directors as required.
Operational Risk
Operational risk is the risk of loss arising from inadequate or failed processes, people or systems, external events (i.e. natural disasters) or compliance, reputational or legal matters, and includes any of those risks as they relate directly to us and our subsidiaries, as well as to third parties with whom we contract or otherwise do business. Compliance risk arises from the failure to adhere to applicable laws, rules, regulations and internal policies and procedures. Operational risk also includes model risk relating to various financial and other models used by us and our subsidiaries, including the Bank, and is subject to a formal governance process.
Strategic Risk
Strategic risk consists of the current or prospective risk to earnings and capital arising from changes in the business environment and from adverse business decisions, improper implementation of decisions or lack of responsiveness to changes in the business environment. The New Product Introduction ("NPI") Sub-Committee assesses the strategic viability and consistency of each new product or service. All new initiatives require the approval of the NPI Sub-Committee and a select number of new product requests are escalated to the MC and the Board of Directors, based on level of risk.
Reputational Risk
Reputational risk is the risk arising from negative perception on the part of customers, counterparties, shareholders, investors, rating agencies, regulators and employees that can adversely affect the Company’s ability to maintain existing talent and customers and establish new business relationships with continued access to sources of funding.
Risk Management Roles and Responsibilities
Responsibility for risk management flows to individuals and entities throughout our Company, including the Board of Directors, various board and management committees and senior management. The corporate culture and values, in conjunction with the risk management accountability incorporated into the integrated Enterprise Risk Governance Framework, which includes governance structure and three distinct Lines of Defense, has facilitated, and will continue to facilitate, the evolution of an effective risk presence across the Company.
The “First Line of Defense” is comprised of the business areas whose day-to-day activities involve decision-making and associated risk-taking for the Company. As the business owner, the first line is responsible for identifying, assessing, managing and controlling that risk, and for mitigating our overall risk exposure. The first line formulates strategy and operates within the risk appetite and risk governance framework. The “Second Line of Defense,” also known as the independent risk management organization, provides oversight of first line risk taking and management. The second line assists in determining risk capacity, risk appetite, and the strategies, policies and structure for managing risks. The second line owns the risk governance framework. The “Third Line of Defense” is comprised of Internal Audit. The third line provides independent and objective assurance to senior management and to the Board of Directors and Audit Committee that the first and second line risk management and internal control systems and its governance processes are well-designed and working as intended.
Set forth below is a further description of the roles and responsibilities related to the key elements of the Enterprise Risk Governance Framework.
Board of Directors
The Board of Directors, among other things, has approved the enterprise-wide Risk Appetite Statement for the Company, as well as certain other risk management policies and oversees the Company’s strategic plan and enterprise-wide risk management program. The Board of Directors may assign certain risk management activities to applicable committees and management.
Board Committees
The Board of Directors has established four committees that assist the board in its oversight of risk management. These committees and their risk-related roles are described below.
Audit Committee
In coordination with the Risk Committees of the Company and the Bank, the Audit Committee’s role, among other things, is to review: (i) the Company’s major financial risk exposures and the steps management has taken to monitor and control these risks; (ii) the Company’s risk assessment and risk management practices and the guidelines, policies and processes for risk assessment and risk management; (iii) the organization, performance and audit findings of our internal audit function; (iv) our public disclosures and effectiveness of internal controls; and (v) the Company’s risk guidelines and policies relating to financial statements, financial systems, financial reporting processes, compliance and auditing, and allowance for credit losses.
Nominating and Corporate Governance Committee
The Nominating and Corporate Governance Committee’s role, among other things, is to: (i) review and approve certain transactions with related persons; (ii) review and resolve any conflict of interest involving directors or executive officers; (iii) oversee the risks, if any, related to corporate governance structure and practices; and (iv) identify and discuss with management the risks, if any, related to social responsibility actions and public policy initiatives.
Management Development and Compensation Committee
The Management Development and Compensation Committee’s role, among other things, is to: (i) review our incentive compensation arrangements with a view to appropriately balancing risk and financial results in a manner that does not encourage employees to expose us or any of our subsidiaries to imprudent risks, and are consistent with safety and soundness; and (ii) review (with input from our CRO and the Bank’s CRO) the relationship between risk management policies and practices, corporate strategies and senior executive compensation.
Risk Committee
The Risk Committee’s role, among other things, is to: (i) assist the Board of Directors in its oversight of the Company’s Enterprise Risk Governance Framework, including as it relates to credit, investment, market, liquidity, operational compliance strategic and reputational risks; (ii) review and, at least annually, approve the Company’s Enterprise Risk Governance Framework and risk assessment and risk management practices, guidelines and policies (including significant policies that management uses to manage credit and investment, market, liquidity, operational, compliance and strategic risks); (iii) review and, at least annually, recommend to the Board of Directors for approval the Company’s enterprise-wide risk appetite (including the Company’s liquidity risk tolerance), and review and approve the Company’s strategy relating to managing key risks and other policies on the establishment of risk limits as well as the guidelines, policies and processes for monitoring and mitigating such risks; (iv) meet separately on a regular basis with our CRO and (in coordination with the Bank’s Risk Committee, as appropriate) the Bank’s CRO; (v) receive periodic reports from management on metrics used to measure, monitor and manage known and emerging risks, including management’s view on acceptable and appropriate levels of exposure; (vi) receive reports from our internal audit, risk management and independent liquidity review functions on the results of risk management reviews and assessments; (vii) review and approve, at least annually, the Company’s enterprise-wide capital and liquidity framework (including its contingency funding plan) and, in coordination with the Bank’s Risk Committee, review, at least quarterly, the Bank’s, liquidity risk appetite, regulatory capital and ratios and internal capital adequacy assessment processes and, at least annually, the Bank’s allowance for credit losses methodology, annual capital plan and resolution plan; (viii) review, at least semi-annually, information from senior management regarding whether the Company is operating within its established risk appetite; (ix) review the status of financial services regulatory examinations; (x) review the independence, authority and effectiveness of the Company’s risk management function and independent liquidity review function; (xi) approve the appointment of, evaluate and, when appropriate, replace, the CRO; and (xii) review disclosure regarding risk contained in the Company’s annual and quarterly reports.
Management Committees
There are four management committees with important roles and responsibilities in the risk management function: the MC, the ERMC, the ALCO and the CMC. These committees and their risk-related roles are described below.
Management Committee
The MC is under the oversight of the Board of Directors and is comprised of our senior executives and chaired by our Chief Executive Officer. The MC has responsibility for reviewing and approving lending and investment activities of the Company, such as equity investments, acquisitions, dispositions, joint ventures, portfolio deals and investment issues regarding the Company. It is also responsible for overseeing the Company’s approach to managing its investments, reviewing and approving the Company’s annual strategic plan and annual operating plan, and overseeing activities administered by its Credit, Culture, Information Technology, New Product Introduction, Investment Review and Pricing subcommittees. The MC also reviews management reports provided on a periodic basis, or as requested, in order to monitor evolving issues, effectiveness of risk mitigation activities and performance against strategic plans. The MC may make decisions only within the authority that is granted to it by the Board of Directors and must escalate any investment or other proposals outside of its authority to the Board of Directors for final decision.
ERMC
The ERMC is a management committee under the oversight of the Risk Committee and is comprised of senior executives and chaired by the CRO. The ERMC has responsibility for risk oversight across the Company and for reporting on material risks to our Risk Committee. The responsibilities of the ERMC include the day-to-day oversight of risks impacting the Company, establishing a risk appetite statement and ensuring compliance across the Company with the overall risk appetite. The ERMC also oversees establishment of risk management policies, the performance and functioning of the relevant overall risk management function, and the implementation of appropriate governance activities and systems that support control of risks.
ALCO
The ALCO is a management committee under the oversight of the Risk Committee and is comprised of our senior executives and chaired by the Treasurer. It identifies, measures, monitors, manages and controls market, liquidity and credit (investments and bank relationships) risks to the Company’s balance sheet. ALCO activities include reviewing and monitoring cash management, investments, liquidity, funding and foreign exchange risk activities and overseeing the safe, sound and efficient operation of the Company in compliance with applicable policies, laws and regulations.
CMC
The CMC is a management committee under the oversight of the Risk Committee and is comprised of our senior executives and chaired by the SVP, Capital Management and Stress Testing. The CMC provides oversight of the Company’s capital management, stress testing, and recovery and resolution planning activities. The CMC supports the Risk Committee in overseeing capital management activities such as the Annual Capital Plan, the Internal Capital Adequacy Assessment Process, stress testing, the Pre-Provision Net Revenue and Credit Loss Methodologies, the Contingent Capital Plan as needed in the event of a breach, and the Recovery and Resolution Planning Process.
Chief Executive Officer, Chief Risk Officer and Other Senior Officers
The Chief Executive Officer (“CEO”) has ultimate responsibility for ensuring the management of the Company’s risk in accordance with the Company’s approved risk appetite statement, including through her role as chairperson of the MC. The CEO also provides leadership in communicating the risk appetite to internal and external stakeholders to help embed appropriate risk taking into the overall corporate culture of the Company.
The CRO manages our risk management team and, as chairperson of the ERMC, is responsible for establishing and implementing standards for the identification, management, measurement, monitoring and reporting of risk on an enterprise-wide basis. In collaboration with our CEO and the Chief Financial Officer, the CRO has responsibility for developing an appropriate risk appetite with corresponding limits that aligns with supervisory expectations, and this risk appetite statement has been approved by the Board of Directors. The CRO regularly reports to the Board of Directors and the Risk Committee on risk management matters.
The senior executive officers who serve as leaders in the "First Line of Defense," are responsible for ensuring that their respective functions operate within established risk limits, in accordance with the Company’s Risk Appetite Statement. As members of the ERMC and the MC, they are also responsible for identifying risks, considering risk when developing strategic plans, budgets and new products and implementing appropriate risk controls when pursuing business strategies and objectives. In addition, senior executive officers are responsible for deploying sufficient financial resources and qualified personnel to manage the risks inherent in the Company’s business activities.
Risk Management
The risk management team, including compliance, led by the CRO, provides oversight of our risk profile and is responsible for maintaining a compliance program that includes compliance risk assessment, policy development, testing and reporting activities. This team effectively serves in a “Second Line of Defense” role by overseeing the operating activities of the “First Line of Defense.”
Internal Audit Team
The internal audit team is responsible for performing periodic, independent reviews and testing of compliance with the Company’s and the Bank’s risk management policies and standards, as well as with regulatory guidance and industry best practices. The internal audit team also assesses the design of the Company's and the Bank's policies and standards and validates the effectiveness of risk management controls, and reports the results of such reviews to the Audit Committee. The internal audit team effectively serves as the “Third Line of Defense” for the Company.
Enterprise Risk Assessment Process
The Enterprise Risk Assessment process (“ERA”) is a top-down process designed to identify, assess and quantify risk across the Company’s primary risk categories and serves as a basis to determine the Company’s risk profile. The Enterprise Risk Management team, in collaboration with the Risk Pillar leaders, performs an independent ERA using a methodology that measures likelihood, impact, vulnerability and the speed of onset to rate risks across Synchrony. The ERA plays an important role in directing the risk management activities by helping prioritize initiatives and focus resources on the most appropriate risks. The ERA is performed annually and refreshed periodically, and is the basis of the Material Risk Inventory which is a key input in the strategic and capital planning processes.
Stress testing activities provide a forward-looking assessment of risks and losses. Stress testing is integrated into the strategic, capital and liquidity planning processes, and the results are used to identify portfolio vulnerabilities and develop risk mitigation strategies or contingency plans across a range of stressed conditions.
Risk Appetite Framework
We operate in accordance with a Risk Appetite Statement setting forth objectives, plans and limits, and expressing preferences with respect to risk-taking activities in the context of overall business goals. The risk appetite statement is approved annually by the Board of Directors, with delegated authority to the CRO for implementation throughout the Company. The Risk Appetite Statement serves as a tool to preclude activities that are inconsistent with the business and risk strategy. The Risk Appetite Statement is reviewed and approved at least annually as part of the business planning process and will be modified, as necessary, to include updated risk tolerances by risk category, enabling us to meet prescribed goals while continuing to operate within established risk boundaries.
REGULATION
Regulation Relating to Our Business
____________________________________________________________________________________________
Our business, including our relationships with our customers, is subject to regulation, supervision and examination under U.S. federal, state and foreign laws and regulations. These laws and regulations cover all aspects of our business, including lending and collection practices, treatment of our customers, safeguarding deposits, customer privacy and information security, capital structure, liquidity, dividends and other capital distributions, transactions with affiliates and conduct and qualifications of personnel. Such laws and regulations directly and indirectly affect key drivers of our profitability, including, for example, capital and liquidity, product offerings, risk management, and costs of compliance. As a savings and loan holding company and financial holding company, Synchrony is subject to regulation, supervision and examination by the Federal Reserve Board. As a large provider of consumer financial services, we are also subject to regulation, supervision and examination by the CFPB. The Bank is a federally chartered savings association. As such, the Bank is subject to regulation, supervision and examination by the OCC, which is its primary regulator, and by the CFPB. In addition, the Bank, as an insured depository institution, is supervised by the FDIC. In addition, the Dodd-Frank Act and regulations promulgated thereunder have had, and may continue to have, a significant impact on our business, results of operations and financial condition. As a result, the extensive laws and regulations to which we are subject and with which we must comply significantly impact our earnings, results of operations, financial condition and competitive position. The impact of such regulations on our business is discussed further below, as well as in “Management’s Discussion and Analysis of Financial Condition and Results of Operations” (MD&A) and “Risk Factors Relating to Regulation” of this Form 10-K Report.
The Dodd-Frank Wall Street Reform and Consumer Protection Act and Related Developments
The Dodd-Frank Act, which was enacted in 2010, significantly restructured the financial regulatory regime in the United States. Certain aspects of the Dodd-Frank Act are subject to rules that have been taking effect over several years or have been revised since their initial adoption.
On May 24, 2018, the President signed into law the Economic Growth, Regulatory Relief, and Consumer Protection Act (“EGRRCPA”), which amended the Dodd-Frank Act and modified certain post-crisis regulatory requirements. On October 10, 2019, the Federal Reserve Board, OCC, and FDIC issued final rules, which we refer to as the Tailoring Rules, that tailor the applicability of the Federal Reserve Board’s enhanced prudential standards relating to capital liquidity, and other risk management matters, and apply certain of these standards to savings and loan holding companies (other than those substantially engaged in insurance underwriting or commercial activities) that have total consolidated assets of $100 billion or more based on the average of the previous four quarters, referred to as “covered savings and loan holding companies.” Synchrony had average total consolidated assets of $96.5 billion for the four quarters ended December 31, 2020 and less than $100 billion in total consolidated assets for each of those quarters. As a result, Synchrony is not currently subject to most of the enhanced prudential standards under the Tailoring Rules. However, Synchrony’s average total consolidated assets have exceeded $100 billion in the past and may exceed such threshold again in future periods. If in the future Synchrony has average total consolidated assets of $100 billion or more based on a four quarter average, it will become subject to enhanced prudential standards following applicable transition periods.
The ongoing implementation of the Dodd-Frank Act, as well as the recent and possible future changes to the regulatory framework applicable to Synchrony and the Bank make it difficult to assess the overall financial impact of the Dodd-Frank Act and related regulatory developments on us and across the industry. See also “Regulation—Risk Factors Relating to Regulation—The Dodd-Frank Act and other legislative and regulatory developments have had, and may continue to have, a significant impact on our business, financial condition and results of operations.”
Savings and Loan Holding Company Regulation
Overview
As a savings and loan holding company, we are required to register and file periodic reports with, and are subject to regulation, supervision and examination by, the Federal Reserve Board. The Federal Reserve Board has adopted guidelines establishing safety and soundness standards on such matters as liquidity risk management, securitizations, operational risk management, internal controls and audit systems, business continuity, and compensation and other employee benefits. We are regularly reviewed and examined by the Federal Reserve Board, which results in supervisory comments and directions relating to many aspects of our business that require our response and attention.
The Federal Reserve Board has broad enforcement authority over us and our subsidiaries (other than the Bank and its subsidiaries). Under the Dodd-Frank Act, we are required to serve as a source of financial strength for any insured depository institution that we control, such as the Bank.
Capital
As a savings and loan holding company, Synchrony is subject to capital requirements.
The following are the minimum capital ratios to which Synchrony is subject:
•under the Basel III standardized approach, a common equity Tier 1 capital to risk-weighted assets ratio of 7% (the minimum of 4.5% plus a capital conservation buffer of 2.5%), a Tier 1 capital to risk-weighted assets ratio of 8.5% (the minimum of 6% plus a capital conservation buffer of 2.5%), and a total capital to risk-weighted assets ratio of 10.5% (a minimum of 8% plus a capital conservation buffer of 2.5%); and
•a leverage ratio of Tier 1 capital to total consolidated assets of 4%.
For a discussion of our capital ratios at December 31, 2020, see “Management’s Discussion and Analysis of Financial Condition and Results of Operations-Capital.”
Synchrony and the Bank have elected to delay until January 1, 2022 and phase in through December 31, 2024 the impact of CECL on their regulatory capital. See “—Legislative and Regulatory Developments” for additional information.
Under the Tailoring Rules, most covered savings and loan holding companies with average total consolidated assets of $100 billion or more, but less than $250 billion, are subject to supervisory stress tests on a biennial basis, in even calendar years. If in the future Synchrony has average total consolidated assets of $100 billion or more based on a four quarter average, it will become subject to these stress tests following a transition period of at least five quarters.
Additionally, under a final rule issued on January 19, 2021, the Federal Reserve Board has subjected covered savings and loan holding companies with average total consolidated assets of $100 billion or more to a stress capital buffer in lieu of the 2.5% capital conservation buffer. The stress capital buffer is calculated as the amount of loss of common equity Tier 1 capital incurred by the company in the severely adverse scenario of the most recent supervisory stress test exercise, assuming certain continued payments on capital instruments, and is subject to a floor of 2.5% of risk-weighted assets. If in the future Synchrony has average total consolidated assets of $100 billion or more based on a four quarter average, it will become subject to the stress capital buffer, and as a result, its capital requirements may increase and its ability to pay dividends, make other capital distributions, or redeem or repurchase its stock may be adversely impacted. See “—Legislative and Regulatory Developments” for additional information.
Dividends and Stock Repurchases
We are limited in our ability to pay dividends or repurchase our stock by the Federal Reserve Board, including on the basis that doing so would be an unsafe or unsound banking practice. Where we intend to declare or pay a dividend or repurchase our stock, we are expected to inform and consult with the Federal Reserve Board in advance to ensure that such dividend or repurchase does not raise supervisory concerns. It is the policy of the Federal Reserve Board that a savings and loan holding company like us should generally pay dividends on common stock and preferred stock out of earnings, and only if prospective earnings retention is consistent with the company’s capital needs and overall current and prospective financial condition.
According to guidance from the Federal Reserve Board, our dividend policies will be assessed against, among other things, our ability to achieve applicable Basel III capital ratio requirements. If we do not achieve applicable Basel III capital ratio requirements, we may not be able to pay dividends. Although we currently expect to meet applicable Basel III capital ratio requirements, inclusive of the capital conservation buffer, we cannot be sure that we will meet those requirements or that even if we do, if we will be able to pay dividends.
In evaluating the appropriateness of a proposed redemption or repurchase of stock, the Federal Reserve Board will consider, among other things, the potential loss that we may suffer from the prospective need to increase reserves and write down assets as a result of continued asset deterioration, and our ability to raise additional common equity and other capital to replace the stock that will be redeemed or repurchased. The Federal Reserve Board also will consider the potential negative effects on our capital structure of replacing common stock with any lower-tier form of regulatory capital issued. Moreover, regulatory review of any capital plan we are currently required to submit could result in restrictions on our ability to pay dividends or make other capital distributions. See “Regulation—Risk Factors Relating to Regulation—Failure by Synchrony and the Bank to meet applicable capital adequacy and liquidity requirements could have a material adverse effect on us” and “—We are subject to restrictions that limit our ability to pay dividends and repurchase our common stock; the Bank is subject to restrictions that limit its ability to pay dividends to us, which could limit our ability to pay dividends, repurchase our common stock or make payments on our indebtedness.”
Under a final rule issued on January 19, 2021, the Federal Reserve Board has subjected covered savings and loan holding companies with average total consolidated assets of $100 billion or more to formal capital plan submission requirements. If in the future Synchrony has average total consolidated assets of $100 billion or more based on a four quarter average, it will become subject to formal capital plan submission requirements, and as a result, its capital requirements may increase and its ability to pay dividends, make other capital distributions, or redeem or repurchase its stock may be adversely impacted. See “—Legislative and Regulatory Developments” for additional information.
Liquidity
Under the Tailoring Rules, covered savings and loan holding companies with average total consolidated assets of $100 billion or more must comply with enhanced prudential standards with respect to liquidity management, including maintaining diversified liquidity buffers and regularly conducting liquidity stress tests. If in the future Synchrony has average total consolidated assets of $100 billion or more based on a four quarter average, it will become subject to these enhanced prudential standards following a transition period of five quarters.
Activities
In general, savings and loan holding companies may only conduct, or acquire control of companies engaged in, financial activities as permitted under the relevant provisions of the Bank Holding Company Act and the Home Owners' Loan Act ("HOLA"). Savings and loan holding companies that have elected financial holding company status generally can engage in a broader range of financial activities than are otherwise permissible for savings and loan holding companies, including securities underwriting, dealing and making markets in securities, and making merchant banking investments in non-financial companies. Synchrony has elected for financial holding company status.
The Federal Reserve Board has the authority to limit a financial holding company’s ability to conduct otherwise permissible activities if the financial holding company or any of its depositary institution subsidiaries ceases to meet the applicable eligibility requirements, including requirements that the financial holding company and each of its U.S. depository institution subsidiaries maintain their status as “well-capitalized” and “well-managed.” The Federal Reserve Board may also impose corrective capital and/or managerial requirements on the financial holding company and may, for example, require divestiture of the holding company’s depository institutions if the deficiencies persist. Federal regulations additionally provide that if any depository institution controlled by a financial holding company fails to maintain at least a “Satisfactory” rating under the Community Reinvestment Act (“CRA”), the financial holding company and its subsidiaries are prohibited from engaging in additional activities that are permissible only for financial holding companies.
In addition, we are subject to banking laws and regulations that limit in certain respects the types of acquisitions and investments that we can make. For example, certain acquisitions of and investments in depository institutions or their holding companies that we may undertake are subject to the prior review and approval of our banking regulators, including the Federal Reserve Board, the OCC and the FDIC. Our banking regulators have broad discretion on whether to approve such acquisitions and investments. In deciding whether to approve a proposed acquisition or investment, federal bank regulators may consider, among other factors: (i) the effect of the acquisition or investment on competition, (ii) our financial condition and future prospects, including current and projected capital ratios and levels, (iii) the competence, experience and integrity of our management and its record of compliance with laws and regulations, (iv) the convenience and needs of the communities to be served, including our record of compliance under the CRA, (v) our effectiveness in combating money laundering, and (vi) any risks that the proposed acquisition poses to the U.S. banking or financial system.
Certain acquisitions of our voting stock may be subject to regulatory approval or notice under federal law. Investors are responsible for ensuring that they do not, directly or indirectly, acquire shares of our stock in excess of the amount that can be acquired without regulatory approval under the Change in Bank Control Act and the HOLA, which prohibit any person or company from acquiring control of us without, in most cases, the prior written approval of the Federal Reserve Board.
Savings Association Regulation
Overview
The Bank is required to file periodic reports with the OCC and is subject to regulation, supervision, and examination by the OCC, the FDIC, and the CFPB. The OCC has adopted guidelines establishing safety and soundness standards on such matters as loan underwriting and documentation, asset quality, earnings, internal controls and audit systems, risk management, interest rate risk exposure and compensation and other employee benefits. The Bank is periodically examined by the OCC, the FDIC, and the CFPB, which results in supervisory comments and directions relating to many aspects of the Bank’s business that require the Bank’s response and attention. In addition, the OCC, the FDIC, and the CFPB have broad enforcement authority over the Bank.
Capital
The Bank is required by OCC regulations to maintain specified levels of regulatory capital. Institutions that are not well-capitalized are subject to certain restrictions on brokered deposits and interest rates on deposits. The OCC is authorized and, under certain circumstances, required to take certain actions against an institution that fails to meet the minimum ratios for an adequately capitalized institution. At December 31, 2020, the Bank met or exceeded all applicable requirements to be deemed well-capitalized under OCC regulations.
The following are the minimum capital ratios to which the Bank is subject:
•under the Basel III standardized approach, a common equity Tier 1 capital to risk-weighted assets ratio of 7% (the minimum of 4.5% plus a capital conservation buffer of 2.5%), a Tier 1 capital to risk-weighted assets ratio of 8.5% (the minimum of 6% plus a capital conservation buffer of 2.5%), and a total capital to risk-weighted assets ratio of 10.5% (a minimum of 8% plus a capital conservation buffer of 2.5%); and
•a leverage ratio of Tier 1 capital to total consolidated assets of 4%.
For a discussion of the Bank’s capital ratios, see “Management’s Discussion and Analysis of Financial Condition and Results of Operations—Capital.”
As an insured depository institution, the Bank is also subject to the FDIA, which requires, among other things, the federal banking agencies to take “prompt corrective action” in respect of depository institutions that do not meet minimum capital requirements. The FDIA sets forth the following five capital tiers: “well-capitalized,” “adequately capitalized,” “undercapitalized,” “significantly undercapitalized” and “critically undercapitalized.” A depository institution’s capital tier will depend upon how its capital levels compare with various relevant capital measures and certain other factors that are established by regulation. To be well-capitalized for purposes of the FDIA, the Bank must maintain a common equity Tier 1 capital to risk-weighted assets ratio of 6.5%, a Tier 1 capital to risk-weighted assets ratio of 8%, a total capital to risk-weighted assets ratio of 10%, and a leverage ratio of Tier 1 capital to total consolidated assets of 5%, and not be subject to any written agreement, order or capital directive, or prompt corrective action directive issued by the OCC to meet or maintain a specific capital level for any capital measure. At December 31, 2020, the Bank met or exceeded all applicable requirements to be deemed well-capitalized for purposes of the FDIA.
Dividends and Stock Repurchases
OCC regulations limit the ability of savings associations to make distributions of capital, including payment of dividends, stock redemptions and repurchases, cash-out mergers and other transactions charged to the capital account. The Bank must obtain the OCC’s approval or give the OCC prior notice before making a capital distribution in certain circumstances, including if the Bank proposes to make a capital distribution when it does not meet certain capital requirements (or will not do so as a result of the proposed capital distribution) or certain net income requirements. In addition, the Bank must file a prior written notice of a planned or declared dividend or other distribution with the Federal Reserve Board. The OCC or the Federal Reserve Board may object to a capital distribution if: among other things, (i) the Bank is, or as a result of such distribution would be, undercapitalized, significantly undercapitalized or critically undercapitalized, (ii) the regulators have safety and soundness concerns or (iii) the distribution violates a prohibition in a statute, regulation, agreement between us and the OCC or the Federal Reserve Board, or a condition imposed on us in an application or notice approved by the OCC or the Federal Reserve Board. Additional restrictions on dividends apply if the Bank fails the QTL test (described below under “—Activities”).
The FDIA also prohibits any insured depository institution from making any capital distributions (including payment of a dividend) or paying any management fee to its parent holding company if the depository institution would thereafter be “undercapitalized.” If a depository institution is less than adequately capitalized, it must prepare and submit a capital restoration plan to its primary federal regulator for approval. For a capital restoration plan to be acceptable, among other things, the depository institution’s parent holding company must guarantee that the institution will comply with the capital restoration plan. If a depository institution fails to submit an acceptable capital restoration plan, it is treated as if it is “significantly undercapitalized.” A “significantly undercapitalized” depository institution may be subject to a number of requirements and restrictions, including orders to sell sufficient voting stock to become “adequately capitalized,” elect a new Board of Directors, reduce total assets or cease taking deposits from correspondent banks. A “critically undercapitalized” institution may be subject to the appointment of a conservator or receiver which could sell or liquidate the institution, be required to refrain from making payments on its subordinated debt, or be subject to additional restrictions on its activities.
Liquidity
The Bank is required to comply with prudential regulation in connection with liquidity. In particular, under OCC guidelines establishing heightened standards for governance and risk management (the "Heightened Standards"), the Bank is required to establish liquidity stress testing and planning processes, which the Bank has done. For a discussion of the Heightened Standards, see “—Heightened Standards for Risk Management Governance” below.
Activities
Under HOLA, the OCC requires the Bank to comply with the qualified thrift lender, or “QTL” test. Under the QTL test, the Bank is required to maintain at least 65% of its “portfolio assets” (total assets less (i) specified liquid assets up to 20% of total assets, (ii) intangibles, including goodwill and (iii) the value of property used to conduct business) in certain “qualified thrift investments” (primarily residential mortgages and related investments, including certain mortgage-backed securities, credit card loans, student loans and small business loans) in at least nine months of the most recent 12-month period. The Bank currently meets that test. A savings association that fails to meet the QTL test is subject to certain operating restrictions and may be required to convert to a national bank charter.
Savings associations, including the Bank, are subject as well to limitations on their lending and investments. These limitations include percentage of asset limitations on various types of loans the Bank may make. In addition, there are similar limitations on the types and amounts of investments the Bank may make.
Insured depository institutions, including the Bank, are subject to restrictions under Sections 23A and 23B of the Federal Reserve Act (as implemented by Federal Reserve Board Regulation W), which govern transactions between an insured depository institution and an affiliate, including an entity that is the institution’s direct or indirect holding company and a nonbank subsidiary of such a holding company. Restrictions in Sections 23A and 23B of the Federal Reserve Act apply to “covered transactions” such as extensions of credit, issuances of guarantees or asset purchases. In general, these restrictions require that any extensions of credit made by the insured depository institution to an affiliate must be fully secured with qualifying collateral and that the aggregate amount of covered transactions is limited, as to any one affiliate of the Bank, to 10% of the Bank’s capital stock and surplus, and, as to all of the Bank’s affiliates in the aggregate, to 20% of the Bank’s capital stock and surplus. In addition, transactions between the Bank and its affiliates must be on terms and conditions that are, or in good faith would be, offered by the Bank to non-affiliated companies (i.e., at arm’s length).
The CRA is a federal law that generally requires an insured depository institution to identify the communities it serves and to make loans and investments, offer products and provide services, in each case designed to meet the credit needs of these communities. The CRA also requires an institution to maintain comprehensive records of CRA activities to demonstrate how it is meeting the credit needs of communities. These records are subject to periodic examination by the responsible federal banking agency of the institution. Based on these examinations, the agency rates the institution’s compliance with CRA as “Outstanding,” “Satisfactory,” “Needs to Improve” or “Substantial Noncompliance.” The CRA requires the agency to take into account the record of an institution in meeting the credit needs of the entire communities served, including low- and moderate- income neighborhoods, in determining such rating. Failure of an institution to receive at least a “Satisfactory” rating could inhibit the institution or its holding company from undertaking certain activities, including acquisitions. The Bank is currently designated as a Limited Purpose bank under the CRA and therefore is generally evaluated on the basis of its community development activity in the geographies in which its physical facilities are located. The Bank received a CRA rating of “Outstanding” as of its most recent CRA examination.
On May 20, 2020, the OCC issued a final rule to revise its regulations governing the CRA. Among other things the final rule requires a bank, including a Limited Purpose bank, that receives 50 percent or more of its retail domestic deposits from outside the geographies in which its physical facilities are located to designate additional assessment areas beyond those geographies beginning in 2023. We are continuing to evaluate the impact of the final rule on the Bank.
The FDIA prohibits insured banks from accepting brokered deposits or offering interest rates on any deposits significantly higher than the prevailing rate in the bank’s normal market area or nationally (depending upon where the deposits are solicited) unless it is “well-capitalized,” or it is “adequately capitalized” and receives a waiver from the FDIC. A bank that is “adequately capitalized” and that accepts brokered deposits under a waiver from the FDIC may not pay an interest rate on any deposit in excess of 75 basis points over certain prevailing market rates. There are no such restrictions under the FDIA on a bank that is “well-capitalized.” Further, “undercapitalized” institutions are subject to growth limitations. At December 31, 2020, the Bank met or exceeded all applicable requirements to be deemed well-capitalized for purposes of the FDIA. An inability to accept brokered deposits in the future could materially adversely impact our funding costs and liquidity.
On December 15, 2020, the FDIC issued a final rule to revise and clarify its framework for classifying deposits as brokered deposits, including the standards for determining whether a person is a “deposit broker” and satisfies the “primary purpose” exemption from that definition. We do not believe the final rule will have a material impact on the Bank.
Deposit Insurance
The FDIA requires the Bank to pay deposit insurance assessments. Deposit insurance assessments are affected by the minimum reserve ratio with respect to the federal Deposit Insurance Fund (the “DIF”). The Dodd-Frank Act increased the minimum reserve ratio with respect to the DIF to 1.35% and removed the statutory cap on the reserve ratio. The FDIC subsequently adopted a designated ratio of 2% and may increase that ratio in the future. Under the FDIC’s current deposit insurance assessment methodology, the Bank is required to pay deposit insurance assessments based on its average consolidated total assets, less average tangible equity, and various other regulatory factors included in an FDIC assessment scorecard.
The FDIA creates a depositor preference regime for the resolution of all insured depository institutions, including the Bank. If any such institution is placed into receivership, the FDIC will pay (out of the remaining net assets of the failed institution and only to the extent of such assets) first secured creditors (to the extent of their security), second the administrative expenses of the receivership, third all deposits liabilities (both insured and uninsured), fourth any other general or senior liabilities, fifth any obligations subordinated to depositors or general creditors, and finally any remaining net assets to shareholders in that capacity.
Resolution Planning
Under FDIC regulations,an insured depository institution with $50 billion or more in total assets is required annually to submit to the FDIC a plan for the institution’s resolution in the event of its failure. The plan is designed to enable the FDIC, if appointed receiver for the institution, to resolve the institution under sections 11 and 13 of the FDIA in a manner that ensures that its depositors receive access to their insured deposits within one business day of the institution's failure (two business days if the failure occurs on a day other than Friday), maximizes the net present value return from the sale or disposition of the institution’s assets, and minimizes the amount of any loss realized by the creditors in the resolution. The resolution plan requirement is intended to ensure that the FDIC has access to all of the material information it needs to resolve a large insured depository institution efficiently in the event of its failure. On April 16, 2019, the FDIC sought comment on revisions to the resolution plan requirement, including its applicability, and announced that no institution will be required to submit a resolution plan until the agency has finalized such revisions. On January 19, 2021, the FDIC announced that it will resume requiring resolution plan submissions for insured depository institutions with $100 billion or more in total assets. Institutions with less than $100 billion in total assets, including the Bank, continue to have the resolution plan requirement suspended.
Heightened Standards for Risk Management Governance
The OCC’s Heightened Standards establish guidelines for the governance and risk management practices of large OCC-regulated institutions, including the Bank. These Heightened Standards require covered banks to establish and adhere to a written governance framework in order to manage and control their risk-taking activities, provide standards for covered banks’ boards of directors to oversee the risk governance framework, and describe the appropriate risk management roles and responsibilities of front line units, independent risk management, and internal audit functions. The Bank believes it complies with the Heightened Standards.
Consumer Financial Services Regulation
The relationship between us and our U.S. customers is regulated under federal and state consumer protection laws. Federal laws include the Truth in Lending Act, the Equal Credit Opportunity Act, HOLA, the Fair Credit Reporting Act (the “FCRA”), the Gramm-Leach-Bliley Act (the “GLBA”), the CARD Act and the Dodd-Frank Act. These and other federal laws, among other things, require disclosures of the cost of credit, provide substantive consumer rights, prohibit discrimination in credit transactions, regulate the use of credit report information, provide financial privacy protections, require safe and sound banking operations, prohibit unfair, deceptive and abusive practices, restrict our ability to raise interest rates on certain credit card balances, and subject us to substantial regulatory oversight. State and, in some cases, local laws also may regulate the relationship between us and our U.S. customers in these areas, as well as in the areas of collection practices, and may provide additional consumer protections. Moreover, we are subject to the Servicemembers Civil Relief Act, which protects persons called to active military service and their dependents from undue hardship resulting from their military service, and the Military Lending Act (the “MLA”), which extends specific protections if an accountholder, at the time of account opening, is a covered active duty member of the military or certain family members thereof. The Servicemembers Civil Relief Act applies to all debts incurred prior to the commencement of active duty (including credit card and other open-end debt) and limits the amount of interest, including service and renewal charges and any other fees or charges (other than bona fide insurance) that are related to the obligation or liability. The MLA applies to certain consumer loans, including credit extended pursuant to a credit card account, and extends specific protections if an accountholder, at the time of account opening, is a covered active duty member of the military or certain family members thereof (collectively, the “covered borrowers”). These protections include, but are not limited to: a limit on the military annual percentage rate that can be charged to 36%, delivery of certain required disclosures and a prohibition on mandatory arbitration agreements. If we were to extend credit to a covered borrower without complying with certain MLA provisions, the credit card agreement could be void from its inception.
Violations of applicable consumer protection laws can result in significant potential liability from litigation brought by customers, including actual damages, restitution and attorneys’ fees. Federal banking regulators, as well as state attorneys general and other state and local consumer protection agencies, also may seek to enforce consumer protection requirements and obtain these and other remedies, including civil money penalties and fines.
The CARD Act was enacted in 2009 and most of the requirements became effective in 2010. The CARD Act made numerous amendments to the Truth in Lending Act, requiring us to make significant changes to many of our business practices, including marketing, underwriting, pricing and billing. The CARD Act’s restrictions on our ability to increase interest rates on existing balances to respond to market conditions and credit risk ultimately limits our ability to extend credit to new customers and provide additional credit to current customers. Other CARD Act restrictions, such as limitations on late fees, have resulted and will continue to result in reduced interest income and loan fee income.
The FCRA regulates our use of credit reports and the reporting of information to credit reporting agencies, and also provides a standard for lenders to share information with affiliates and certain third parties and to provide firm offers of credit to consumers. The FCRA also places further restrictions on the use of information shared between affiliates for marketing purposes, requires the provision of disclosures to consumers when risk-based pricing is used in a credit decision, and requires safeguards to help protect consumers from identity theft.
Under HOLA, the Bank is prohibited from engaging in certain tying or reciprocity arrangements with its customers. In general, the Bank may not extend credit, lease or sell property, or furnish any services or fix or vary the consideration for these on the condition that: (i) the customer obtain or provide some additional credit, property, or services from or to the Bank or Synchrony or their subsidiaries or (ii) the customer may not obtain some other credit, property, or services from a competitor, except in each case to the extent reasonable conditions are imposed to assure the soundness of the credit extended. Certain arrangements are permissible. For example, the Bank may offer more favorable terms if a customer obtains two or more traditional bank products.
The Dodd-Frank Act established the CFPB, which regulates consumer financial products and services and certain financial services providers. The CFPB is authorized to prevent “unfair, deceptive or abusive acts or practices” and ensure consistent enforcement of laws so that all consumers have access to markets for consumer financial products and services that are fair, transparent and competitive. The CFPB has rulemaking and interpretive authority under the Dodd-Frank Act and other federal consumer financial services laws, as well as broad supervisory, examination and enforcement authority over large providers of consumer financial products and services, such as us. In addition, the CFPB has an online complaint system that allows consumers to log complaints with respect to various consumer finance products, including the products we offer. The system could inform future agency decisions with respect to regulatory, enforcement or examination focus. There continues to be uncertainty as to how the CFPB’s strategies and priorities will impact our business and our results of operations going forward. See “Regulation—Risk Factors Relating to Regulation—There continues to be uncertainty as to how the Consumer Financial Protection Bureau’s actions will impact our business; the agency’s actions have had and may continue to have an adverse impact on our business.”
Privacy, Information Security, and Data Protection
We are subject to various privacy, information security and data protection laws, including requirements concerning security breach notification. For example, in the United States, certain of our businesses are subject to the GLBA and implementing regulations and guidance. Among other things, the GLBA: (i) imposes certain limitations on the ability of financial institutions to share consumers’ nonpublic personal information with nonaffiliated third parties, (ii) requires that financial institutions provide certain disclosures to consumers about their information collection, sharing and security practices and affords customers the right to “opt out” of the institution’s disclosure of their personal financial information to nonaffiliated third parties (with certain exceptions) and (iii) requires financial institutions to develop, implement and maintain a written comprehensive information security program containing safeguards that are appropriate to the financial institution’s size and complexity, the nature and scope of the financial institution’s activities, the sensitivity of customer information processed by the financial institution as well as plans for responding to data security breaches. Federal and state laws also require us to respond appropriately to data security breaches. Additionally, on December 18, 2020, the federal banking agencies released a notice of proposed rulemaking that would require a banking organization to notify its primary federal regulator within 36 hours of a significant cybersecurity incident. We have a program to comply with applicable privacy, information security, and data protection requirements imposed by federal, state, and foreign laws, including the GLBA. However, if we experience a significant cybersecurity incident or our regulators deemed our information security controls to be inadequate, we could be subject to supervisory criticism or penalties, and/or suffer reputational harm.
In 2018, the State of California enacted the California Consumer Privacy Act (“CCPA”). The CCPA requires covered businesses to comply with requirements that give consumers the right to know what information is being collected from them and whether such information is sold or disclosed to third parties. The statute also allows consumers to access, delete, and prevent the sale of personal information that has been collected by covered businesses in certain circumstances. The CCPA does not apply to personal information collected, processed, sold, or disclosed pursuant to the GLBA or the California Financial Information Privacy Act. We believe we are a covered business under the CCPA. The CCPA became effective on January 1, 2020. While we are continuing to evaluate the potential impact of the CCPA on our business, the CCPA could increase our costs.
See also “Regulation—Risk Factors Relating to Regulation—Regulations relating to privacy, information security and data protection could increase our costs, affect or limit how we collect and use personal information and adversely affect our business opportunities.”
Money Laundering and Terrorist Financing Prevention Program
We maintain an enterprise-wide program designed to enable us to comply with all applicable anti-money laundering and anti-terrorism financing laws and regulations, including, but not limited to, the Bank Secrecy Act and the Patriot Act. This program includes policies, procedures, processes and other internal controls designed to identify, monitor, manage and mitigate the risk of money laundering or terrorist financing posed by our products, services, customers and geographic locale. These controls include procedures and processes to detect and report suspicious transactions, perform customer due diligence, respond to requests from law enforcement, identify and verify a legal entity customer’s beneficial owner(s) at the time a new account is opened and to understand the nature and purpose of the customer relationship, and meet all recordkeeping and reporting requirements related to particular transactions involving currency or monetary instruments. The program is coordinated by a compliance officer, undergoes an annual independent audit to assess its effectiveness, and requires training of employees.
See “Regulation—Risk Factors Relating to Regulation—Failure to comply with anti-money laundering and anti-terrorism financing laws could have significant adverse consequences for us.”
Sanctions Programs
We have a program designed to comply with applicable economic and trade sanctions programs, including those administered and enforced by OFAC. These sanctions are usually targeted against foreign countries, terrorists, international narcotics traffickers and those believed to be involved in the proliferation of weapons of mass destruction. These regulations generally require either the blocking of accounts or other property of specified entities or individuals, but they may also require the rejection of certain transactions involving specified entities or individuals. We maintain policies, procedures and other internal controls designed to comply with these sanctions programs.
Recent Legislative and Regulatory Developments
Under a December 2018 final rule, banking organizations may elect to phase in the regulatory capital effects of the CECL model, the new accounting standard for credit losses, over three years. On March 27, 2020, the CARES Act was signed into law, and includes a provision that permits financial institutions to defer temporarily the use of CECL. In a related action, the joint federal bank regulatory agencies issued an interim final rule effective March 31, 2020, that allows banking organizations that implemented CECL in 2020 to elect to mitigate the effects of the CECL accounting standard on their regulatory capital for two years. This two-year delay is in addition to the three-year transition period that the agencies had already made available in December 2018. Synchrony and the Bank have elected to defer the regulatory capital effects of CECL in accordance with the interim final rule, and not to apply the deferral of CECL available under the CARES Act. As a result, the effects of CECL on Synchrony’s and the Bank’s regulatory capital will be delayed through the year 2021, after which the effects will be phased-in over a three-year period from January 1, 2022 through December 31, 2024. Under the March 31, 2020 interim final rule, the amount of adjustments to regulatory capital deferred until the phase-in period includes both the initial impact of a banking organization’s adoption of CECL at January 1, 2020, and 25% of subsequent changes in its allowance for credit losses during each quarter of the two-year period ended December 31, 2021.
The CARES Act also includes a provision that permits a financial institution to elect to suspend temporarily troubled debt restructuring accounting under ASC Subtopic 310-40 in certain circumstances (“section 4013”). To be eligible under section 4013 of the CARES Act, as amended by the Consolidated Appropriations Act, 2021, a loan modification must be (1) related to COVID-19; (2) executed on a loan that was not more than 30 days past due as of December 31, 2019; and (3) executed between March 1, 2020, and the earlier of (A) 60 days after the date of termination of the National Emergency or (B) January 1, 2022. In response to this section of the CARES Act, the federal banking agencies, in consultation with the Financial Accounting Standards Board, issued a revised interagency statement on April 7, 2020, that confirms that for loans not subject to section 4013, short-term modifications made on a good faith basis in response to COVID-19 are not considered troubled debt restructurings under ASC Subtopic 310-40. Modifications covered under the interagency statement include delays in payment that are insignificant or short-term (e.g., up to six months) modifications such as payment deferrals, fee waivers, and extensions of repayment terms to borrowers that were current prior to any relief. Borrowers considered current are those that are less than 30 days past due on their contractual payments at the time a modification program is implemented.
The CARES Act includes a range of other provisions designed to support the U.S. economy and mitigate the impact of the COVID-19 pandemic on financial institutions and their customers, including through the authorization of various programs and measures to be implemented by the U.S. Department of the Treasury, the Small Business Administration, and the Federal Reserve Board. Further, in response to the COVID-19 pandemic, the Federal Reserve Board implemented a number of facilities to provide emergency liquidity to various segments of the U.S. economy and financial markets. Additionally, on March 15, 2020, in response to the COVID-19 pandemic, the Federal Reserve Board reduced reserve requirements for insured depository institutions to zero percent.
The National Defense Authorization Act for Fiscal Year 2020, which became law on December 20, 2020, made a number of changes to anti-money laundering laws, including increasing penalties for anti-money laundering violations.
On January 19, 2021, the Federal Reserve Board issued a final rule to subject covered savings and loan holding companies with average total consolidated assets of $100 billion or more to formal capital plan submission requirements and to the stress capital buffer in lieu of the 2.5% capital conservation buffer. The stress capital buffer is calculated as the amount of loss of common equity Tier 1 capital incurred by the company in the severely adverse scenario of the most recent supervisory stress test exercise, assuming certain continued payments on capital instruments, and is subject to a floor of 2.5% of risk-weighted assets. If in the future Synchrony has average total consolidated assets of $100 billion or more based on a four quarter average, it will become subject to formal capital plan submission requirements and the stress capital buffer, and as a result, its capital requirements may increase and its ability to pay dividends, make other capital distributions, or redeem or repurchase its stock may be impacted.
Risk Factors Relating to Regulation
____________________________________________________________________________________________
The following discussion of risk factors contains “forward-looking statements,” as discussed in “Cautionary Note Regarding Forward-Looking Statements.” These risk factors may be important to understanding any statement in this Annual Report on Form 10-K or elsewhere. The following information should be read in conjunction with “Management’s Discussion and Analysis of Financial Condition and Results of Operations” (MD&A), the consolidated financial statements and related notes in “Consolidated Financial Statements and Supplementary Data” and “Risk Factors Relating to Our Business” of this Form 10-K Report.
Regulatory Risks
Our business is subject to government regulation, supervision, examination and enforcement, which could adversely affect our business, results of operations and financial condition.
Our business, including our relationships with our customers, is subject to regulation, supervision and examination under U.S. federal, state and foreign laws and regulations. These laws and regulations cover all aspects of our business, including lending and collection practices, treatment of our customers, safeguarding deposits, customer privacy and information security, capital structure, liquidity, dividends and other capital distributions, transactions with affiliates and conduct and qualifications of personnel. As a savings and loan holding company and financial holding company, Synchrony is subject to regulation, supervision and examination by the Federal Reserve Board. As a large provider of consumer financial services, we are also subject to regulation, supervision and examination by the CFPB. The Bank is a federally chartered savings association. As such, the Bank is subject to regulation, supervision and examination by the OCC, which is its primary regulator, and by the CFPB. In addition, the Bank, as an insured depository institution, is supervised by the FDIC. We, including the Bank, are regularly reviewed and examined by our respective regulators, which results in supervisory comments and directions relating to many aspects of our business that require response and attention. See “Regulation” for more information about the regulations applicable to us.
Banking laws and regulations are primarily intended to protect federally insured deposits, the DIF and the banking system as a whole, and not intended to protect our stockholders, noteholders or creditors. If we fail to satisfy applicable laws and regulations, our respective regulators have broad discretion to enforce those laws and regulations, including with respect to the operation of our business, required capital levels, payment of dividends and other capital distributions, engaging in certain activities and making acquisitions and investments. Our regulators also have broad discretion with respect to the enforcement of applicable laws and regulations, including through enforcement actions that could subject us to civil money penalties, customer remediation programs, increased compliance costs, and limits or prohibitions on our ability to offer certain products and services or to engage in certain activities. In addition, to the extent we undertake actions requiring regulatory approval or non-objection, our regulators may make their approval or non-objection subject to conditions or restrictions that could have a material adverse effect on our business, results of operations and financial condition. Any other actions taken by our regulators could also have a material adverse impact on our business, reputation and brand, results of operations and financial condition. Moreover, some of our competitors are subject to different, and in some cases less restrictive, statutory and/or regulatory regimes, which may have the effect of providing them with a competitive advantage over us.
New laws, regulations, policies, or practical changes in enforcement of existing laws, regulations or policies applicable to our business, or our own reexamination of our current practices, could adversely impact our profitability, limit our ability to continue existing or pursue new business activities, require us to change certain of our business practices or alter our relationships with customers, affect retention of our key personnel, or expose us to additional costs (including increased compliance costs and/or customer remediation). These changes may also require us to invest significant management attention and resources to make any necessary changes and could adversely affect our business, results of operations and financial condition. For example, the CFPB has broad authority over our business. See “—There continues to be uncertainty as to how the Consumer Financial Protection Bureau’s actions will impact our business; the agency’s actions have had and may continue to have an adverse impact on our business.”
We are also subject to potential enforcement and other actions that may be brought by state attorneys general or other state enforcement authorities and other governmental agencies. Any such actions could subject us to civil money penalties and fines, customer remediation programs and increased compliance costs, as well as damage our reputation and brand and limit or prohibit our ability to offer certain products and services or engage in certain business practices. For a discussion of risks related to actions or proceedings brought by regulatory agencies, see “—Risk Factors Relating to Our Business—Litigation, regulatory actions and compliance issues could subject us to significant fines, penalties, judgments, remediation costs and/or requirements resulting in increased expenses.”
The Dodd-Frank Act and other legislative and regulatory developments have had, and may continue to have, a significant impact on our business, financial condition and results of operations.
The Dodd-Frank Act and regulations promulgated thereunder have had, and may continue to have, a significant adverse impact on our business, results of operations and financial condition. For example, the Dodd-Frank Act and related regulations restrict certain business practices, impose more stringent capital, liquidity and leverage ratio requirements, as well as additional costs (including increased compliance costs and increased costs of funding raised through the issuance of asset-backed securities), on us, and impact the value of our assets. In addition, the Dodd-Frank Act requires us to serve as a source of financial strength for any insured depository institution we control, such as the Bank. Such support may be required by the Federal Reserve Board at times when we might otherwise determine not to provide it or when doing so is not otherwise in the interest of Synchrony or its stockholders, noteholders or creditors. We describe certain provisions of the Dodd-Frank Act and other legislative and regulatory developments in “Regulation—Regulation Relating to Our Business.”
The EGRRCPA and related regulatory reform initiatives, including the Tailoring Rules, have modified many of the Dodd-Frank Act’s requirements that apply to us. While certain aspects of these legislative and regulatory changes reduce regulatory burdens for us, other aspects, including the application of enhanced prudential standards, formal capital plan submission requirements, and the stress capital buffer to large covered savings and loan holding companies, would impose additional requirements and constraints on us if in the future we had average total consolidated assets of $100 billion or more based on a four quarter average, and additional rulemaking may impose new capital requirements and limitations on our ability to pay dividends or redeem or repurchase our stock.
Further, the ongoing implementation of the Dodd-Frank Act, as well as the recent and possible future changes to the regulatory framework applicable to Synchrony and the Bank, and additional rulemaking make it difficult to assess the overall financial impact of the Dodd-Frank Act and related regulatory developments on us and across the industry.
There is ongoing uncertainty as to how the Consumer Financial Protection Bureau’s actions will impact our business; the agency’s actions have had and may continue to have an adverse impact on our business.
The CFPB has broad authority over our business. This includes authority to write regulations under federal consumer financial protection laws and to enforce those laws against and examine large financial institutions, such as us, for compliance. The CFPB is authorized to prevent “unfair, deceptive or abusive acts or practices” through its regulatory, supervisory and enforcement authority. The Federal Reserve Board and the OCC and state government agencies may also invoke their supervisory and enforcement authorities to prevent unfair and deceptive acts or practices. These federal and state agencies are authorized to remediate violations of consumer protection laws in a number of ways, including collecting civil money penalties and fines and providing for customer restitution. The CFPB also engages in consumer financial education, requests data and promotes the availability of financial services to underserved consumers and communities. In addition, the CFPB maintains an online complaint system that allows consumers to log complaints with respect to various consumer finance products, including the products we offer. This system could inform future CFPB decisions with respect to its regulatory, enforcement or examination focus.
There is ongoing uncertainty as to how the CFPB’s strategies and priorities, including in both its examination and enforcement processes, will impact our business and our results of operations going forward. Actions by the CFPB could result in requirements to alter or cease offering affected products and services, including deferred interest products, making them less attractive to consumers and less profitable to us and also restricting our ability to offer them. In addition, since 2013, the Bank has entered into two consent orders with the CFPB - one in 2013 (the "2013 CFPB Consent Order”), which required us to provide remediation to certain customers and to make a number of changes to our CareCredit training, sales, marketing and servicing practices; and another in 2014 (together with the 2013 Consent Order, the "Consent Orders") with respect to a debt cancellation product and sales practices and an unrelated issue that arose from the Bank’s self-identified omission of certain Spanish-speaking customers and customers residing in Puerto Rico from two offers that were made to certain delinquent customers. The Bank’s resolutions with the CFPB do not preclude other regulators or state attorneys general from seeking additional monetary or injunctive relief with respect to CareCredit, and any such relief could have a material adverse effect on our business, results of operations or financial condition.
Although we have committed significant resources to enhancing our compliance programs, changes by the CFPB in regulatory expectations, interpretations or practices or interpretations that are different or stricter than ours or those adopted in the past by other regulators could increase the risk of additional enforcement actions, fines and penalties. In recent years, the CFPB has identified certain areas of concern for consumers, including, for example, deferred interest products, subprime specialist credit card issuers, and unexpected rate increases with respect to variable interest rate products. Actions by the CFPB with respect to these or other areas could result in requirements to alter our products and services that may make them less attractive to consumers or less profitable to us.
Future actions by the CFPB (or other regulators) against us or our competitors that discourage the use of products we offer or suggest to consumers the desirability of other products or services could result in reputational harm and a loss of customers. If the CFPB changes regulations which it adopted in the past or which were adopted in the past by other regulators and transferred to the CFPB by the Dodd-Frank Act, or modifies, through supervision or enforcement, past related regulatory guidance or interprets existing regulations in a different or stricter manner than they have been interpreted in the past by us, the industry or other regulators, our compliance costs and litigation exposure could increase materially. If future regulatory or legislative restrictions or prohibitions are imposed that affect our ability to offer promotional financing, including deferred interest, for certain of our products or require us to make significant changes to our business practices, and we are unable to develop compliant alternatives with acceptable returns, these restrictions or prohibitions could have a material adverse impact on our business, results of operations and financial condition.
The Dodd-Frank Act authorizes state officials to enforce regulations issued by the CFPB and to enforce the Act’s general prohibition against unfair, deceptive or abusive practices. This could make it more difficult than in the past for federal financial regulators to declare state laws that differ from federal standards to be preempted. To the extent that states enact requirements that differ from federal standards or state officials and courts adopt interpretations of federal consumer laws that differ from those adopted by the CFPB, we may be required to alter or cease offering products or services in some jurisdictions, which would increase compliance costs and reduce our ability to offer the same products and services to consumers nationwide, and we may be subject to a higher risk of state enforcement actions.
Failure by Synchrony and the Bank to meet applicable capital adequacy and liquidity requirements could have a material adverse effect on us.
Synchrony and the Bank must meet rules for capital adequacy as discussed in “Regulation—Regulation Relating to Our Business.” As a stand-alone savings and loan holding company, Synchrony is subject to capital requirements similar to those that apply to the Bank.
Synchrony and the Bank may be subject to increasingly stringent capital adequacy standards in the future. For instance, if in the future Synchrony has $100 billion or more in average total consolidated assets based on a four quarter average, Synchrony will become subject to biennial supervisory stress tests, a formal capital plan submission requirement, and the stress capital buffer. See “Regulation—Regulation Relating to Our Business— Savings and Loan Holding Company Regulation—Capital” and “Regulation—Regulation Relating to Our Business— Savings and Loan Holding Company Regulation—Dividends and Stock Repurchases.” While Synchrony had less than $100 billion in average total consolidated assets as of December 31, 2020 and less than $100 billion in total consolidated assets in each of the four quarters ending as of December 31, 2020, its average total consolidated assets have exceeded $100 billion in the past and may exceed such threshold again in future periods. If Synchrony becomes subject to supervisory stress tests, a formal capital plan submission requirement, and/or the stress capital buffer, Synchrony could be subject to additional restrictions on its ability to return capital to shareholders.
Additionally, ASU 2016-13, Financial Instruments-Credit Losses: Measurement of Credit Losses on Financial Instruments, which implements CECL as a new impairment model based on expected credit losses, requires us to recognize all expected credit losses over the life of a loan based on historical experience, current conditions, and reasonable and supportable forecasts. See Note 2. Basis of Presentation and Summary of Significant Accounting Policies — New Accounting Standards, to our consolidated financial statements for additional information related to the new accounting standard for credit losses and its impact to the Company’s allowance for credit losses.
If Synchrony or the Bank fails to meet current or future minimum capital, leverage or other financial requirements, its operations, results of operations and financial condition could be materially adversely affected. Among other things, failure by Synchrony or the Bank to maintain its status as “well capitalized” (or otherwise meet current or future minimum capital, leverage or other financial requirements) could compromise our competitive position and result in restrictions imposed by the Federal Reserve Board or the OCC, including, potentially, on the Bank’s ability to engage in certain activities. These could include restrictions on the Bank’s ability to enter into transactions with affiliates, accept brokered deposits, grow its assets, engage in material transactions, extend credit in certain highly leveraged transactions, amend or change its charter, bylaws or accounting methods, pay interest on its liabilities without regard to regulatory caps on the rates that may be paid on deposits, and pay dividends or repurchase stock. In addition, failure to maintain the well capitalized status of the Bank could result in our having to invest additional capital in the Bank, which could in turn require us to raise additional capital. The market and demand for, and cost of, our asset-backed securities also could be adversely affected by failure to meet current or future capital requirements.
Synchrony must also continue to comply with regulatory requirements related to the maintenance, management, monitoring and reporting of liquidity as discussed in “Regulation—Regulation Relating to Our Business.” Under the Tailoring Rules, enhanced prudential standards with respect to liquidity management apply to covered savings and loan holding companies with $100 billion or more in average total consolidated assets. See “Regulation—Regulation Relating to Our Business—Legislative and Regulatory Developments.” If such requirements apply to us in the future, we cannot predict their effects on us.
We are subject to restrictions that limit our ability to pay dividends and repurchase our common stock; the Bank is subject to restrictions that limit its ability to pay dividends to us, which could limit our ability to pay dividends, repurchase our common stock or make payments on our indebtedness.
We are limited in our ability to pay dividends and repurchase our common stock by the Federal Reserve Board, which has broad authority to review our capital planning and risk management processes, and our current, projected and stressed capital levels, and to object to any capital action that the Federal Reserve Board considers to be unsafe or unsound. In addition, the declaration and amount of any future dividends to holders of our common stock or stock repurchases will be at the discretion of the Board of Directors and will depend on many factors, including the financial condition, earnings, capital and liquidity of us and the Bank, applicable regulatory requirements, corporate law and contractual restrictions and other factors that the Board of Directors deems relevant. If we are unable to pay dividends or repurchase our common stock, it could adversely affect the market price of our common stock and market perceptions of Synchrony Financial. See “Regulation—Regulation Relating to Our Business—Savings and Loan Holding Company Regulation-Dividends and Stock Repurchases.”
We rely significantly on dividends and other distributions and payments from the Bank for liquidity, including to pay our obligations under our indebtedness and other indebtedness as they become due, and federal law limits the amount of dividends and other distributions and payments that the Bank may pay to us. For example, OCC regulations limit the ability of savings associations to make distributions of capital, including payment of dividends, stock redemptions and repurchases, cash-out mergers and other transactions charged to the capital account. The Bank must obtain the OCC’s approval prior to making a capital distribution in certain circumstances, including if the Bank proposes to make a capital distribution when it does not meet certain capital requirements (or will not do so as a result of the proposed capital distribution) or certain net income requirements. In addition, the Bank must file a prior written notice of a planned or declared dividend or other distribution with the Federal Reserve Board. The Federal Reserve Board or the OCC may object to a capital distribution if, among other things, the Bank is, or as a result of such dividend or distribution would be, undercapitalized or the Federal Reserve Board or OCC has safety and soundness concerns. Additional restrictions on bank dividends may apply if the Bank fails the QTL test. The application of these restrictions on the Bank’s ability to pay dividends involves broad discretion on the part of our regulators. Limitations on the Bank’s payments of dividends and other distributions and payments that we receive from the Bank could reduce our liquidity and limit our ability to pay dividends or our obligations under our indebtedness. See “Regulation—Regulation Relating to Our Business—Savings Association Regulation—Dividends and Stock Repurchases” and “—Activities.”
Regulations relating to privacy, information security and data protection could increase our costs, affect or limit how we collect and use personal information and adversely affect our business opportunities.
We are subject to various privacy, information security and data protection laws, including requirements concerning security breach notification, and we could be negatively impacted by them. For example, in the United States, certain of our businesses are subject to the GLBA and implementing regulations and guidance. Among other things, the GLBA: (i) imposes certain limitations on the ability of financial institutions to share consumers’ nonpublic personal information with nonaffiliated third parties, (ii) requires that financial institutions provide certain disclosures to consumers about their information collection, sharing and security practices and affords customers the right to “opt out” of the institution’s disclosure of their personal financial information to nonaffiliated third parties (with certain exceptions) and (iii) requires financial institutions to develop, implement and maintain a written comprehensive information security program containing safeguards that are appropriate to the financial institution’s size and complexity, the nature and scope of the financial institution’s activities, and the sensitivity of customer information processed by the financial institution as well as plans for responding to data security breaches.
Moreover, various United States federal banking regulatory agencies, states and foreign jurisdictions have enacted data security breach notification requirements with varying levels of individual, consumer, regulatory and/or law enforcement notification in certain circumstances in the event of a security breach. Many of these requirements also apply broadly to our partners that accept our cards. In many countries that have yet to impose data security breach notification requirements, regulators have increasingly used the threat of significant sanctions and penalties by data protection authorities to encourage voluntary notification and discourage data security breaches.
Furthermore, legislators and/or regulators in the United States and other countries in which we operate are increasingly adopting or revising privacy, information security and data protection laws that potentially could have a significant impact on our current and planned privacy, data protection and information security-related practices, our collection, use, sharing, retention and safeguarding of consumer and/or employee information, and some of our current or planned business activities. This could also increase our costs of compliance and business operations and could reduce income from certain business initiatives. In the United States, this includes increased privacy-related enforcement activity at the Federal level, by the Federal Trade Commission, as well as at the state level, such as with regard to mobile applications, and state legislation such as the CCPA, which could increase our costs. In the European Union, this includes the General Data Protection Regulation. See “Regulation—Regulation Relating to Our Business—Privacy.”
Compliance with current or future privacy, data protection and information security laws (including those regarding security breach notification and consumer privacy) affecting customer and/or employee data to which we are subject could result in higher compliance and technology costs and could restrict our ability to provide certain products and services (such as products or services that involve us sharing information with third parties or storing sensitive credit card information), which could materially and adversely affect our profitability. Our failure to comply with privacy, data protection and information security laws could result in potentially significant regulatory investigations and government actions, litigation, fines or sanctions, consumer or partner actions and damage to our reputation and our brand, all of which could have a material adverse effect on our business and results of operations.
Our use of third-party vendors and our other ongoing third-party business relationships are subject to increasing regulatory requirements and attention.
We regularly use third-party vendors and subcontractors as part of our business. We also have substantial ongoing business relationships with our partners and other third parties. These types of third-party relationships are subject to increasingly demanding regulatory requirements and attention by our federal bank regulators (the Federal Reserve Board, the OCC and the FDIC) and our consumer financial services regulator (the CFPB). Regulatory guidance requires us to enhance our due diligence, ongoing monitoring and control over our third-party vendors and subcontractors and other ongoing third-party business relationships, including with our partners. In certain cases, we may be required to renegotiate our agreements with these vendors and/or their subcontractors to meet these enhanced requirements, which could increase our costs. We expect that our regulators will hold us responsible for deficiencies in our oversight and control of our third-party relationships and in the performance of the parties with which we have these relationships. As a result, if our regulators conclude that we have not exercised adequate oversight and control over our third-party vendors and subcontractors or other ongoing third-party business relationships or that such third parties have not performed appropriately, we could be subject to enforcement actions, including the imposition of civil money penalties or other administrative or judicial penalties or fines as well as requirements for customer remediation.
Failure to comply with anti-money laundering and anti-terrorism financing laws could have significant adverse consequences for us.
We maintain an enterprise-wide program designed to enable us to comply with all applicable anti-money laundering and anti-terrorism financing laws and regulations, including, but not limited to, the Bank Secrecy Act and the Patriot Act. This program includes policies, procedures, processes and other internal controls designed to identify, monitor, manage and mitigate the risk of money laundering or terrorist financing posed by our products, services, customers and geographic locale. These controls include procedures and processes to detect and report suspicious transactions, perform customer due diligence, respond to requests from law enforcement, identify and verify a legal entity customer’s beneficial owner(s) at the time a new account is opened and to understand the nature and purpose of the customer relationship, and meet all recordkeeping and reporting requirements related to particular transactions involving currency or monetary instruments. We cannot be sure our programs and controls will be effective to ensure our compliance with all applicable anti-money laundering and anti-terrorism financing laws and regulations, and our failure to comply could subject us to significant sanctions, fines, penalties and reputational harm, all of which could have a material adverse effect on our business, results of operations and financial condition.
CONSOLIDATED FINANCIAL STATEMENTS AND SUPPLEMENTARY DATA
Report of Independent Registered Public Accounting Firm
____________________________________________________________________________________________
To the Stockholders and Board of Directors
Synchrony Financial:
Opinion on Internal Control Over Financial Reporting
We have audited Synchrony Financial and subsidiaries' (the Company) internal control over financial reporting as of December 31, 2020, based on criteria established in Internal Control — Integrated Framework (2013) issued by the Committee of Sponsoring Organizations of the Treadway Commission. In our opinion, the Company maintained, in all material respects, effective internal control over financial reporting as of December 31, 2020, based on criteria established in Internal Control — Integrated Framework (2013) issued by the Committee of Sponsoring Organizations of the Treadway Commission.
We also have audited, in accordance with the standards of the Public Company Accounting Oversight Board (United States) (PCAOB), the Consolidated Statements of Financial Position of the Company as of December 31, 2020 and 2019, the related Consolidated Statements of Earnings, Comprehensive Income, Changes in Equity, and Cash Flows for each of the years in the three-year period ended December 31, 2020, and the related notes (collectively, the consolidated financial statements), and our report dated February 11, 2021 expressed an unqualified opinion on those consolidated financial statements.
Basis for Opinion
The Company’s management is responsible for maintaining effective internal control over financial reporting and for its assessment of the effectiveness of internal control over financial reporting, included in the accompanying Report on Management’s Assessment of Internal Control over Financial Reporting. Our responsibility is to express an opinion on the Company’s internal control over financial reporting based on our audit. We are a public accounting firm registered with the PCAOB and are required to be independent with respect to the Company in accordance with the U.S. federal securities laws and the applicable rules and regulations of the Securities and Exchange Commission and the PCAOB.
We conducted our audit in accordance with the standards of the PCAOB. Those standards require that we plan and perform the audit to obtain reasonable assurance about whether effective internal control over financial reporting was maintained in all material respects. Our audit of internal control over financial reporting included obtaining an understanding of internal control over financial reporting, assessing the risk that a material weakness exists, and testing and evaluating the design and operating effectiveness of internal control based on the assessed risk. Our audit also included performing such other procedures as we considered necessary in the circumstances. We believe that our audit provides a reasonable basis for our opinion.
Definition and Limitations of Internal Control Over Financial Reporting
A company’s internal control over financial reporting is a process designed to provide reasonable assurance regarding the reliability of financial reporting and the preparation of financial statements for external purposes in accordance with generally accepted accounting principles. A company’s internal control over financial reporting includes those policies and procedures that (1) pertain to the maintenance of records that, in reasonable detail, accurately and fairly reflect the transactions and dispositions of the assets of the company; (2) provide reasonable assurance that transactions are recorded as necessary to permit preparation of financial statements in accordance with generally accepted accounting principles, and that receipts and expenditures of the company are being made only in accordance with authorizations of management and directors of the company; and (3) provide reasonable assurance regarding prevention or timely detection of unauthorized acquisition, use, or disposition of the company’s assets that could have a material effect on the financial statements.
Because of its inherent limitations, internal control over financial reporting may not prevent or detect misstatements. Also, projections of any evaluation of effectiveness to future periods are subject to the risk that controls may become inadequate because of changes in conditions, or that the degree of compliance with the policies or procedures may deteriorate.
/s/ KPMG LLP
New York, New York
February 11, 2021
Report of Independent Registered Public Accounting Firm
____________________________________________________________________________________________
To the Stockholders and Board of Directors
Synchrony Financial:
Opinion on the Consolidated Financial Statements
We have audited the accompanying Consolidated Statements of Financial Position of Synchrony Financial and subsidiaries (the Company) as of December 31, 2020 and 2019, the related Consolidated Statements of Earnings, Comprehensive Income, Changes in Equity, and Cash Flows for each of the years in the three-year period ended December 31, 2020, and the related notes (collectively, the consolidated financial statements). In our opinion, the consolidated financial statements present fairly, in all material respects, the financial position of the Company as of December 31, 2020 and 2019, and the results of its operations and its cash flows for each of the years in the three-year period ended December 31, 2020, in conformity with U.S. generally accepted accounting principles.
We also have audited, in accordance with the standards of the Public Company Accounting Oversight Board (United States) (PCAOB), the Company’s internal control over financial reporting as of December 31, 2020, based on criteria established in Internal Control — Integrated Framework (2013) issued by the Committee of Sponsoring Organizations of the Treadway Commission, and our report dated February 11, 2021 expressed an unqualified opinion on the effectiveness of the Company’s internal control over financial reporting.
Change in Accounting Principle
As discussed in Note 2 to the consolidated financial statements, the Company has changed its method of accounting for the recognition and measurement of credit losses as of January 1, 2020 due to the adoption of ASC Topic 326, Financial Instruments – Credit Losses.
Basis for Opinion
These consolidated financial statements are the responsibility of the Company’s management. Our responsibility is to express an opinion on these consolidated financial statements based on our audits. We are a public accounting firm registered with the PCAOB and are required to be independent with respect to the Company in accordance with the U.S. federal securities laws and the applicable rules and regulations of the Securities and Exchange Commission and the PCAOB.
We conducted our audits in accordance with the standards of the PCAOB. Those standards require that we plan and perform the audit to obtain reasonable assurance about whether the consolidated financial statements are free of material misstatement, whether due to error or fraud. Our audits included performing procedures to assess the risks of material misstatement of the consolidated financial statements, whether due to error or fraud, and performing procedures that respond to those risks. Such procedures included examining, on a test basis, evidence regarding the amounts and disclosures in the consolidated financial statements. Our audits also included evaluating the accounting principles used and significant estimates made by management, as well as evaluating the overall presentation of the consolidated financial statements. We believe that our audits provide a reasonable basis for our opinion.
Critical Audit Matter
The critical audit matter communicated below is a matter arising from the current period audit of the consolidated financial statements that was communicated or required to be communicated to the audit committee and that: (1) relates to accounts or disclosures that are material to the consolidated financial statements and (2) involved our especially challenging, subjective, or complex judgments. The communication of a critical audit matter does not alter in any way our opinion on the consolidated financial statements, taken as a whole, and we are not, by communicating the critical audit matter below, providing a separate opinion on the critical audit matter or on the accounts or disclosures to which it relates.
Allowance for Credit Losses on Loan Receivables excluding Troubled Debt Restructurings
As discussed in Note 2 to the consolidated financial statements, the Company adopted ASU No. 2016-13, Financial Instruments- Credit Losses (Topic 326), as of January 1, 2020. The total allowance for credit losses (ACL) as of January 1, 2020 was $8,623 million, of which $8,071 million related to the ACL for loan receivables excluding troubled debt restructurings (the January 1, 2020 non-TDR ACL). As discussed in Notes 2 and 4 to the consolidated financial statements, the Company’s total allowance for credit losses as of December 31, 2020 was $10,265 million, of which $9,702 million related to the ACL for loan receivables excluding troubled debt
restructurings (the December 31, 2020 non-TDR ACL). Effective January 1, 2020, losses on loan receivables are estimated and recognized upon origination of the loan, based on expected credit losses for the life of the loan. Expected credit loss estimates for the January 1, 2020 non-TDR ACL and the December 31, 2020 non-TDR ACL involved modeling of loss projections attributable to existing loan balances, considering historical experience, current conditions, and future expectations for pools of loans with similar risk characteristics over the reasonable and supportable forecast period. In estimating the expected credit losses for the January 1, 2020 non-TDR ACL and the December 31, 2020 non-TDR ACL, the Company segmented their loan receivable population into pools of loans with similar risk characteristics at the major retailer and product level. The Company uses an enhanced migration analysis to estimate the likelihood that a loan will progress through the various stages of delinquency, which implicitly considers the payments attributable to the measurement date balance. The model utilizes a macroeconomic forecast, with unemployment claims as the primary macroeconomic variable. After the reasonable and supportable forecast period, the Company reverted to historical loss information at the loan receivables segment level. The historical loss information is derived from a combination of recessionary and non-recessionary performance periods. In determining expected credit losses over the life of the loan balance, the Company utilizes an approach which implicitly considers total expected future payments and applies appropriate allocations to reduce those payments in order to estimate losses pertaining to measurement date loan receivables. The Company also performs a qualitative assessment in addition to model estimates and applies qualitative adjustments as necessary.
We identified the assessment of the January 1, 2020 non-TDR ACL and the December 31, 2020 non-TDR ACL as a critical audit matter. A high degree of auditor effort, including specialized skills and knowledge, and subjective and complex auditor judgment was involved in the assessment of the January 1, 2020 non-TDR ACL and the December 31, 2020 non-TDR ACL due to significant measurement uncertainty. Specifically, the assessment encompassed the evaluation of the January 1, 2020 non-TDR ACL and the December 31, 2020 non-TDR ACL methodologies, including the methods and models used to estimate expected credit losses. The assessment also included an evaluation of the significant assumptions to the January 1, 2020 non-TDR ACL and the December 31, 2020 non-TDR ACL, which included: (1) the segmentation of the loan receivables population with similar risk characteristics, (2) the length of the historical experience, (3) the length of the reasonable and supportable forecast period, (4) the estimated life of the loan, (5) the reversion to historical loss information, and (6) the macroeconomic forecast. The assessment also included an evaluation of the conceptual soundness of the models. In addition, auditor judgment was required to evaluate the sufficiency of the audit evidence obtained.
The following are the primary procedures we performed to address this critical audit matter. We evaluated the design and tested the operating effectiveness of certain internal controls related to the Company’s measurement of the January 1, 2020 non-TDR ACL and December 31, 2020 non-TDR ACL, including controls over the:
•development of the January 1, 2020 non-TDR ACL and the December 31, 2020 non-TDR ACL methodologies
•development of the models
•identification and determination of the significant assumptions
•analysis of the January 1, 2020 non-TDR ACL and the December 31, 2020 non-TDR ACL results, trends, and ratios.
We evaluated the Company’s process to develop the January 1, 2020 non-TDR ACL and the December 31, 2020 non-TDR ACL by testing certain sources of data, factors, and assumptions that the Company used, and considered the relevance and reliability of such data, factors, and assumptions. In addition, we involved credit risk professionals with specialized industry knowledge and experience, who assisted in:
•evaluating the Company’s January 1, 2020 non-TDR and December 31, 2020 non-TDR ACL methodologies for compliance with U.S. generally accepted accounting principles
•assessing the conceptual soundness of the models used by inspecting model documentation to determine whether the models are suitable for intended use
•determining whether the loan portfolio is segmented by similar risk characteristics by comparing to the Company’s business environment and evaluating statistical testing performed
•evaluating the length of the historical experience period by comparing to portfolio performance and evaluating the back-testing and sensitivity testing performed
•evaluating the length of the reasonable and supportable period by comparing to model performance, including backtesting results, the quantitative methodology, and industry practice
•determining whether the estimated life of the loan is appropriate based on empirical analysis performed and industry practice
•evaluating whether the length of the reversion period is appropriate based on empirical analysis
•evaluating whether the reversion method uses a systematic and rational approach
•assessing the historical loss information that is being reverted to by verifying whether the historical loss information captures a through the cycle estimate and evaluating the consistency of the empirical analysis performed based on industry data and established methodology
•assessing the macroeconomic forecast by evaluating the Company’s process for evaluating future expectations of macroeconomic conditions, comparing to portfolio performance, and benchmarking of forecasts.
We also assessed the sufficiency of the audit evidence obtained related to the January 1, 2020 non-TDR ACL and the December 31, 2020 non-TDR ACL by evaluating the cumulative results of the audit procedures and potential bias in the accounting estimates.
/s/ KPMG LLP
We have served as the Company’s auditor since 2013.
New York, New York
February 11, 2021
Synchrony Financial and subsidiaries
Consolidated Statements of Earnings ____________________________________________________________________________________
| | | | | | | | | | | | | | | | | |
For the years ended December 31
($ in millions, except per share data) | 2020 | | 2019 | | 2018 |
| Interest income: | | | | | |
| Interest and fees on loans (Note 4) | $ | 15,950 | | | $ | 18,705 | | | $ | 17,644 | |
| Interest on cash and debt securities | 117 | | | 385 | | | 344 | |
| Total interest income | 16,067 | | | 19,090 | | | 17,988 | |
| Interest expense: | | | | | |
| Interest on deposits | 1,094 | | | 1,566 | | | 1,186 | |
| Interest on borrowings of consolidated securitization entities | 237 | | | 358 | | | 344 | |
| Interest on senior unsecured notes | 334 | | | 367 | | | 340 | |
| | | | | |
| Total interest expense | 1,665 | | | 2,291 | | | 1,870 | |
| Net interest income | 14,402 | | | 16,799 | | | 16,118 | |
| Retailer share arrangements | (3,645) | | | (3,858) | | | (3,099) | |
| | | | | |
| Provision for credit losses (Note 4) | 5,310 | | | 4,180 | | | 5,545 | |
| Net interest income, after retailer share arrangements and provision for credit losses | 5,447 | | | 8,761 | | | 7,474 | |
| Other income: | | | | | |
| Interchange revenue | 652 | | | 748 | | | 710 | |
| Debt cancellation fees | 278 | | | 265 | | | 267 | |
| Loyalty programs | (649) | | | (743) | | | (751) | |
| Other | 124 | | | 101 | | | 39 | |
| Total other income | 405 | | | 371 | | | 265 | |
| Other expense: | | | | | |
| Employee costs | 1,380 | | | 1,455 | | | 1,427 | |
| Professional fees | 759 | | | 867 | | | 806 | |
| Marketing and business development | 448 | | | 549 | | | 528 | |
| Information processing | 492 | | | 485 | | | 426 | |
| Other | 976 | | | 889 | | | 908 | |
| Total other expense | 4,055 | | | 4,245 | | | 4,095 | |
| Earnings before provision for income taxes | 1,797 | | | 4,887 | | | 3,644 | |
| Provision for income taxes (Note 15) | 412 | | | 1,140 | | | 854 | |
| Net earnings | $ | 1,385 | | | $ | 3,747 | | | $ | 2,790 | |
| Net earnings available to common stockholders | $ | 1,343 | | | $ | 3,747 | | | $ | 2,790 | |
| | | | | |
| Earnings per share | | | | | |
| Basic | $ | 2.28 | | | $ | 5.59 | | | $ | 3.76 | |
| Diluted | $ | 2.27 | | | $ | 5.56 | | | $ | 3.74 | |
| | | | | |
| | | | | |
See accompanying notes to consolidated financial statements.
Synchrony Financial and subsidiaries
Consolidated Statements of Comprehensive Income
____________________________________________________________________________________________
| | | | | | | | | | | | | | | | | |
| For the years ended December 31 ($ in millions) | 2020 | | 2019 | | 2018 |
| | | | | |
| Net earnings | $ | 1,385 | | | $ | 3,747 | | | $ | 2,790 | |
| | | | | |
| Other comprehensive income (loss) | | | | | |
| Debt securities | 26 | | | 36 | | | (13) | |
| Currency translation adjustments | 2 | | | 4 | | | (8) | |
| Employee benefit plans | (21) | | | (23) | | | 23 | |
| Other comprehensive income (loss) | 7 | | | 17 | | | 2 | |
| | | | | |
| Comprehensive income | $ | 1,392 | | | $ | 3,764 | | | $ | 2,792 | |
Amounts presented net of taxes.
See accompanying notes to consolidated financial statements.
Synchrony Financial and subsidiaries
Consolidated Statements of Financial Position
____________________________________________________________________________________________
| | | | | | | | | | | |
| At December 31 ($ in millions) | 2020 | | 2019 |
| | | |
| Assets | | | |
| Cash and equivalents | $ | 11,524 | | | $ | 12,147 | |
| Debt securities (Note 3) | 7,469 | | | 5,911 | |
| Loan receivables: (Notes 4 and 5) | | | |
| Unsecuritized loans held for investment | 56,472 | | | 58,398 | |
| Restricted loans of consolidated securitization entities | 25,395 | | | 28,817 | |
| Total loan receivables | 81,867 | | | 87,215 | |
| Less: Allowance for credit losses | (10,265) | | | (5,602) | |
| Loan receivables, net | 71,602 | | | 81,613 | |
| Loan receivables held for sale (Note 4) | 5 | | | 725 | |
| Goodwill (Note 6) | 1,078 | | | 1,078 | |
| Intangible assets, net (Note 6) | 1,125 | | | 1,265 | |
| Other assets | 3,145 | | | 2,087 | |
| Total assets | $ | 95,948 | | | $ | 104,826 | |
| | | |
| Liabilities and Equity | | | |
| Deposits: (Note 7) | | | |
| Interest-bearing deposit accounts | $ | 62,469 | | | $ | 64,877 | |
| Non-interest-bearing deposit accounts | 313 | | | 277 | |
| Total deposits | 62,782 | | | 65,154 | |
| Borrowings: (Notes 5 and 8) | | | |
| Borrowings of consolidated securitization entities | 7,810 | | | 10,412 | |
| | | |
| Senior unsecured notes | 7,965 | | | 9,454 | |
| Total borrowings | 15,775 | | | 19,866 | |
| Accrued expenses and other liabilities | 4,690 | | | 4,718 | |
| Total liabilities | $ | 83,247 | | | $ | 89,738 | |
| | | |
| Equity: | | | |
Preferred stock, par share value $0.001 per share; 750,000 shares authorized; 750,000 shares issued and outstanding at both December 31, 2020 and 2019 and aggregate liquidation preference of $750 at both December 31, 2020 and 2019 | $ | 734 | | | $ | 734 | |
Common stock, par share value $0.001 per share; 4,000,000,000 shares authorized; 833,984,684 shares issued at both December 31, 2020 and 2019; 584,009,550 and 615,925,168 shares outstanding at December 31, 2020 and 2019, respectively | 1 | | | 1 | |
| Additional paid-in capital | 9,570 | | | 9,537 | |
| Retained earnings | 10,621 | | | 12,117 | |
| | | |
| Accumulated other comprehensive income (loss): | | | |
| Debt securities | 25 | | | (1) | |
| Currency translation adjustments | (22) | | | (24) | |
| Employee benefit plans | (54) | | | (33) | |
Treasury stock, at cost; 249,975,134 and 218,059,516 shares at December 31, 2020 and 2019, respectively | (8,174) | | | (7,243) | |
| | | |
| Total equity | 12,701 | | | 15,088 | |
| Total liabilities and equity | $ | 95,948 | | | $ | 104,826 | |
See accompanying notes to consolidated financial statements.
Synchrony Financial and subsidiaries
Consolidated Statements of Changes in Equity
____________________________________________________________________________________________
| | | | | | | | | | | | | | | | | | | | | | | | | | | | | | | | | | | | | | | | | | | | | | | | | | | | | | | |
| Preferred Stock | | Common Stock | | | | | | | | | | | | |
| ($ in millions, shares in thousands) | Shares Issued | | Amount | | Shares Issued | | Amount | | Additional Paid-in Capital | | | | Retained Earnings | | Accumulated Other Comprehensive Income (Loss) | | Treasury Stock | | Total Equity |
Balance at January 1, 2018 | — | | | $ | — | | | 833,985 | | | $ | 1 | | | $ | 9,445 | | | | | $ | 6,809 | | | $ | (64) | | | $ | (1,957) | | | $ | 14,234 | |
| | | | | | | | | | | | | | | | | | | |
| Net earnings | — | | | — | | | — | | | — | | | — | | | | | 2,790 | | | — | | | — | | | 2,790 | |
| Other comprehensive income | — | | | — | | | — | | | — | | | — | | | | | — | | | 2 | | | — | | | 2 | |
| | | | | | | | | | | | | | | | | | | |
| | | | | | | | | | | | | | | | | | | |
| Purchases of treasury stock | — | | | — | | | — | | | — | | | — | | | | | — | | | — | | | (1,868) | | | (1,868) | |
| Stock-based compensation | — | | | — | | | — | | | — | | | 37 | | | | | (82) | | | — | | | 96 | | | 51 | |
Dividends - common stock ($0.72 per share) | — | | | — | | | — | | | — | | | — | | | | | (534) | | | — | | | — | | | (534) | |
| Other | — | | | — | | | — | | | — | | | — | | | | | 3 | | | — | | | — | | | 3 | |
Balance at December 31, 2018 | — | | | $ | — | | | 833,985 | | | $ | 1 | | | $ | 9,482 | | | | | $ | 8,986 | | | $ | (62) | | | $ | (3,729) | | | $ | 14,678 | |
| | | | | | | | | | | | | | | | | | | |
Balance at January 1, 2019 | — | | | $ | — | | | 833,985 | | | $ | 1 | | | $ | 9,482 | | | | | $ | 8,986 | | | $ | (62) | | | $ | (3,729) | | | $ | 14,678 | |
| | | | | | | | | | | | | | | | | | | |
| Net earnings | — | | | — | | | — | | | — | | | — | | | | | 3,747 | | | — | | | — | | | 3,747 | |
| Other comprehensive income | — | | | — | | | — | | | — | | | — | | | | | — | | | 17 | | | — | | | 17 | |
| Issuance of preferred stock | 750 | | | 734 | | | — | | | — | | | — | | | | | — | | | — | | | — | | | 734 | |
| | | | | | | | | | | | | | | | | | | |
| | | | | | | | | | | | | | | | | | | |
| Purchases of treasury stock | — | | | — | | | — | | | — | | | — | | | | | — | | | — | | | (3,618) | | | (3,618) | |
| Stock-based compensation | — | | | — | | | — | | | — | | | 55 | | | | | (48) | | | — | | | 104 | | | 111 | |
Dividends - common stock ($0.86 per share) | — | | | — | | | — | | | — | | | — | | | | | (581) | | | — | | | — | | | (581) | |
| Other | — | | | — | | | — | | | — | | | — | | | | | 13 | | | (13) | | | — | | | — | |
Balance at December 31, 2019 | 750 | | | $ | 734 | | | 833,985 | | | $ | 1 | | | $ | 9,537 | | | | | $ | 12,117 | | | $ | (58) | | | $ | (7,243) | | | $ | 15,088 | |
| | | | | | | | | | | | | | | | | | | |
Balance at January 1, 2020 | 750 | | | $ | 734 | | | 833,985 | | | $ | 1 | | | $ | 9,537 | | | | | $ | 12,117 | | | $ | (58) | | | $ | (7,243) | | | $ | 15,088 | |
| | | | | | | | | | | | | | | | | | | |
| Cumulative effect of change in accounting principle | — | | | — | | | — | | | — | | | — | | | | | (2,276) | | | — | | | — | | | (2,276) | |
| Adjusted balance, beginning of period | 750 | | | 734 | | | 833,985 | | | 1 | | | 9,537 | | | | | 9,841 | | | (58) | | | (7,243) | | | 12,812 | |
| Net earnings | — | | | — | | | — | | | — | | | — | | | | | 1,385 | | | — | | | — | | | 1,385 | |
| Other comprehensive income | — | | | — | | | — | | | — | | | — | | | | | — | | | 7 | | | — | | | 7 | |
| | | | | | | | | | | | | | | | | | | |
| Purchases of treasury stock | — | | | — | | | — | | | — | | | — | | | | | — | | | — | | | (985) | | | (985) | |
| Stock-based compensation | — | | | — | | | — | | | — | | | 33 | | | | | (43) | | | — | | | 54 | | | 44 | |
Dividends - preferred stock ($56.40 per share) | — | | | — | | | — | | | — | | | — | | | | | (42) | | | — | | | — | | | (42) | |
Dividends - common stock ($0.88 per share) | — | | | — | | | — | | | — | | | — | | | | | (520) | | | — | | | — | | | (520) | |
| Other | — | | | — | | | — | | | — | | | — | | | | | — | | | — | | | — | | | — | |
Balance at December 31, 2020 | 750 | | | $ | 734 | | | 833,985 | | | $ | 1 | | | $ | 9,570 | | | | | $ | 10,621 | | | $ | (51) | | | $ | (8,174) | | | $ | 12,701 | |
See accompanying notes to consolidated financial statements.
Synchrony Financial and subsidiaries
Consolidated Statements of Cash Flows
____________________________________________________________________________________________
| | | | | | | | | | | | | | | | | |
| For the years ended December 31 ($ in millions) | 2020 | | 2019 | | 2018 |
| Cash flows - operating activities | | | | | |
| Net earnings | $ | 1,385 | | | $ | 3,747 | | | $ | 2,790 | |
| Adjustments to reconcile net earnings to cash provided from operating activities | | | | | |
| Provision for credit losses | 5,310 | | | 4,180 | | | 5,545 | |
| Deferred income taxes | (602) | | | 23 | | | (53) | |
| Depreciation and amortization | 383 | | | 367 | | | 302 | |
| (Increase) decrease in interest and fees receivable | 339 | | | (391) | | | (280) | |
| (Increase) decrease in other assets | 19 | | | 93 | | | 81 | |
| Increase (decrease) in accrued expenses and other liabilities | (67) | | | 363 | | | 356 | |
| All other operating activities | 720 | | | 608 | | | 601 | |
| Cash provided from (used for) operating activities | 7,487 | | | 8,990 | | | 9,342 | |
| | | | | |
| Cash flows - investing activities | | | | | |
| Maturity and sales of debt securities | 8,383 | | | 8,085 | | | 5,668 | |
| Purchases of debt securities | (9,913) | | | (7,856) | | | (7,271) | |
| Acquisition of loan receivables | — | | | (72) | | | (8,183) | |
| | | | | |
| | | | | |
| Proceeds from sale of loan receivables | 709 | | | 8,203 | | | — | |
| Net (increase) decrease in loan receivables, including held for sale | 713 | | | (8,033) | | | (8,448) | |
| All other investing activities | (390) | | | (588) | | | (802) | |
| Cash provided from (used for) investing activities | (498) | | | (261) | | | (19,036) | |
| | | | | |
| Cash flows - financing activities | | | | | |
| Borrowings of consolidated securitization entities | | | | | |
| Proceeds from issuance of securitized debt | 675 | | | 3,345 | | | 5,093 | |
| Maturities and repayment of securitized debt | (3,283) | | | (7,377) | | | (3,157) | |
| | | | | |
| Senior unsecured notes | | | | | |
| Proceeds from issuance of senior unsecured notes | — | | | 1,985 | | | 1,244 | |
| Maturities and repayment of senior unsecured notes | (1,500) | | | (2,100) | | | — | |
| | | | | |
| Dividends paid on preferred stock | (42) | | | — | | | — | |
| Proceeds from issuance of preferred stock | — | | | 734 | | | — | |
| | | | | |
| | | | | |
| | | | | |
| | | | | |
| Net increase (decrease) in deposits | (2,369) | | | 1,117 | | | 7,509 | |
| Purchases of treasury stock | (985) | | | (3,618) | | | (1,868) | |
| Dividends paid on common stock | (520) | | | (581) | | | (534) | |
| | | | | |
| | | | | |
| All other financing activities | (7) | | | 37 | | | (34) | |
| Cash provided from (used for) financing activities | (8,031) | | | (6,458) | | | 8,253 | |
| | | | | |
| Increase (decrease) in cash and equivalents, including restricted amounts | (1,042) | | | 2,271 | | | (1,441) | |
| Cash and equivalents, including restricted amounts, at beginning of year | 12,647 | | | 10,376 | | | 11,817 | |
| Cash and equivalents at end of year: | | | | | |
| Cash and equivalents | 11,524 | | | 12,147 | | | 9,396 | |
| Restricted cash and equivalents included in other assets | 81 | | | 500 | | | $ | 980 | |
| Total cash and equivalents, including restricted amounts, at end of year | $ | 11,605 | | | $ | 12,647 | | | $ | 10,376 | |
| | | | | |
| Supplemental disclosure of cash flow information | | | | | |
| Cash paid during the year for interest | $ | (1,691) | | | $ | (2,272) | | | $ | (1,815) | |
| Cash paid during the year for income taxes | $ | (847) | | | $ | (1,017) | | | $ | (772) | |
See accompanying notes to consolidated financial statements.
Synchrony Financial and subsidiaries
Notes to Consolidated Financial Statements
____________________________________________________________________________________________
NOTE 1. BUSINESS DESCRIPTION
Synchrony Financial (the “Company”) provides a range of credit products through financing programs it has established with a diverse group of national and regional retailers, local merchants, manufacturers, buying groups, industry associations and healthcare service providers. We primarily offer private label, Dual Card and general purpose co-branded credit cards, promotional financing and installment lending, and savings products insured by the Federal Deposit Insurance Corporation ("FDIC") through Synchrony Bank (the “Bank”).
References to the “Company,” “we,” “us” and “our” are to Synchrony Financial and its consolidated subsidiaries unless the context otherwise requires.
NOTE 2. BASIS OF PRESENTATION AND SUMMARY OF SIGNIFICANT ACCOUNTING POLICIES
Basis of Presentation
The accompanying consolidated financial statements were prepared in conformity with U.S. generally accepted accounting principles (“GAAP”).
Preparing financial statements in conformity with U.S. GAAP requires us to make estimates based on assumptions about current, and for some estimates, future, economic and market conditions (for example, unemployment, housing, interest rates and market liquidity) which affect reported amounts and related disclosures in our consolidated financial statements. Although our current estimates contemplate current conditions and how we expect them to change in the future, as appropriate, it is reasonably possible that actual conditions could be different than anticipated in those estimates, which could materially affect our results of operations and financial position. Among other effects, such changes could result in incremental losses on loan receivables, future impairments of debt securities, goodwill and intangible assets, increases in reserves for contingencies, establishment of valuation allowances on deferred tax assets and increases in our tax liabilities.
We primarily conduct our operations within the United States and Canada. Substantially all of our revenues are from U.S. customers. The operating activities conducted by our non-U.S. affiliates use the local currency as their functional currency. The effects of translating the financial statements of these non-U.S. affiliates to U.S. dollars are included in equity. Asset and liability accounts are translated at period-end exchange rates, while revenues and expenses are translated at average rates for the respective periods.
Consolidated Basis of Presentation
The Company’s financial statements have been prepared on a consolidated basis. Under this basis of presentation, our financial statements consolidate all of our subsidiaries – i.e., entities in which we have a controlling financial interest, most often because we hold a majority voting interest.
To determine if we hold a controlling financial interest in an entity, we first evaluate if we are required to apply the variable interest entity (“VIE”) model to the entity, otherwise the entity is evaluated under the voting interest model. Where we hold current or potential rights that give us the power to direct the activities of a VIE that most significantly impact the VIE’s economic performance (“power”) combined with a variable interest that gives us the right to receive potentially significant benefits or the obligation to absorb potentially significant losses (“significant economics”), we have a controlling financial interest in that VIE. Rights held by others to remove the party with power over the VIE are not considered unless one party can exercise those rights unilaterally. We consolidate certain securitization entities under the VIE model because we have both power and significant economics. See Note 5. Variable Interest Entities.
We have reclassified certain prior-period amounts to conform to current-period presentation.
New Accounting Standards
Newly Adopted Accounting Standards
In June 2016, the FASB issued ASU 2016-13, Financial Instruments-Credit Losses: Measurement of Credit Losses on Financial Instruments (Topic 326). This ASU replaced the existing incurred loss impairment guidance with a new impairment model known as the Current Expected Credit Loss ("CECL") model, which is based on expected credit losses. The CECL model permits the use of judgment in determining an approach which is most appropriate for the Company, based on their facts and circumstances. The CECL model requires, upon origination of a loan, the recognition of all expected credit losses over the life of the loan balance based on historical experience, current conditions and reasonable and supportable forecasts.
We adopted this guidance on a modified retrospective basis as of January 1, 2020, which resulted in the recognition of the effects of adoption through a cumulative-effect adjustment to retained earnings. As a result of adoption, we incurred an increase of $3.0 billion, to the Company’s allowance for loan losses. This guidance also applies to other financial assets, such as our debt securities, however the adoption did not have an impact on these financial statement line items. The total impact of adoption resulted in a reduction to retained earnings in our Consolidated Statement of Financial Position of $2.3 billion, reflecting the above changes and the recognition of related additional deferred tax assets. Subsequent updates to our estimate of expected credit losses have been recorded through the provision for credit losses in our Consolidated Statement of Earnings.
Segment Reporting
We conduct our operations through a single business segment. Substantially all of our interest and fees on loans and long-lived assets relate to our operations within the United States. Pursuant to FASB Accounting Standards Codification (“ASC”) 280, Segment Reporting, operating segments represent components of an enterprise for which separate financial information is available that is regularly evaluated by the chief operating decision maker in determining how to allocate resources and in assessing performance. The chief operating decision maker uses a variety of measures to assess the performance of the business as a whole, depending on the nature of the activity. Revenue activities are managed through three sales platforms (Retail Card, Payment Solutions and CareCredit). Those platforms are organized by the types of partners we work with to reach our customers, with success principally measured based on revenues, new accounts and other cardholder sales metrics. Detailed profitability information of the nature that could be used to allocate resources and assess the performance and operations for each sales platform individually, however, is not used by our chief operating decision maker. Expense activities, including funding costs, credit losses and operating expenses, are not measured for each platform but instead are managed for the Company as a whole.
Cash and Equivalents
Debt securities, money market instruments and bank deposits with original maturities of three months or less are included in cash and equivalents unless designated as available-for-sale and classified as investment securities. Cash and equivalents at December 31, 2020 primarily included cash and due from banks of $1.4 billion and interest-bearing deposits in other banks of $10.1 billion. Cash and equivalents at December 31, 2019 primarily included cash and due from banks of $1.2 billion and interest-bearing deposits in other banks of $9.6 billion and other short-term investments of $1.3 billion.
Restricted Cash and Equivalents
Restricted cash and equivalents represent cash and equivalents that are not available to us due to restrictions related to its use. In addition, our securitization entities are required to fund segregated accounts that may only be used for certain purposes, including payment of interest and servicing fees and repayment of maturing debt. We include our restricted cash and equivalents in other assets in our Consolidated Statements of Financial Position.
Investment Securities
We report investments in debt securities and equity securities with a readily determinable fair value at fair value. See Note 9. Fair Value Measurements for further information on fair value. Changes in fair value on debt securities, which are classified as available-for-sale, are included in equity, net of applicable taxes. Changes in fair value on equity securities are included in earnings. We regularly review investment securities for impairment using both quantitative and qualitative criteria.
For debt securities, if we do not intend to sell the security, or it is not more likely than not, that we will be required to sell the security before recovery of our amortized cost, we evaluate other qualitative criteria to determine whether we do not expect to recover the amortized cost basis of the security, such as the financial health of, and specific prospects for the issuer, including whether the issuer is in compliance with the terms and covenants of the security. We also evaluate quantitative criteria including determining whether there has been an adverse change in expected future cash flows. If we do not expect to recover the entire amortized cost basis of the security, we consider the debt security to be impaired. If the security is impaired, we determine whether the impairment is the result of a credit loss or other factors. If a credit loss exists, an allowance for credit losses is recorded, with a related charge to earnings, limited by the amount that the fair value of the security is less than its amortized cost. Given the nature of our current portfolio, we perform a qualitative assessment to determine whether any credit loss is warranted. The assessment considers factors such as adverse conditions and payment structure of the securities, history of payment, and market conditions. If we intend to sell the security or it is more likely than not we will be required to sell the debt security before recovery of its amortized cost basis, the security is also considered impaired and we recognize the entire difference between the security’s amortized cost basis and its fair value in earnings.
Realized gains and losses are accounted for on the specific identification method.
Loan Receivables
Loan receivables primarily consist of open-end consumer revolving credit card accounts, closed-end consumer installment loans and open-end commercial revolving credit card accounts. Loan receivables are reported at the amounts due from customers, including unpaid interest and fees, deferred income and costs.
Loan Receivables Held for Sale
Loans purchased or originated with the intent to sell are classified as loan receivables held for sale and carried at the lower of amortized cost or fair value. Loans initially classified as held for investment are transferred to loan receivables held for sale and carried at the lower of amortized cost or fair value once a decision has been made to sell the loans. We continue to recognize interest and fees on these loans on the accrual basis. The fair value of loan receivables held for sale is determined on an aggregate homogeneous portfolio basis.
If a loan is transferred from held for investment to held for sale, any associated allowance for credit loss is reversed, and the loan is transferred to held for sale at amortized cost. If the amortized cost basis of a loan exceeds fair value, a valuation allowance is established for the difference, and the loan is carried at the lower of amortized cost or fair value, any associated allowance for credit loss is reversed, and the loan is transferred to held for sale at amortized cost. If the amortized cost basis of a loan exceeds fair value, a valuation allowance is established for the difference, and the loan is carried at the lower of amortized cost or fair value.
Acquired Loans
To determine the fair value of loans at acquisition, we estimate expected cash flows and discount those cash flows using an observable market rate of interest, when available, adjusted for factors that a market participant would consider in determining fair value. In determining fair value, expected cash flows are adjusted to include prepayment, default rate, and loss severity estimates. The difference between the fair value and the amount contractually due is recorded as a loan discount or premium at acquisition.
Loans acquired that have experienced more-than-insignificant deterioration in credit quality since origination (referred to as “purchased credit deteriorated” or “PCD” assets) are subject to specific guidance upon acquisition. An allowance for PCD assets is added to the purchase price or fair value of the acquired loans to arrive at the amortized cost basis. Subsequent to initial recognition, the accounting for the PCD asset will generally follow the credit loss model described below.
Loans acquired without a more-than-insignificant credit deterioration since origination are measured under the Allowance for Credit Losses described below.
Allowance for Credit Losses
Losses on loan receivables are estimated and recognized upon origination of the loan, based on expected credit losses for the life of the loan balance as of the period end date. Expected credit loss estimates involve modeling loss projections attributable to existing loan balances, considering historical experience, current conditions and future expectations for pools of loans with similar risk characteristics over the reasonable and supportable forecast period. The model utilizes a macroeconomic forecast, with unemployment claims as the primary macroeconomic variable. We also perform a qualitative assessment in addition to model estimates and apply qualitative adjustments as necessary. The reasonable and supportable forecast period is determined primarily based upon an assessment of the current economic outlook, including the effects of COVID-19 and our ability to use available data to accurately forecast losses over time. The reasonable and supportable forecast period used in our estimate of credit losses at December 31, 2020 was 12 months, consistent with the forecast period utilized since adoption of CECL. The Company reassesses the reasonable and supportable forecast period on a quarterly basis. Beyond the reasonable and supportable forecast period, we revert to historical loss information at the loan receivables segment level over a 6-month period, gradually increasing the weight of historical losses by an equal amount each month during the reversion period, and utilize historical loss information thereafter for the remaining life of the portfolio. The historical loss information is derived from a combination of recessionary and non-recessionary performance periods, weighted by the time span of each period. Similar to the reasonable and supportable forecast period, we also reassess the reversion period and historical mean on a quarterly basis, considering any required adjustments for differences in underwriting standards, portfolio mix, and other relevant data shifts over time.
We generally segment our loan receivable population into pools of loans with similar risk characteristics at the major retailer and product level. Consistent with our other assumptions, we regularly review segmentation to determine whether the segmentation pools remain relevant as risk characteristics change.
Our loan receivables generally do not have a stated life. The life of a credit card loan receivable is dependent upon the allocation of payments received, as well as a variety of other factors, including the principal balance, promotional terms, interest charges and fees and overall consumer credit profile and usage pattern. We determine the expected credit losses for credit card loan receivables as of the measurement date by using a combination of migration analysis, and other historical analyses, which implicitly consider the payments attributable to the measurement date balance. To do so, we utilize an approach which implicitly considers total expected future payments and applies appropriate allocations to reduce those payments in order to estimate losses pertaining to measurement date loan receivables. Based on our payments analyses, we also ensure payments from an account do not exceed the measurement date balance.
We evaluate each portfolio quarterly. For credit card receivables, our estimation process includes analysis of historical data, and there is a significant amount of judgment applied in selecting inputs and analyzing the results produced by the models to determine the allowance for credit losses. We use an enhanced migration analysis to estimate the likelihood that a loan will progress through the various stages of delinquency. The enhanced migration analysis considers uncollectible principal, interest and fees reflected in the loan receivables, segmented by credit and business parameters. We use other analyses to estimate expected losses on non-delinquent accounts, which include past performance, bankruptcy activity such as filings, policy changes and loan volumes and amounts. Holistically, for assessing the portfolio credit loss content, we also evaluate portfolio risk management techniques applied to various accounts, historical behavior of different account vintages, account seasoning, economic conditions, recent trends in delinquencies, account collection management, forecasting uncertainties, expectations about the future and a qualitative assessment of the adequacy of the allowance for credit losses. Key factors that impact the accuracy of our historical loss forecast estimates include the models and methodology utilized, credit strategy and trends, and consideration of material changes in our loan portfolio such as changes in growth and portfolio mix. We regularly review our collection experience (including delinquencies and net charge-offs) in determining our allowance for credit losses. We also consider our historical loss experience to date based on actual defaulted loans and overall portfolio indicators including delinquent and non-accrual loans, trends in loan volume and lending terms, credit policies and other observable environmental factors such as unemployment and home price indices. The current and forecasted economic conditions due to the COVID-19 pandemic influenced our current estimate of expected credit losses and led to the increase in the estimate since adoption. Additionally, the estimate of expected credit losses includes expected recoveries of amounts previously charged off and expected to be charged off.
The underlying assumptions, estimates and assessments we use to provide for losses are updated periodically to reflect our view of current and forecasted conditions and are subject to the regulatory examination process, which can result in changes to our assumptions. Changes in such estimates can significantly affect the allowance and provision for credit losses. It is possible that we will experience credit losses that are different from our current estimates. Charge-offs are deducted from the allowance for credit losses when we judge the principal to be uncollectible, and subsequent recoveries are added to the allowance, generally at the time cash is received on a charged-off account.
Delinquent receivables are those that are 30 days or more past due based on their contractual payments. Non-accrual loan receivables are those on which we have stopped accruing interest. We continue to accrue interest until the earlier of the time at which collection of an account becomes doubtful, or the account becomes 180 days past due, with the exception of non-credit card accounts, for which we stop accruing interest in the period that the account becomes 90 days past due.
Troubled debt restructurings (“TDR”) are those loans for which we have granted a concession to a borrower experiencing financial difficulties where we do not receive adequate compensation. TDRs are identified at the point when the borrower enters into a modification program. Under the CARES Act, banks may elect to deem that loan modifications do not result in TDRs if they are (1) related to the novel coronavirus disease (“COVID-19”); (2) executed on a loan that was not more than 30 days past due as of December 31, 2019; and (3) executed between March 1, 2020, and the earlier of (A) 60 days after the date of termination of the National Emergency or (B) January 1, 2022. At December 31, 2020, we have not made such an election. Additionally, other short-term modifications made on a good faith basis in response to COVID-19 are not considered TDRs under ASC Subtopic 310-40. This includes delays in payment that are insignificant or short-term (e.g., up to six months) modifications such as payment deferrals, fee waivers or extensions of repayment terms to borrowers who were current prior to any relief. Borrowers considered current are those that are less than 30 days past due on their contractual payments at the time a modification program is implemented.
The same loan receivable may meet more than one of the definitions above. Accordingly, these categories are not mutually exclusive, and it is possible for a particular loan to meet the definitions of a TDR and non-accrual loan, and be included in each of these categories. The categorization of a particular loan also may not be indicative of the potential for loss.
Loan Modifications and Restructurings
Our loss mitigation strategy is intended to minimize economic loss and, at times, can result in rate reductions, principal forgiveness, extensions or other actions, which may cause the related loan to be classified as a TDR. We use long-term modification programs for borrowers experiencing financial difficulty as a loss mitigation strategy to improve long-term collectability of the loans that are classified as TDRs. The long-term program involves changing the structure of the loan to a fixed payment loan with a maturity no longer than 60 months, and reducing the interest rate on the loan. The long-term program does not normally provide for the forgiveness of unpaid principal, but may allow for the reversal of certain unpaid interest or fee assessments. We also make loan modifications for customers who request financial assistance through external sources, such as a consumer credit counseling agency program. The loans that are modified typically receive a reduced interest rate, but continue to be subject to the original minimum payment terms, and do not normally include waiver of unpaid principal, interest or fees. The determination of whether these changes to the terms and conditions meet the TDR criteria includes our consideration of all relevant facts and circumstances. See Note 4. Loan Receivables and Allowance for Credit Losses for additional information on our loan modifications and restructurings.
Our allowance for credit losses on TDRs is generally measured based on the difference between the recorded loan receivable and the present value of the expected future cash flows, discounted at the original effective interest rate of the loan. If the loan is collateral dependent, we measure impairment based upon the fair value of the underlying collateral less estimated selling costs.
Data related to redefault experience is also considered in our overall reserve adequacy review. Once the loan has been modified, it returns to current status (re-aged), only after three consecutive minimum monthly payments are received post modification date, subject to a re-aging limitation of once a year, or twice in a five-year period in accordance with the Federal Financial Institutions Examination Council guidelines on Uniform Retail Credit Classification and Account Management policy issued in June 2000.
Charge-Offs
Net charge-offs consist of the unpaid principal balance of loans held for investment that we determine are uncollectible, net of recovered amounts. We exclude accrued and unpaid finance charges, fees and third-party fraud losses from charge-offs. Charged-off and recovered accrued and unpaid finance charges and fees are included in interest and fees on loans while fraud losses are included in other expense. Charge-offs are recorded as a reduction to the allowance for credit losses, and subsequent recoveries of previously charged-off amounts are credited to the allowance for credit losses. Costs incurred to recover charged-off loans are recorded as collection expense and are included in other expense in our Consolidated Statements of Earnings.
We charge-off unsecured closed-end consumer installment loans and loans secured by collateral when they are 120 days contractually past due, and unsecured open-ended revolving loans when they are 180 days contractually past due. Unsecured consumer loans in bankruptcy are charged-off within 60 days of notification of filing by the bankruptcy court or within contractual charge-off periods, whichever occurs earlier. Credit card loans of deceased account holders are charged-off within 60 days of receipt of notification.
Goodwill and Intangible Assets
We do not amortize goodwill but test it at least annually for impairment at the reporting unit level pursuant to ASC 350, Intangibles—Goodwill and Other. A reporting unit is defined under GAAP as the operating segment, or one level below that operating segment (the component level) if discrete financial information is prepared and regularly reviewed by segment management. Our single operating segment comprises a single reporting unit, based on the level at which segment management regularly reviews and measures the business operating results.
Goodwill impairment risk is first assessed by performing a qualitative review of entity-specific, industry, market and general economic factors for our reporting unit. If potential goodwill impairment risk exists that indicates that it is more likely than not that the carrying value of our reporting unit exceeds its fair value, a quantitative test is performed. The quantitative test compares the reporting unit’s estimated fair value with its carrying value, including goodwill. If the carrying value of our reporting unit exceeds its fair value, an impairment loss is recognized in an amount equal to that excess, limited to the amount of goodwill allocated to the reporting unit. The qualitative assessment for each period presented in the consolidated financial statements was performed without hindsight, assuming only factors and market conditions existing as of those dates, and resulted in no potential goodwill impairment risk for our reporting unit. Consequently, goodwill was not deemed to be impaired for any of the periods presented.
Definite-lived intangible assets principally consist of customer-related assets including contract acquisition costs and purchased credit card relationships. These assets are amortized over their estimated useful lives and evaluated for impairment whenever events or changes in circumstances indicate that the carrying amount of these assets may not be recoverable. The evaluation compares the cash inflows expected to be generated from each intangible asset to its carrying value. If cash flows attributable to the intangible asset are less than the carrying value, the asset is considered impaired and written down to its estimated fair value. No material impairments of definite-lived intangible assets have been recognized in the periods presented in the consolidated financial statements.
Revenue Recognition
Interest and Fees on Loans
We use the effective interest method to recognize income on loans. Interest and fees on loans is comprised largely of interest and late fees on credit card and other loans. Interest income is recognized based upon the amount of loans outstanding and their contractual interest rate. Late fees are recognized when billable to the customer. We continue to accrue interest and fees on credit cards until the accounts are charged-off in the period the account becomes 180 days past due. For non-credit card loans, we stop accruing interest and fees when the account becomes 90 days past due. Previously recognized interest income that was accrued but not collected from the customer is reversed. Although we stop accruing interest in advance of payments, we recognize interest income as cash is collected when appropriate, provided the amount does not exceed that which would have been earned at the historical effective interest rate; otherwise, payments received are applied to reduce the principal balance of the loan.
We resume accruing interest on non-credit card loans when the customer’s account is less than 90 days past due and collection of such amounts is probable. Interest accruals on modified loans that are not considered to be TDRs may return to current status (re-aged) only after receipt of at least three consecutive minimum monthly payments subject to a re-aging limitation of once a year, or twice in a five-year period.
Direct loan origination costs on credit card loans are deferred and amortized on a straight-line basis over a one-year period, or the life of the loan for other loan receivables, and are included in interest and fees on loans in our Consolidated Statements of Earnings. See Note 4. Loan Receivables and Allowance for Credit Losses for further detail.
Other loan fees including miscellaneous fees charged to borrowers are recognized net of waivers and charge-offs when the related transaction or service is provided, and are included in other income in our Consolidated Statements of Earnings.
Promotional Financing
Loans originated with promotional financing may include deferred interest financing (interest accrues during a promotional period and becomes payable if the full purchase amount is not paid off during the promotional period), no interest financing (no interest accrues during a promotional period but begins to accrue thereafter on any outstanding amounts at the end of the promotional period) and reduced interest financing (interest accrues monthly at a promotional interest rate during the promotional period). For deferred interest financing, we bill interest to the borrower, retroactive to the inception of the loan, if the loan is not repaid prior to the specified date. Income is recognized on such loans when it is billable. In almost all cases, our retail partner will pay an upfront fee or reimburse us to compensate us for all or part of the costs associated with providing the promotional financing. Upfront fees are deferred and accreted to income over the promotional period. Reimbursements are estimated and accrued as income over the promotional period.
Purchased Loans
Loans acquired by purchase are recorded at fair value, which may result in the recognition of a loan premium or loan discount. For acquired loans with evidence of more-than-insignificant deterioration in credit quality since origination, the initial allowance for credit losses at acquisition is added to the purchase price to determine the initial cost basis of the loans and loan premium or loan discount. Loan premiums and loan discounts are recognized into interest income over the estimated remaining life of the loans. The Company develops an allowance for credit losses for all purchased loans, which is recognized upon acquisition, similar to that of an originated financial asset. Subsequent changes to the expected credit losses for these loans follow the allowance for credit losses methodology described above under “—Allowance for Credit Losses.”
Retailer Share Arrangements
Most of our Retail Card program agreements and certain other program agreements contain retailer share arrangements that provide for payments to our partners if the economic performance of the program exceeds a contractually defined threshold. We also provide other economic benefits to our partners such as royalties on purchase volume or payments for new accounts, in some cases instead of retailer share arrangements (for example, on our co-branded credit cards). Although the share arrangements vary by partner, these arrangements are generally structured to measure the economic performance of the program, based typically on agreed upon program revenues (including interest income and certain other income) less agreed upon program expenses (including interest expense, provision for credit losses, retailer payments and operating expenses), and share portions of this amount above a negotiated threshold. These thresholds and the economic performance of a program are based on, among other things, agreed upon measures of program expenses. On a quarterly basis, we make a judgment as to whether it is probable that the performance threshold will be met under a particular retail partner’s retailer share arrangement. The current period’s estimated contribution to that ultimate expected payment is recorded as a liability. To the extent facts and circumstances change and the cumulative probable payment for prior months has changed, a cumulative adjustment is made to align the retailer share arrangement liability balance with the amount considered probable of being paid relating to past periods.
Loyalty Programs
Our loyalty programs are designed to generate increased purchase volume per customer while reinforcing the value of our credit cards and strengthening cardholder loyalty. These programs typically provide cardholders with statement credit or cash back rewards. Other programs include rewards points, which are redeemable for a variety of products or awards, or merchandise discounts that are earned by achieving a pre-set spending level on their private label credit card, Dual Card or general purpose co-branded credit card. These programs are primarily in our Retail Card platform. We establish a rewards liability based on points and merchandise discounts earned that are ultimately expected to be redeemed and the average cost per point at redemption. The rewards liability is included in accrued expenses and other liabilities in our Consolidated Statements of Financial Position. Cash rebates are earned based on a tiered percentage of purchase volume. As points and discounts are redeemed or cash rebates are issued, the rewards liability is relieved. The estimated cost of loyalty programs is classified as a reduction to other income in our Consolidated Statements of Earnings.
Fraud Losses
We experience third-party fraud losses from the unauthorized use of credit cards and when loans are obtained through fraudulent means. Fraud losses are included as a charge within other expense in our Consolidated Statements of Earnings, net of recoveries, when such losses are probable. Loans are charged off, as applicable, after the investigation period has completed.
Income Taxes
We recognize the current and deferred tax consequences of all transactions that have been recognized in the financial statements using the provisions of the enacted tax laws. The effects of tax adjustments and settlements from taxing authorities are presented in our consolidated financial statements in the period they occur.
Deferred tax assets and liabilities are determined based on differences between the financial reporting and tax basis of assets and liabilities and are measured using the enacted tax laws and rates that will be in effect when the differences are expected to reverse. We record valuation allowances to reduce deferred tax assets to the amount that is more likely than not to be realized. In making decisions regarding our ability to realize tax assets, we evaluate all positive and negative evidence, including projected future taxable income, taxable income in carryback periods, expected reversal of deferred tax liabilities and the implementation of available tax planning strategies.
We recognize the financial statement impact of uncertain income tax positions when we conclude that it is more likely than not, based on the technical merits of a position, that the position will be sustained upon examination. In certain situations, we establish a liability that represents the difference between a tax position taken (or expected to be taken) on an income tax return and the amount of taxes recognized in our financial statements. The liability associated with the unrecognized tax benefits is adjusted periodically when new information becomes available. We recognize accrued interest and penalties related to unrecognized tax benefits as interest expense and provision for income taxes, respectively, in our Consolidated Statements of Earnings.
Fair Value Measurements
Fair value is the price we would receive to sell an asset or pay to transfer a liability in an orderly transaction with a market participant at the measurement date. In the absence of active markets for the identical assets or liabilities, such measurements involve developing assumptions based on market observable data and, in the absence of such data, internal information that is consistent with what market participants would use in a hypothetical transaction that occurs at the measurement date.
Observable inputs reflect market data obtained from independent sources, while unobservable inputs reflect our market assumptions. Preference is given to observable inputs. These two types of inputs create the following fair value hierarchy:
Level 1— Quoted prices for identical instruments in active markets.
Level 2— Quoted prices for similar instruments in active markets; quoted prices for identical or similar instruments in markets that are not active; and model-derived valuations whose inputs are observable or whose significant value drivers are observable.
Level 3— Significant inputs to the valuation are unobservable.
We maintain policies and procedures to value instruments using the best and most relevant data available. In addition, we have risk management teams that review valuations, including independent price validation for certain instruments. We use non-binding broker quotes and third-party pricing services as our primary basis for valuation when there is limited or no relevant market activity for a specific instrument or for other instruments that share similar characteristics. We have not adjusted prices that we have obtained.
The third-party brokers and third-party pricing services do not provide us access to their proprietary valuation models, inputs and assumptions. Accordingly, our risk management, treasury and/or finance personnel conduct reviews of these brokers and services, as applicable. In addition, we conduct internal reviews of pricing provided by our third-party pricing service for all investment securities on a quarterly basis to ensure reasonableness of valuations used in the consolidated financial statements. These reviews are designed to identify prices that appear stale, those that have changed significantly from prior valuations and other anomalies that may indicate that a price may not be accurate. Based on the information available, we believe that the fair values provided by the third-party brokers and pricing services are representative of prices that would be received to sell the assets at the measurement date (exit prices) and are classified appropriately in the hierarchy.
Recurring Fair Value Measurements
Our investments in debt and certain equity securities, as well as certain contingent consideration obligations are measured at fair value every reporting period on a recurring basis.
Non-Recurring Fair Value Measurements
Certain assets are measured at fair value on a non-recurring basis. These assets are not measured at fair value on an ongoing basis but are subject to fair value adjustments only in certain circumstances. Assets that are written down to fair value when impaired are not subsequently adjusted to fair value unless further impairment occurs.
Financial Assets and Financial Liabilities Carried at Other than Fair Value
The following is a description of the valuation techniques used to estimate the fair values of the financial assets and liabilities carried at other than fair value.
Loan receivables, net
In estimating the fair value for our loan receivables, we use a discounted future cash flow model. We use various unobservable inputs including estimated interest and fee income, payment rates, loss rates and discount rates (which consider current market interest rate data adjusted for credit risk and other factors) to estimate the fair values of loans. When collateral dependent, loan receivables may be valued using collateral values.
Deposits
For demand deposits with no defined maturity, carrying value approximates fair value due to the liquid nature of these deposits. For fixed-maturity certificates of deposit, fair values are estimated by discounting expected future cash flows using market rates currently offered for deposits with similar remaining maturities.
Borrowings
The fair values of borrowings of consolidated securitization entities are based on valuation methodologies that utilize current market interest rate data, which are comparable to market quotes adjusted for our non-performance risk. Borrowings that are publicly traded securities are classified as level 2. Borrowings that are not publicly traded are classified as level 3.
The fair values of the senior unsecured notes are based on secondary market trades and other observable inputs and are classified as level 2.
NOTE 3. DEBT SECURITIES
All of our debt securities are classified as available-for-sale and are held to meet our liquidity objectives or to comply with the Community Reinvestment Act. Our debt securities consist of the following:
| | | | | | | | | | | | | | | | | | | | | | | | | | | | | | | | | | | | | | | | | | | | | | | |
| December 31, 2020 | | December 31, 2019 |
| | | Gross | | Gross | | | | | | Gross | | Gross | | |
| Amortized | | unrealized | | unrealized | | Estimated | | Amortized | | unrealized | | unrealized | | Estimated |
| ($ in millions) | cost | | gains | | losses | | fair value | | cost | | gains | | losses | | fair value |
| | | | | | | | | | | | | | | |
| U.S. government and federal agency | $ | 3,926 | | | $ | 1 | | | $ | — | | | $ | 3,927 | | | $ | 2,468 | | | $ | 1 | | | $ | — | | | $ | 2,469 | |
| State and municipal | 40 | | | — | | | (1) | | | 39 | | | 46 | | | 1 | | | (2) | | | 45 | |
Residential mortgage-backed(a) | 817 | | | 25 | | | — | | | 842 | | | 1,029 | | | 6 | | | (9) | | | 1,026 | |
Asset-backed(b) | 2,652 | | | 9 | | | — | | | 2,661 | | | 2,368 | | | 3 | | | — | | | 2,371 | |
| | | | | | | | | | | | | | | |
| | | | | | | | | | | | | | | |
| | | | | | | | | | | | | | | |
| Total | $ | 7,435 | | | $ | 35 | | | $ | (1) | | | $ | 7,469 | | | $ | 5,911 | | | $ | 11 | | | $ | (11) | | | $ | 5,911 | |
_____________
(a) All of our residential mortgage-backed securities have been issued by government-sponsored entities and are collateralized by U.S. mortgages. At December 31, 2020 and 2019, $229 million and $351 million of residential mortgage-backed securities, respectively, are pledged by the Bank as collateral to the Federal Reserve to secure Federal Reserve Discount Window advances.
(b) Our asset-backed securities are collateralized by credit card and auto loans.
The following table presents the estimated fair values and gross unrealized losses of our available-for-sale debt securities:
| | | | | | | | | | | | | | | | | | | | | | | |
| In loss position for |
| Less than 12 months | | 12 months or more |
| | | Gross | | | | Gross |
| Estimated | | unrealized | | Estimated | | unrealized |
| ($ in millions) | fair value | | losses | | fair value | | losses |
| At December 31, 2020 | | | | | | | |
| U.S. government and federal agency | $ | — | | | $ | — | | | $ | — | | | $ | — | |
| State and municipal | 3 | | | — | | | 21 | | | (1) | |
| Residential mortgage-backed | 6 | | | — | | | — | | | — | |
| Asset-backed | 242 | | | — | | | — | | | — | |
| Total | $ | 251 | | | $ | — | | | $ | 21 | | | $ | (1) | |
| | | | | | | |
| At December 31, 2019 | | | | | | | |
| U.S. government and federal agency | $ | — | | | $ | — | | | $ | — | | | $ | — | |
| State and municipal | — | | | — | | | 24 | | | (2) | |
| Residential mortgage-backed | 76 | | | — | | | 618 | | | (9) | |
| Asset-backed | 202 | | | — | | | — | | | — | |
| Total | $ | 278 | | | $ | — | | | $ | 642 | | | $ | (11) | |
The adoption of CECL did not have a material impact on our accounting for available for sale debt securities. We regularly review debt securities for impairment resulting from credit loss using both qualitative and quantitative criteria, as necessary based on the composition of the portfolio at period end. Based on our assessment, no material impairments for credit losses were recognized during the period.
We presently do not intend to sell our debt securities that are in an unrealized loss position and believe that it is not more likely than not that we will be required to sell these securities before recovery of our amortized cost.
Contractual Maturities of Investments in Available-for-Sale Debt Securities
| | | | | | | | | | | | | | | | | |
| Amortized | | Estimated | | Weighted |
At December 31, 2020 ($ in millions) | cost | | fair value | | Average yield(a) |
| Due | | | | | |
| Within one year | $ | 4,095 | | | $ | 4,098 | | | 0.4 | % |
| After one year through five years | $ | 2,485 | | | $ | 2,492 | | | 0.4 | % |
| After five years through ten years | $ | 134 | | | $ | 139 | | | 2.5 | % |
| After ten years | $ | 721 | | | $ | 740 | | | 1.8 | % |
| | | | | |
______________________
(a)Weighted average yield is calculated based on the amortized cost of each security. In calculating yield, no adjustment has been made with respect to any tax-exempt obligations.
We expect actual maturities to differ from contractual maturities because borrowers have the right to prepay certain obligations.
There were no material realized gains or losses recognized for the years ended December 31, 2020, 2019 and 2018.
Although we generally do not have the intent to sell any specific securities held at December 31, 2020, in the ordinary course of managing our debt securities portfolio, we may sell securities prior to their maturities for a variety of reasons, including diversification, credit quality, yield, liquidity requirements and funding obligations.
NOTE 4. LOAN RECEIVABLES AND ALLOWANCE FOR CREDIT LOSSES
| | | | | | | | | | | |
| At December 31 ($ in millions) | 2020 | | 2019 |
| Credit cards | $ | 78,455 | | | $ | 84,606 | |
| Consumer installment loans | 2,125 | | | 1,347 | |
| Commercial credit products | 1,250 | | | 1,223 | |
| Other | 37 | | | 39 | |
Total loan receivables, before allowance for losses(a)(b) | $ | 81,867 | | | $ | 87,215 | |
_______________________
(a)Total loan receivables include $25.4 billion and $28.8 billion of restricted loans of consolidated securitization entities at December 31, 2020 and 2019, respectively. See Note 5. Variable Interest Entities for further information on these restricted loans.
(b)At December 31, 2020 and 2019, loan receivables included deferred costs, net of deferred income, of $153 million and $140 million, respectively.
Disposition of Loan Receivables
In October 2019, we completed our sale and conversion of $8.2 billion of loan receivables associated with our Retail Card program agreement with Walmart. In addition, in January 2020, we completed the sale of loan receivables associated with our Payment Solutions program agreement with Yamaha.
Allowance for Credit Losses(a)
| | | | | | | | | | | | | | | | | | | | | | | | | | | | | | | | | | | | | | | | | |
| ($ in millions) | Balance at January 1, 2020 | | Impact of ASU 2016-13 Adoption | | Post-Adoption Balance at January 1, 2020 | | Provision charged to operations | | Gross charge-offs | | Recoveries | | Balance at December 31, 2020 |
| Credit cards | $ | 5,506 | | | $ | 2,989 | | | $ | 8,495 | | | $ | 5,171 | | | $ | (4,505) | | | $ | 915 | | | $ | 10,076 | |
| Consumer installment loans | 46 | | | 26 | | | 72 | | | 92 | | | (51) | | | 14 | | | 127 | |
| Commercial credit products | 49 | | | 6 | | | 55 | | | 47 | | | (50) | | | 9 | | | 61 | |
| Other | 1 | | | — | | | 1 | | | — | | | — | | | — | | | 1 | |
| Total | $ | 5,602 | | | $ | 3,021 | | | $ | 8,623 | | | $ | 5,310 | | | $ | (4,606) | | | $ | 938 | | | $ | 10,265 | |
Allowance for Loan Losses(b)
| | | | | | | | | | | | | | | | | | | | | | | | | | | | | |
| ($ in millions) | Balance at January 1, 2019 | | Provision charged to operations | | Gross charge-offs | | Recoveries | | Balance at December 31, 2019 |
| Credit cards | $ | 6,327 | | | $ | 4,083 | | | $ | (5,907) | | | $ | 1,003 | | | $ | 5,506 | |
| Consumer installment loans | 44 | | | 51 | | | (66) | | | 17 | | | 46 | |
| Commercial credit products | 55 | | | 45 | | | (58) | | | 7 | | | 49 | |
| Other | 1 | | | 1 | | | (1) | | | — | | | 1 | |
| Total | $ | 6,427 | | | $ | 4,180 | | | $ | (6,032) | | | $ | 1,027 | | | $ | 5,602 | |
| | | | | | | | | | | | | | | | | | | | | | | | | | | | | |
| ($ in millions) | Balance at January 1, 2018 | | Provision charged to operations | | Gross charge-offs | | Recoveries | | Balance at December 31, 2018 |
| Credit cards | $ | 5,483 | | | $ | 5,448 | | | $ | (5,435) | | | $ | 831 | | | $ | 6,327 | |
| Consumer installment loans | 40 | | | 45 | | | (56) | | | 15 | | | 44 | |
| Commercial credit products | 50 | | | 52 | | | (53) | | | 6 | | | 55 | |
| Other | 1 | | | — | | | — | | | — | | | 1 | |
| Total | $ | 5,574 | | | $ | 5,545 | | | $ | (5,544) | | | $ | 852 | | | $ | 6,427 | |
_______________________
(a)The allowance for credit losses at December 31, 2020 reflects our estimate of expected credit losses for the life of the loan receivables on our consolidated statement of financial position at December 31, 2020, which includes the consideration of current and expected macroeconomic conditions that existed at that date.
(b)Comparative information is presented in accordance with applicable accounting standards in effect prior to the adoption of ASU 2016-13.
Delinquent and Non-accrual Loans
| | | | | | | | | | | | | | | | | | | | | | | | | | | | | |
At December 31, 2020 ($ in millions) | 30-89 days delinquent | | 90 or more days delinquent | | Total past due | | 90 or more days delinquent and accruing | | Total non-accruing(a) |
| Credit cards | $ | 1,325 | | | $ | 1,128 | | | $ | 2,453 | | | $ | 1,128 | | | $ | — | |
| Consumer installment loans | 26 | | | 5 | | | 31 | | | — | | | 5 | |
| Commercial credit products | 20 | | | 10 | | | 30 | | | 10 | | | — | |
| | | | | | | | | |
| Total delinquent loans | $ | 1,371 | | | $ | 1,143 | | | $ | 2,514 | | | $ | 1,138 | | | $ | 5 | |
| Percentage of total loan receivables | 1.7 | % | | 1.4 | % | | 3.1 | % | | 1.4 | % | | — | % |
| | | | | | | | | | | | | | | | | | | | | | | | | | | | | |
At December 31, 2019 ($ in millions) | 30-89 days delinquent | | 90 or more days delinquent | | Total past due | | 90 or more days delinquent and accruing | | Total non-accruing(a) |
| Credit cards | $ | 1,936 | | | $ | 1,852 | | | $ | 3,788 | | | $ | 1,850 | | | $ | — | |
| Consumer installment loans | 21 | | | 7 | | | 28 | | | — | | | 7 | |
| Commercial credit products | 40 | | | 18 | | | 58 | | | 18 | | | — | |
| | | | | | | | | |
| Total delinquent loans | $ | 1,997 | | | $ | 1,877 | | | $ | 3,874 | | | $ | 1,868 | | | $ | 7 | |
| Percentage of total loan receivables | 2.3 | % | | 2.2 | % | | 4.4 | % | | 2.1 | % | | — | % |
_______________________
(a)Excludes purchase credit deteriorated loan receivables.
Troubled Debt Restructurings
We use certain loan modification programs for borrowers experiencing financial difficulties. These loan modification programs include interest rate reductions and payment deferrals in excess of three months, which were not part of the terms of the original contract. Our TDR loans do not include loans that are classified as loan receivables held for sale or short-term modifications made on a good faith basis in response to COVID-19.
We have both internal and external loan modification programs. We use long-term modification programs for borrowers experiencing financial difficulty as a loss mitigation strategy to improve long-term collectability of the loans that are classified as TDRs. The long-term program involves changing the structure of the loan to a fixed payment loan with a maturity no longer than 60 months and reducing the interest rate on the loan. The long-term program does not normally provide for the forgiveness of unpaid principal but may allow for the reversal of certain unpaid interest or fee assessments. We also make loan modifications for customers who request financial assistance through external sources, such as consumer credit counseling agency programs. These loans typically receive a reduced interest rate but continue to be subject to the original minimum payment terms and do not normally include waiver of unpaid principal, interest or fees. The following table provides information on our TDR loan modifications during the periods presented:
| | | | | | | | | | | |
| |
| For the years ended December 31 ($ in millions) | 2020 | | 2019 |
| Credit cards | $ | 851 | | | $ | 849 | |
| Consumer installment loans | — | | | — | |
| Commercial credit products | 3 | | | 3 | |
| | | |
| Total | $ | 854 | | | $ | 852 | |
Our allowance for credit losses on TDRs is generally measured based on the difference between the recorded loan receivable and the present value of the expected future cash flows, discounted at the original effective interest rate of the loan. Interest income from loans accounted for as TDRs is accounted for in the same manner as other accruing loans.
The following table provides information about loans classified as TDRs and specific reserves. We do not evaluate credit card loans on an individual basis but instead estimate an allowance for credit losses on a collective basis.
| | | | | | | | | | | | | | | | | | | | | | | |
At December 31, 2020 ($ in millions) | Total recorded
investment | | Related allowance | | Net recorded investment | | Unpaid principal balance |
| Credit cards | $ | 1,238 | | | $ | (561) | | | $ | 677 | | | $ | 1,084 | |
| Consumer installment loans | — | | | — | | | — | | | — | |
| Commercial credit products | 4 | | | (2) | | | 2 | | | 4 | |
| Total | $ | 1,242 | | | $ | (563) | | | $ | 679 | | | $ | 1,088 | |
| | | | | | | | | | | | | | | | | | | | | | | |
At December 31, 2019 ($ in millions) | Total recorded
investment | | Related allowance | | Net recorded investment | | Unpaid principal balance |
| Credit cards | $ | 1,146 | | | $ | (550) | | | $ | 596 | | | $ | 1,019 | |
| Consumer installment loans | — | | | — | | | — | | | — | |
| Commercial credit products | 4 | | | (2) | | | 2 | | | 4 | |
| Total | $ | 1,150 | | | $ | (552) | | | $ | 598 | | | $ | 1,023 | |
Financial Effects of TDRs
As part of our loan modifications for borrowers experiencing financial difficulty, we may provide multiple concessions to minimize our economic loss and improve long-term loan performance and collectability. The following table presents the types and financial effects of loans modified and accounted for as TDRs during the periods presented.
| | | | | | | | | | | | | | | | | | | | | | | | | | | | | | | | | | | |
| Years ended December 31, | 2020 | | 2019 | | 2018 |
| ($ in millions) | Interest income recognized during period when loans were impaired | Interest income that would have been recorded with original terms | Average recorded investment | | Interest income recognized during period when loans were impaired | Interest income that would have been recorded with original terms | Average recorded investment | | Interest income recognized during period when loans were impaired | Interest income that would have been recorded with original terms | Average recorded investment |
| Credit cards | $ | 44 | | $ | 279 | | $ | 1,151 | | | $ | 45 | | $ | 268 | | $ | 1,111 | | | $ | 49 | | $ | 266 | | $ | 1,112 | |
| Consumer installment loans | — | | — | | — | | | — | | — | | — | | | — | | — | | — | |
| Commercial credit products | — | | 1 | | 3 | | | — | | 1 | | 4 | | | — | | 1 | | 5 | |
| Total | $ | 44 | | $ | 280 | | $ | 1,154 | | | $ | 45 | | $ | 269 | | $ | 1,115 | | | $ | 49 | | $ | 267 | | $ | 1,117 | |
Payment Defaults
The following table presents the type, number and amount of loans accounted for as TDRs that enrolled in a modification plan within the previous 12 months from the applicable balance sheet date and experienced a payment default and charged-off during the periods presented.
| | | | | | | | | | | | | | | | | | | | | | | | | | | | | | | | | | | |
| Years ended December 31, | 2020 | | 2019 | | 2018 |
| ($ in millions) | Accounts defaulted | | Loans defaulted | | Accounts defaulted | | Loans defaulted | | Accounts defaulted | | Loans defaulted |
| Credit cards | 30,743 | | | $ | 80 | | | 39,233 | | | $ | 98 | | | 38,976 | | | $ | 91 | |
| Consumer installment loans | — | | | — | | | — | | | — | | | — | | | — | |
| Commercial credit products | 164 | | | 1 | | | 114 | | 1 | | | 76 | | | 1 | |
| | | | | | | | | | | |
| Total | 30,907 | | | $ | 81 | | | 39,347 | | | $ | 99 | | | 39,052 | | | $ | 92 | |
Credit Quality Indicators
Our loan receivables portfolio includes both secured and unsecured loans. Secured loan receivables are largely comprised of consumer installment loans secured by equipment. Unsecured loan receivables are largely comprised of our open-ended consumer and commercial revolving credit card loans. As part of our credit risk management activities, on an ongoing basis, we assess overall credit quality by reviewing information related to the performance of a customer’s account with us, as well as information from credit bureaus relating to the customer’s broader credit performance. We now utilize VantageScore (“Vantage”) credit scores to assist in our assessment of credit quality as we believe Vantage scores more U.S. consumers, and potential applicants, as compared to our prior use of FICO credit scores. Vantage credit scores are obtained at origination of the account and are refreshed, at a minimum quarterly, but could be as often as weekly, to assist in predicting customer behavior. We categorize these credit scores into the following three credit score categories: (i) 651 or higher, which are considered the strongest credits; (ii) 591 to 650, considered moderate credit risk; and (iii) 590 or less, which are considered weaker credits. We believe these three categories of Vantage credit scores represent an approximation of the categories previously reported using FICO data in terms of both probability of default and customer account distribution. There are certain customer accounts for which a Vantage score is not available where we use alternative sources to assess their credit and predict behavior. The following table provides the most recent Vantage scores available for our customers at December 31, 2020, as a percentage of each class of loan receivable. For comparability purposes and to provide the best illustration of how the credit risk inherent in our loan portfolios has changed over time, the credit quality information at December 31, 2019 has also been presented to show applicable Vantage score categories. The table below excludes 0.3% and 0.4% of our total loan receivables balance at each of December 31, 2020 and 2019, respectively, which represents those customer accounts for which a Vantage score is not available.
| | | | | | | | | | | | | | | | | | | | | | | | | | | | | | | | | | | |
| Vantage |
| At December 31 | 2020 | | 2019 |
| 651 or | | 591 to | | 590 or | | 651 or | | 591 to | | 590 or |
| higher | | 650 | | | less | | higher | | 650 | | | less |
| | | | | | | | | | | |
| Credit cards | 77 | % | | 17 | % | | 6 | % | | 72 | % | | 20 | % | | 8 | % |
| Consumer installment loans | 78 | % | | 18 | % | | 4 | % | | 75 | % | | 19 | % | | 6 | % |
| Commercial credit products | 92 | % | | 5 | % | | 3 | % | | 90 | % | | 5 | % | | 5 | % |
Unfunded Lending Commitments
We manage the potential risk in credit commitments by limiting the total amount of credit, both by individual customer and in total, by monitoring the size and maturity of our portfolios and by applying the same credit standards for all of our credit products. Unused credit card lines available to our customers totaled approximately $413 billion and $419 billion at December 31, 2020 and 2019, respectively. While these amounts represented the total available unused credit card lines, we have not experienced and do not anticipate that all of our customers will access their entire available line at any given point in time.
Interest Income by Product
The following table provides additional information about our interest and fees on loans, including merchant discounts, from our loan receivables, including held for sale:
| | | | | | | | | | | | | | | | | |
| For the years ended December 31 ($ in millions) | 2020 | | 2019 | | 2018 |
Credit cards(a) | $ | 15,672 | | | $ | 18,384 | | | $ | 17,342 | |
| Consumer installment loans | 168 | | | 182 | | | 156 | |
| Commercial credit products | 108 | | | 137 | | | 144 | |
| Other | 2 | | | 2 | | | 2 | |
| Total | $ | 15,950 | | | $ | 18,705 | | | $ | 17,644 | |
_______________________
(a)Interest income on credit cards that was reversed related to accrued interest receivables written off was $1.5 billion and $1.9 billion for the years ended December 31, 2020 and 2019, respectively.
NOTE 5. VARIABLE INTEREST ENTITIES
We use VIEs to securitize loan receivables and arrange asset-backed financing in the ordinary course of business. Investors in these entities only have recourse to the assets owned by the entity and not to our general credit. We do not have implicit support arrangements with any VIE and we did not provide non-contractual support for previously transferred loan receivables to any VIE in the years ended December 31, 2020 and 2019. Our VIEs are able to accept new loan receivables and arrange new asset-backed financings, consistent with the requirements and limitations on such activities placed on the VIE by existing investors. Once an account has been designated to a VIE, the contractual arrangements we have require all existing and future loan receivables originated under such account to be transferred to the VIE. The amount of loan receivables held by our VIEs in excess of the minimum amount required under the asset-backed financing arrangements with investors may be removed by us under removal of accounts provisions. All loan receivables held by a VIE are subject to claims of third-party investors.
In evaluating whether we have the power to direct the activities of a VIE that most significantly impact its economic performance, we consider the purpose for which the VIE was created, the importance of each of the activities in which it is engaged and our decision-making role, if any, in those activities that significantly determine the entity’s economic performance as compared to other economic interest holders. This evaluation requires consideration of all facts and circumstances relevant to decision-making that affects the entity’s future performance and the exercise of professional judgment in deciding which decision-making rights are most important.
In determining whether we have the right to receive benefits or the obligation to absorb losses that could potentially be significant to a VIE, we evaluate all of our economic interests in the entity, regardless of form (debt, equity, management and servicing fees, and other contractual arrangements). This evaluation considers all relevant factors of the entity’s design, including: the entity’s capital structure, contractual rights to earnings or losses, subordination of our interests relative to those of other investors, as well as any other contractual arrangements that might exist that could have the potential to be economically significant. The evaluation of each of these factors in reaching a conclusion about the potential significance of our economic interests is a matter that requires the exercise of professional judgment.
We consolidate VIEs where we have the power to direct the activities that significantly affect the VIEs' economic performance, typically because of our role as either servicer or administrator for the VIEs. The power to direct exists because of our role in the design and conduct of the servicing of the VIEs’ assets as well as directing certain affairs of the VIEs, including determining whether and on what terms debt of the VIEs will be issued.
The loan receivables in these entities have risks and characteristics similar to our other financing receivables and were underwritten to the same standard. Accordingly, the performance of these assets has been similar to our other comparable loan receivables, and the blended performance of the pools of receivables in these entities reflects the eligibility criteria that we apply to determine which receivables are selected for transfer. Contractually, the cash flows from these financing receivables must first be used to pay third-party debt holders, as well as other expenses of the entity. Excess cash flows, if any, are available to us. The creditors of these entities have no claim on our other assets.
The table below summarizes the assets and liabilities of our consolidated securitization VIEs described above.
| | | | | | | | | | | |
| At December 31 ($ in millions) | 2020 | | 2019 |
| Assets | | | |
Loan receivables, net(a) | $ | 22,683 | | | $ | 27,217 | |
| | | |
Other assets(b) | 52 | | | 68 | |
| Total | $ | 22,735 | | | $ | 27,285 | |
| | | | |
| Liabilities | | | |
| Borrowings | $ | 7,810 | | | $ | 10,412 | |
| Other liabilities | 23 | | | 32 | |
| Total | $ | 7,833 | | | $ | 10,444 | |
_______________________
(a) Includes $2.7 billion and $1.6 billion of related allowance for credit losses resulting in gross restricted loans of $25.4 billion and $28.8 billion at December 31, 2020 and 2019, respectively.
(b) Includes $48 million and $62 million of segregated funds held by the VIEs at December 31, 2020 and 2019, respectively, which are classified as restricted cash and equivalents and included as a component of other assets in our Consolidated Statements of Financial Position.
The balances presented above are net of intercompany balances and transactions that are eliminated in our consolidated financial statements.
We provide servicing for all of our consolidated VIEs. Collections are required to be placed into segregated accounts owned by each VIE in amounts that meet contractually specified minimum levels. These segregated funds are invested in cash and cash equivalents and are restricted as to their use, principally to pay maturing principal and interest on debt and the related servicing fees. Collections above these minimum levels are remitted to us on a daily basis.
Income (principally, interest and fees on loans) earned by our consolidated VIEs was $4.9 billion, $5.2 billion and $5.0 billion for the years ended December 31, 2020, 2019 and 2018, respectively. Related expenses consisted primarily of provision for credit losses of $1.5 billion, $1.1 billion and $1.5 billion for the years ended December 31, 2020, 2019 and 2018, respectively, and interest expense of $237 million, $358 million and $344 million for the years ended December 31, 2020, 2019 and 2018, respectively. These amounts do not include intercompany transactions, principally fees and interest, which are eliminated in our consolidated financial statements.
NOTE 6. GOODWILL AND OTHER INTANGIBLE ASSETS
Goodwill
| | | | | | | | | | | |
($ in millions) | 2020 | | 2019 |
Balance at January 1 | $ | 1,078 | | | $ | 1,024 | |
Acquisitions | — | | | 54 | |
Balance at December 31 | $ | 1,078 | | | $ | 1,078 | |
Intangible Assets Subject to Amortization
| | | | | | | | | | | | | | | | | | | | | | | | | | | | | | | | | | | | | | | | |
| | | | 2020 | | 2019 |
| At December 31 ($ in millions) | | | | Gross carrying amount | | Accumulated amortization | | Net | | Gross carrying amount | | Accumulated amortization | | Net |
| Customer-related | | | | $ | 1,734 | | | $ | (1,081) | | | $ | 653 | | | $ | 1,749 | | | $ | (952) | | | $ | 797 | |
| Capitalized software and other | | | | 1,043 | | | (571) | | | 472 | | | 861 | | | (393) | | | 468 | |
| Total | | | | $ | 2,777 | | | $ | (1,652) | | | $ | 1,125 | | | $ | 2,610 | | | $ | (1,345) | | | $ | 1,265 | |
During the year ended December 31, 2020, we recorded additions to intangible assets subject to amortization of $217 million, primarily related to capitalized software expenditures, as well as customer-related intangible assets.
Customer-related intangible assets primarily relate to retail partner contract acquisitions and extensions, as well as purchased credit card relationships. During the years ended December 31, 2020 and 2019, we recorded additions to customer-related intangible assets subject to amortization of $31 million and $130 million, respectively, primarily related to payments made to acquire and extend certain retail partner relationships. These additions had a weighted average amortizable life of 7 years for both the years ended December 31, 2020 and 2019, respectively.
Amortization expense related to retail partner contracts was $128 million, $133 million and $125 million for the years ended December 31, 2020, 2019 and 2018, respectively, and is included as a component of marketing and business development expense in our Consolidated Statements of Earnings. All other amortization expense was $199 million, $168 million and $115 million for the years ended December 31, 2020, 2019 and 2018, respectively, and is included as a component of other expense in our Consolidated Statements of Earnings.
We estimate annual amortization expense for existing intangible assets over the next five calendar years to be as follows:
| | | | | | | | | | | | | | | | | | | | | | | | | | | | | |
| ($ in millions) | 2021 | | 2022 | | 2023 | | 2024 | | 2025 |
| Amortization expense | $ | 275 | | | $ | 226 | | | $ | 182 | | | $ | 146 | | | $ | 100 | |
NOTE 7. DEPOSITS
Deposits
| | | | | | | | | | | | | | | | | | | | | | | |
| 2020 | | 2019 |
| At December 31 ($ in millions) | Amount | | Average rate(a) | | Amount | | Average rate(a) |
| Interest-bearing deposits | $ | 62,469 | | | 1.7 | % | | $ | 64,877 | | | 2.4 | % |
| Non-interest-bearing deposits | 313 | | | — | | | 277 | | | — | |
| Total deposits | $ | 62,782 | | | | | $ | 65,154 | | | |
___________________
(a)Based on interest expense for the years ended December 31, 2020 and 2019 and average deposits balances.
At December 31, 2020 and 2019, interest-bearing deposits included $6.5 billion and $8.5 billion, respectively, of certificates of deposit that exceeded applicable FDIC insurance limits, which are generally $250,000 per depositor.
At December 31, 2020, our interest-bearing time deposits maturing over the next five years and thereafter were as follows:
| | | | | | | | | | | | | | | | | | | | | | | | | | | | | | | | | | | | |
| ($ in millions) | 2021 | | 2022 | | 2023 | | 2024 | | 2025 | | Thereafter | |
| Deposits | $ | 22,474 | | | $ | 4,832 | | | $ | 1,765 | | | $ | 2,319 | | | $ | 662 | | | $ | 173 | | |
The above maturity table excludes $25.1 billion of demand deposits with no defined maturity, of which $23.8 billion are savings accounts. In addition, at December 31, 2020, we had $5.2 billion of broker network deposit sweeps procured through a program arranger who channels brokerage account deposits to us that are also excluded from the above maturity table. Unless extended, the contracts associated with these broker network deposit sweeps will terminate between 2021 and 2027.
NOTE 8. BORROWINGS
| | | | | | | | | | | | | | | | | | | | | | | | | | | | | |
| 2020 | | 2019 |
| At December 31 ($ in millions) | Maturity date | | Interest Rate | | Weighted average interest rate | | Outstanding Amount(a) | | Outstanding Amount(a) |
| Borrowings of consolidated securitization entities: | | | | | | | | | |
| Fixed securitized borrowings | 2021 - 2023 | | 2.21% - 3.87% | | 2.88 | % | | $ | 5,510 | | | $ | 7,512 | |
| Floating securitized borrowings | 2021 - 2023 | | 0.81% - 1.06% | | 0.90 | % | | 2,300 | | | 2,900 | |
| Total borrowings of consolidated securitization entities | | | | | 2.30 | % | | 7,810 | | | 10,412 | |
| | | | | | | | | |
| Senior unsecured notes: | | | | | | | | | |
| Synchrony Financial senior unsecured notes: | | | | | | | | | |
| Fixed senior unsecured notes | 2021 - 2029 | | 2.80% - 5.15% | | 4.08 | % | | 6,468 | | | 7,211 | |
| Floating senior unsecured notes | N/A | | 0.00 | % | | — | % | | — | | | 250 | |
| | | | | | | | | |
| Synchrony Bank senior unsecured notes: | | | | | | | | | |
| Fixed senior unsecured notes | 2021 - 2022 | | 3.00% - 3.65% | | 3.33 | % | | 1,497 | | | 1,493 | |
| Floating senior unsecured notes | N/A | | 0.00 | % | | — | % | | — | | | 500 | |
| Total senior unsecured notes | | | | | 3.94 | % | | 7,965 | | | 9,454 | |
| | | | | | | | | |
| Total borrowings | | | | | | | $ | 15,775 | | | $ | 19,866 | |
___________________
(a)The amounts presented above for outstanding borrowings include unamortized debt premiums, discounts and issuance costs.
Debt Maturities
The following table summarizes the maturities of the principal amount of our borrowings of consolidated securitization entities and senior unsecured notes over the next five years and thereafter:
| | | | | | | | | | | | | | | | | | | | | | | | | | | | | | | | | | | |
| ($ in millions) | 2021 | | 2022 | | 2023 | | 2024 | | 2025 | | Thereafter |
| Borrowings | $ | 4,825 | | | $ | 4,784 | | | $ | 1,207 | | | $ | 1,850 | | | $ | 1,000 | | | $ | 2,150 | |
| | | | | | | | | | | |
| | | | | | | | | | | |
Credit Facilities
As additional sources of liquidity, we have undrawn committed capacity under certain credit facilities, primarily related to our securitization programs.
At December 31, 2020, we had an aggregate of $4.9 billion of undrawn committed capacity under our securitization financings, subject to customary borrowing conditions, from private lenders under our securitization programs, and an aggregate of $0.5 billion of undrawn committed capacity under our unsecured revolving credit facility with private lenders.
NOTE 9. FAIR VALUE MEASUREMENTS
For a description of how we estimate fair value, see Note 2. Basis of Presentation and Summary of Significant Accounting Policies.
The following tables present our assets and liabilities measured at fair value on a recurring basis.
Recurring Fair Value Measurements
| | | | | | | | | | | | | | | | | | | | | | | |
At December 31, 2020 ($ in millions) | Level 1 | | Level 2 | | Level 3 | | Total(a) |
| Assets | | | | | | | |
| Debt securities | | | | | | | |
| U.S. government and federal agency | $ | — | | | $ | 3,927 | | | $ | — | | | $ | 3,927 | |
| State and municipal | — | | | — | | | 39 | | | 39 | |
| Residential mortgage-backed | — | | | 842 | | | — | | | 842 | |
| Asset-backed | — | | | 2,661 | | | — | | | 2,661 | |
| | | | | | | |
Other assets(b) | 16 | | | — | | | 14 | | | 30 | |
| Total | $ | 16 | | | $ | 7,430 | | | $ | 53 | | | $ | 7,499 | |
| | | | | | | |
| Liabilities | | | | | | | |
| Contingent consideration | — | | | — | | | 11 | | | 11 | |
| Total | $ | — | | | $ | — | | | $ | 11 | | | $ | 11 | |
| | | | | | | |
At December 31, 2019 ($ in millions) | | | | | | | |
| Assets | | | | | | | |
| Debt securities | | | | | | | |
| U.S. government and federal agency | $ | — | | | $ | 2,469 | | | $ | — | | | $ | 2,469 | |
| State and municipal | — | | | — | | | 45 | | | 45 | |
| Residential mortgage-backed | — | | | 1,026 | | | — | | | 1,026 | |
| Asset-backed | — | | | 2,371 | | | — | | | 2,371 | |
| | | | | | | |
Other assets(b) | 15 | | | — | | | 21 | | | 36 | |
| Total | $ | 15 | | | $ | 5,866 | | | $ | 66 | | | $ | 5,947 | |
| | | | | | | |
| Liabilities | | | | | | | |
| Contingent consideration | — | | | — | | | 13 | | | 13 | |
| Total | $ | — | | | $ | — | | | $ | 13 | | | $ | 13 | |
_______________________
(a) For the years ended December 31, 2020 and 2019, there were no fair value measurements transferred between levels.
(b) Other assets primarily relate to equity investments measured at fair value.
Level 3 Fair Value Measurements
Our Level 3 recurring fair value measurements primarily relate to state and municipal debt instruments, which are valued using non-binding broker quotes or other third-party sources, CRA equity investments, which are valued using net asset values, as well as contingent consideration obligations. The fair value of our contingent consideration obligations was estimated by applying the income approach based upon significant Level 3 inputs not observable in the market. The range of potential future payments of contingent consideration at December 31, 2020 was between zero and $85 million. The higher end of this range would be payable in the event the future revenues of certain acquired businesses meet all of the required targets during the respective earnout term.
For a description of our process to evaluate third-party pricing servicers, see Note 2. Basis of Presentation and Summary of Significant Accounting Policies. Our state and municipal debt securities are classified as available-for-sale with changes in fair value included in accumulated other comprehensive income.
The changes in our Level 3 assets and liabilities that are measured on a recurring basis for the years ended December 31, 2020 and 2019 were not material.
Financial Assets and Financial Liabilities Carried at Other than Fair Value
| | | | | | | | | | | | | | | | | | | | | | | | | | | | | |
| Carrying | | Corresponding fair value amount |
At December 31, 2020 ($ in millions) | value | | Total | | Level 1 | | Level 2 | | Level 3 |
| Financial Assets | | | | | | | | | |
| Financial assets for which carrying values equal or approximate fair value: | | | | | | | | | |
Cash and equivalents(a) | $ | 11,524 | | | $ | 11,524 | | | $ | 11,524 | | | $ | — | | | $ | — | |
Other assets(a)(b) | $ | 81 | | | $ | 81 | | | $ | 81 | | | $ | — | | | $ | — | |
| Financial assets carried at other than fair value: | | | | | | | | | |
Loan receivables, net(c) | $ | 71,602 | | | $ | 85,234 | | | $ | — | | | $ | — | | | $ | 85,234 | |
Loan receivables held for sale(c) | $ | 5 | | | $ | 5 | | | $ | — | | | $ | — | | | $ | 5 | |
| | | | | | | | | |
| Financial Liabilities | | | | | | | | | |
| Financial liabilities carried at other than fair value: | | | | | | | | | |
| Deposits | $ | 62,782 | | | $ | 63,382 | | | $ | — | | | $ | 63,382 | | | $ | — | |
| Borrowings of consolidated securitization entities | $ | 7,810 | | | $ | 7,977 | | | $ | — | | | $ | 5,680 | | | $ | 2,297 | |
| Senior unsecured notes | $ | 7,965 | | | $ | 8,704 | | | $ | — | | | $ | 8,704 | | | $ | — | |
| | | | | | | | | |
| Carrying | | Corresponding fair value amount |
At December 31, 2019 ($ in millions) | value | | Total | | Level 1 | | Level 2 | | Level 3 |
| Financial Assets | | | | | | | | | |
| Financial assets for which carrying values equal or approximate fair value: | | | | | | | | | |
Cash and equivalents(a) | $ | 12,147 | | | $ | 12,147 | | | $ | 10,799 | | | $ | 1,348 | | | $ | — | |
Other assets(a)(b) | $ | 500 | | | $ | 500 | | | $ | 500 | | | $ | — | | | $ | — | |
| Financial assets carried at other than fair value: | | | | | | | | | |
Loan receivables, net(c) | $ | 81,613 | | | $ | 90,941 | | | $ | — | | | $ | — | | | $ | 90,941 | |
Loan receivables held for sale(c) | $ | 725 | | | $ | 726 | | | $ | — | | | $ | — | | | $ | 726 | |
| | | | | | | | | |
| Financial Liabilities | | | | | | | | | |
| Financial liabilities carried at other than fair value: | | | | | | | | | |
| Deposits | $ | 65,154 | | | $ | 65,544 | | | $ | — | | | $ | 65,544 | | | $ | — | |
| Borrowings of consolidated securitization entities | $ | 10,412 | | | $ | 10,513 | | | $ | — | | | $ | 7,613 | | | $ | 2,900 | |
| Senior unsecured notes | $ | 9,454 | | | $ | 9,924 | | | $ | — | | | $ | 9,924 | | | $ | — | |
_______________________
(a)For cash and equivalents and restricted cash and equivalents, carrying value approximates fair value due to the liquid nature and short maturity of these instruments. Cash equivalents classified as Level 2 represent U.S. Government and Federal Agency debt securities with original maturities of three months or less or acquired within three months or less of their maturity.
(b)This balance relates to restricted cash and equivalents, which is included in other assets.
(c)Under certain retail partner program agreements, the expected sales proceeds in the event of a sale of their credit card portfolio may be limited to the amounts owed by our customers, which may be less than the fair value indicated above.
NOTE 10. REGULATORY AND CAPITAL ADEQUACY
As a savings and loan holding company and a financial holding company, we are subject to regulation, supervision and examination by the Federal Reserve Board and subject to the capital requirements as prescribed by Basel III capital rules and the requirements of the Dodd-Frank Wall Street Reform and Consumer Protection Act. The Bank is a federally chartered savings association. As such, the Bank is subject to regulation, supervision and examination by the Office of the Comptroller of the Currency of the U.S. Treasury (the “OCC”), which is its primary regulator, and by the Consumer Financial Protection Bureau (“CFPB”). In addition, the Bank, as an insured depository institution, is supervised by the FDIC.
Failure to meet minimum capital requirements can initiate certain mandatory and, possibly, additional discretionary actions by regulators that, if undertaken, could limit our business activities and have a material adverse effect on our consolidated financial statements. Under capital adequacy guidelines, we must meet specific capital guidelines that involve quantitative measures of our assets, liabilities and certain off-balance-sheet items as calculated under regulatory accounting practices. The capital amounts and classifications are also subject to qualitative judgments by the regulators about components, risk weightings and other factors.
Quantitative measures established by regulation to ensure capital adequacy require us and the Bank to maintain minimum amounts and ratios (set forth in the table below) of Total, Tier 1 and common equity Tier 1 capital (as defined in the regulations) to risk-weighted assets (as defined), and of Tier 1 capital to average assets (as defined).
For Synchrony Financial to be a well-capitalized savings and loan holding company, the Bank must be well-capitalized and Synchrony Financial must not be subject to any written agreement, order, capital directive, or prompt corrective action directive issued by the Federal Reserve Board to meet and maintain a specific capital level for any capital measure.
In response to the COVID-19 pandemic, in March 2020 the joint federal bank regulatory agencies issued an interim final rule that allows banking organizations that implement CECL in 2020 to mitigate the effects of the CECL accounting standard in their regulatory capital for two years. This two-year delay is in addition to the three-year transition period that the agencies had already made available. The Company has elected to adopt the option provided by the interim final rule, which will largely delay the effects of CECL on its regulatory capital for the next two years, after which the effects will be phased-in over a three-year period from January 1, 2022 through December 31, 2024. Under the interim final rule, the amount of adjustments to regulatory capital deferred until the phase-in period include both the initial impact of our adoption of CECL at January 1, 2020 and 25% of subsequent changes in our allowance for credit losses during each quarter of the two-year period ended December 31, 2021, collectively the “CECL regulatory capital transition adjustment”.
At December 31, 2020 and 2019, Synchrony Financial met all applicable requirements to be deemed well-capitalized pursuant to Federal Reserve Board regulations. At December 31, 2020 and 2019, the Bank also met all applicable requirements to be deemed well-capitalized pursuant to OCC regulations and for purposes of the Federal Deposit Insurance Act. There are no conditions or events subsequent to December 31, 2020 that management believes have changed the Company’s or the Bank’s capital category.
The actual capital amounts, ratios and the applicable required minimums of the Company and the Bank are as follows:
Synchrony Financial
| | | | | | | | | | | | | | | | | | | | | | | |
At December 31, 2020 ($ in millions) | Actual | | Minimum for capital
adequacy purposes |
| Amount | | Ratio(a) | | Amount | | Ratio(b) |
| Total risk-based capital | $ | 14,604 | | | 18.1 | % | | $ | 6,445 | | | 8.0 | % |
| Tier 1 risk-based capital | $ | 13,525 | | | 16.8 | % | | $ | 4,834 | | | 6.0 | % |
| Tier 1 leverage | $ | 13,525 | | | 14.0 | % | | $ | 3,869 | | | 4.0 | % |
| Common equity Tier 1 capital | $ | 12,791 | | | 15.9 | % | | $ | 3,625 | | | 4.5 | % |
| | | | | | | | | | | | | | | | | | | | | | | |
At December 31, 2019 ($ in millions) | Actual | | Minimum for capital
adequacy purposes |
| Amount | | Ratio(a) | | Amount | | Ratio(b) |
| Total risk-based capital | $ | 14,211 | | | 16.3 | % | | $ | 6,984 | | | 8.0 | % |
| Tier 1 risk-based capital | $ | 13,064 | | | 15.0 | % | | $ | 5,238 | | | 6.0 | % |
| Tier 1 leverage | $ | 13,064 | | | 12.6 | % | | $ | 4,161 | | | 4.0 | % |
| Common equity Tier 1 capital | $ | 12,330 | | | 14.1 | % | | $ | 3,929 | | | 4.5 | % |
Synchrony Bank
| | | | | | | | | | | | | | | | | | | | | | | | | | | | | | | | | | | |
At December 31, 2020 ($ in millions) | Actual | | Minimum for capital
adequacy purposes | | Minimum to be well-capitalized under prompt corrective action provisions |
| Amount | | Ratio(a) | | Amount | | Ratio(b) | | Amount | | Ratio |
| Total risk-based capital | $ | 12,784 | | | 17.8 | % | | $ | 5,747 | | | 8.0 | % | | $ | 7,184 | | | 10.0 | % |
| Tier 1 risk-based capital | $ | 11,821 | | | 16.5 | % | | $ | 4,310 | | | 6.0 | % | | $ | 5,747 | | | 8.0 | % |
| Tier 1 leverage | $ | 11,821 | | | 13.6 | % | | $ | 3,484 | | | 4.0 | % | | $ | 4,356 | | | 5.0 | % |
| Common equity Tier 1 capital | $ | 11,821 | | | 16.5 | % | | $ | 3,233 | | | 4.5 | % | | $ | 4,669 | | | 6.5 | % |
| | | | | | | | | | | | | | | | | | | | | | | | | | | | | | | | | | | |
At December 31, 2019 ($ in millions) | Actual | | Minimum for capital
adequacy purposes | | Minimum to be well-capitalized under prompt corrective action provisions |
| Amount | | Ratio(a) | | Amount | | Ratio(b) | | Amount | | Ratio |
| Total risk-based capital | $ | 11,911 | | | 15.6 | % | | $ | 6,094 | | | 8.0 | % | | $ | 7,618 | | | 10.0 | % |
| Tier 1 risk-based capital | $ | 10,907 | | | 14.3 | % | | $ | 4,571 | | | 6.0 | % | | $ | 6,094 | | | 8.0 | % |
| Tier 1 leverage | $ | 10,907 | | | 11.9 | % | | $ | 3,671 | | | 4.0 | % | | $ | 4,589 | | | 5.0 | % |
| Common equity Tier 1 capital | $ | 10,907 | | | 14.3 | % | | $ | 3,428 | | | 4.5 | % | | $ | 4,952 | | | 6.5 | % |
_______________________
(a)Capital ratios are calculated based on the Basel III Standardized Approach rules. Capital amounts and ratios at December 31, 2020 in the above tables reflect the application of the CECL regulatory capital transition adjustment.
(b)At December 31, 2020 and 2019, Synchrony Financial and the Bank also must maintain a capital conservation buffer of common equity Tier 1 capital in excess of minimum risk-based capital ratios by at least 2.5 percentage points to avoid limits on capital distributions and certain discretionary bonus payments to executive officers and similar employees.
The Bank may pay dividends on its stock, with consent or non-objection from the OCC and the Federal Reserve Board, among other things, if its regulatory capital would not thereby be reduced below the applicable regulatory capital requirements.
NOTE 11. EMPLOYEE BENEFIT PLANS
The following summarizes information related to the Synchrony benefit plans and our remaining obligations to General Electric Company and its subsidiaries (“GE”) related to certain of their plans.
Savings Plan
Our U.S. employees are eligible to participate in a qualified defined contribution savings plan that allows them to contribute a portion of their pay to the plan on a pre-tax basis. We make employer contributions to the plan equal to 3% of eligible compensation and make matching contributions of up to 4% of eligible compensation. We also provide certain additional contributions to the plan for employees who were participants in GE's pension plan at the time of Synchrony's separation from GE in November 2015 (the “Separation”). The expenses incurred associated with this plan were $69 million, $69 million and $74 million for the years ended December 31, 2020, 2019 and 2018, respectively.
Health and Welfare Benefits
We provide health and welfare benefits to our employees, including health, dental, prescription drug and vision for which we are self-insured. The expenses incurred associated with these benefits were $107 million, $119 million and $117 million for the years ended December 31, 2020, 2019 and 2018, respectively.
GE Benefit Plans and Reimbursement Obligations
Prior to Separation, our employees participated in various GE retirement and retiree health and life insurance benefit plans. Certain of these retirement benefits vested as a result of Separation. Under the terms of the Employee Matters Agreement between us and GE, GE will continue to pay for these benefits and we are obligated to reimburse them. The principal retirement benefits subject to this arrangement are fixed, life-time annuity payments. The estimated liability for our reimbursement obligations to GE for retiree benefits was $234 million and $210 million at December 31, 2020 and 2019, respectively, and is included in other liabilities in our Consolidated Statement of Financial Position.
NOTE 12. EARNINGS PER SHARE
Basic earnings per share is computed by dividing earnings available to common stockholders by the weighted average number of common shares outstanding for the period. Diluted earnings per common share reflects the assumed conversion of all dilutive securities.
The following table presents the calculation of basic and diluted earnings per common share:
| | | | | | | | | | | | | | | | | |
| Years ended December 31, |
| (in millions, except per share data) | 2020 | | 2019 | | 2018 |
| Net earnings | $ | 1,385 | | | $ | 3,747 | | | $ | 2,790 | |
| Preferred stock dividends | (42) | | | — | | | — | |
| Net earnings available to common stockholders | $ | 1,343 | | | $ | 3,747 | | | $ | 2,790 | |
| | | | | |
| Weighted average common shares outstanding, basic | 589.0 | | | 670.2 | | | 742.3 | |
| Effect of dilutive securities | 1.8 | | | 3.3 | | | 4.6 | |
| Weighted average common shares outstanding, dilutive | 590.8 | | | 673.5 | | | 746.9 | |
| | | | | |
| Earnings per basic common share | $ | 2.28 | | | $ | 5.59 | | | $ | 3.76 | |
| Earnings per diluted common share | $ | 2.27 | | | $ | 5.56 | | | $ | 3.74 | |
We have issued certain stock-based awards under the Synchrony Financial 2014 Long-Term Incentive Plan. A total of 7 million, 3 million and 4 million shares for the years ended December 31, 2020, 2019 and 2018, respectively, related to these awards, were considered anti-dilutive and therefore were excluded from the computation of diluted earnings per common share.
NOTE 13. EQUITY AND OTHER STOCK RELATED INFORMATION
Preferred Stock
The following table summarizes the Company's preferred stock issued and outstanding as of December 31, 2020 and 2019.
| | | | | | | | | | | | | | | | | | | | | | | | | | | | | | | | | | | | | | | | | | | | |
| Series | | Issuance Date | | Redeemable by Issuer Beginning | | Per Annum Dividend Rate | | Liquidation Preference per Share | | Total Shares Outstanding | | December 31, 2020 | | December 31, 2019 |
| ($ in millions, except per share data) | | | | | | | | | | |
Series A(a) | | November 14, 2019 | | November 15, 2024 | | 5.625% | | $1,000 | | 750,000 | | $ | 734 | | | $ | 734 | |
| | | | | | | | | | | | $ | 734 | | | $ | 734 | |
_______________________
(a)Issued as depositary shares, each representing a 1/40th interest in a share of the corresponding series of non-cumulative perpetual preferred stock. Dividends are payable quarterly on February 15, May 15, August 15 and November 15 at a fixed rate, in each case when, as and if declared by the Board of Directors.
Dividends and Share Repurchases
During the years ended December 31, 2020, 2019 and 2018, we declared and paid cash dividends of $0.88, $0.86 and $0.72 per share of common stock, or $520 million, $581 million and $534 million, respectively. In 2019, we issued depositary shares representing $750 million of non-cumulative perpetual preferred stock. We declared and paid preferred stock dividends of $56.40 per share, or $42 million, for the year ended December 31, 2020.
Our previously announced share repurchase program (the "2019 Share Repurchase Program") expired on June 30, 2020. During the year ended December 31, 2020, the Company repurchased an aggregate of 33.6 million shares of our common stock for $1.0 billion under the 2019 Share Repurchase Program. In January 2021, we announced that the Board of Directors approved a new share repurchase program of up to $1.6 billion through December 31, 2021, beginning in the first quarter of 2021 subject to the Company's capital plan, market conditions and other factors, including regulatory restrictions and required approvals, if any.
Synchrony Financial Incentive Programs
We have established the Synchrony Financial 2014 Long-Term Incentive Plan, which we refer to as the “Incentive Plan.” The Incentive Plan permits us to issue stock-based, stock-denominated and other awards to officers, employees, consultants and non-employee directors providing services to the Company and our participating affiliates. Available awards under the Incentive Plan include stock options and stock appreciation rights, restricted stock and restricted stock units (“RSUs”), performance awards and other awards valued in whole or in part by reference to or otherwise based on our common stock (other stock-based awards), and dividend equivalents. Each RSU is convertible into one share of Synchrony Financial common stock. A total of 41.8 million shares of our common stock (including authorized and unissued shares) are available for granting awards under the Incentive Plan.
Our grants generally vest over 3 to 5 year terms on either an annual pro rata proportional basis, starting with the first anniversary of the award date, or at the end of the term of the award on a cliff basis, provided that the employee has remained continuously employed by the Company through such vesting date.
The total compensation expense recorded for these awards was not material for all periods presented. At December 31, 2020, there were 5.8 million RSUs unvested and 6.5 million stock options issued and outstanding and $69 million of total unrecognized compensation cost related to these awards, which is expected to be amortized over a weighted average period of 1.8 years.
NOTE 14. RESTRUCTURING CHARGES
During the year ended December 31, 2020, we initiated a strategic plan to reduce operating expenses which included the exit of a number of our leased properties and certain employee-related actions both on a voluntary and involuntary basis. We recorded $87 million of pre-tax restructuring charges related to these actions in the year ended December 31, 2020. These charges comprised of $46 million of operating lease and other asset impairments, and $41 million of employee-related costs which are included as a component of other expense and employee costs, respectively, in our Consolidated Statements of Earnings. We do not expect to incur further material restructuring charges in connection with our strategic plan.
Restructuring charges incurred were as follows:
| | | | | |
| For the year ended December 31 ($ in millions) | 2020 |
| Non-cash operating lease and other asset impairments | $ | 46 | |
| Employee-related costs | 41 | |
| Total restructuring costs | $ | 87 | |
NOTE 15. INCOME TAXES
Earnings before Provision for Income Taxes
| | | | | | | | | | | | | | | | | |
| For the years ended December 31 ($ in millions) | 2020 | | 2019 | | 2018 |
| U.S. | $ | 1,780 | | | $ | 4,870 | | | $ | 3,628 | |
| Non-U.S. | 17 | | | 17 | | | 16 | |
| Earnings before provision for income taxes | $ | 1,797 | | | $ | 4,887 | | | $ | 3,644 | |
Provision for Income Taxes
| | | | | | | | | | | | | | | | | |
| For the years ended December 31 ($ in millions) | 2020 | | 2019 | | 2018 |
| Current provision for income taxes | | | | | |
| U.S. Federal | $ | 843 | | | $ | 949 | | | $ | 775 | |
| U.S. state and local | 167 | | | 167 | | | 115 | |
| Non-U.S. | 4 | | | 1 | | | 17 | |
| Total current provision for income taxes | 1,014 | | | 1,117 | | | 907 | |
| | | | | |
| Deferred provision (benefit) for income taxes | | | | | |
| U.S. Federal | (486) | | | 19 | | | (55) | |
| U.S. state and local | (115) | | | 2 | | | (7) | |
| Non-U.S. | (1) | | | 2 | | | 9 | |
| Deferred provision (benefit) for income taxes | (602) | | | 23 | | | (53) | |
| Total provision for income taxes | $ | 412 | | | $ | 1,140 | | | $ | 854 | |
Reconciliation of Our Effective Tax Rate to the U.S. Federal Statutory Income Tax Rate
| | | | | | | | | | | | | | | | | |
| For the years ended December 31 | 2020 | | 2019 | | 2018 |
| U.S. federal statutory income tax rate | 21.0 | % | | 21.0 | % | | 21.0 | % |
| U.S. state and local income taxes, net of federal benefit | 3.6 | | | 3.1 | | | 3.2 | |
| | | | | |
| Release of uncertain tax positions, net of federal benefit | (1.7) | | | (0.4) | | | (0.8) | |
| All other, net | — | | | (0.4) | | | — | |
| Effective tax rate | 22.9 | % | | 23.3 | % | | 23.4 | % |
Significant Components of Our Net Deferred Income Taxes
| | | | | | | | | | | |
| At December 31 ($ in millions) | 2020 | | 2019 |
| Assets | | | |
| Allowance for credit losses | $ | 2,559 | | | $ | 1,399 | |
| Compensation and employee benefits | 122 | | | 106 | |
| Other assets | 163 | | | 151 | |
| Total deferred income tax assets before valuation allowance | 2,844 | | | 1,656 | |
| Valuation allowance | — | | | — | |
| Total deferred income tax assets | $ | 2,844 | | | $ | 1,656 | |
| | | |
| Liabilities | | | |
| Original issue discount | $ | (815) | | | $ | (998) | |
| Goodwill and identifiable intangibles | (203) | | | (198) | |
| Software amortization | (107) | | | (82) | |
| Other liabilities | (114) | | | (112) | |
| Total deferred income tax liabilities | (1,239) | | | (1,390) | |
| Net deferred income tax assets | $ | 1,605 | | | $ | 266 | |
Unrecognized Tax Benefits
Reconciliation of Unrecognized Tax Benefits
| | | | | | | | | | | |
| ($ in millions) | 2020 | | 2019 |
| Balance at January 1 | $ | 255 | | | $ | 251 | |
| Additions: | | | |
| Tax positions of the current year | 91 | | | 83 | |
| Tax positions of prior years | 7 | | | 5 | |
| Reductions: | | | |
| Prior year tax positions | (54) | | | (59) | |
| Settlements with tax authorities | (2) | | | (2) | |
| Expiration of the statute of limitation | (29) | | | (23) | |
| Balance at December 31 | $ | 268 | | | $ | 255 | |
| Portion of balance that, if recognized, would impact the effective income tax rate | $ | 183 | | | $ | 172 | |
The amount of unrecognized tax benefits that is reasonably possible to be resolved in the next twelve months is expected to be $107 million, of which, $55 million, if recognized, would reduce the company’s tax expense and effective tax rate. Included in the $107 million of unrecognized benefits are certain temporary differences that would not affect the effective tax rate if they were recognized in the Consolidated Statement of Earnings.
Additionally, there are unrecognized tax benefits of $19 million and $26 million for the years ended December 31, 2020 and 2019, respectively, that are included in the tabular reconciliation above but recorded in the Consolidated Statement of Financial Position as a reduction of the related deferred tax asset.
On February 28, 2020, the Company executed a Memorandum of Understanding with the IRS to participate voluntarily in the IRS Compliance Assurance Process (“CAP”) program for the 2020 tax year, and thus the tax year is under IRS review. Under the CAP program, the IRS reviews the federal tax positions of the Company to identify and resolve any tax issues that may arise throughout the tax year. The objectives of the CAP program are to resolve issues in an efficient and contemporaneous manner and eliminate the need for a lengthy post-filing examination. We expect that the IRS review of our 2020 return will be substantially completed prior to its filing in 2021. During the period, in connection with the CAP program, the IRS provided formal notice of examination of our 2017, 2018 and 2019 tax years. We expect that the IRS will complete the examinations of these periods in the next 12 months. Additionally, we are under examination in various states going back to 2014.
We believe that there are no issues or claims that are likely to significantly impact our results of operations, financial position or cash flows. We further believe that we have made adequate provision for all income tax uncertainties that could result from such examinations.
Interest expense and penalties related to income tax liabilities recognized in our Consolidated Statements of Earnings were not material for all periods presented.
NOTE 16. PARENT COMPANY FINANCIAL INFORMATION
The following tables present parent company financial statements for Synchrony Financial. At December 31, 2020, restricted net assets of our subsidiaries were $10.5 billion.
Condensed Statements of Earnings
| | | | | | | | | | | | | | | | | |
| For the years ended December 31 ($ in millions) | 2020 | | 2019 | | 2018 |
| Interest income: | | | | | |
| Interest income from subsidiaries | $ | 110 | | | $ | 207 | | | $ | 220 | |
| Interest on cash and debt securities | 3 | | | 12 | | | 20 | |
| Total interest income | 113 | | | 219 | | | 240 | |
| Interest expense: | | | | | |
| Interest on senior unsecured notes | 272 | | | 300 | | | 287 | |
| Total interest expense | 272 | | | 300 | | | 287 | |
| Net interest income (expense) | (159) | | | (81) | | | (47) | |
| Dividends from bank subsidiaries | 1,325 | | | 3,900 | | | 950 | |
| Dividends from nonbank subsidiaries | 51 | | | 309 | | | 318 | |
| Other income | 117 | | | 144 | | | 115 | |
| Other expense | 125 | | | 162 | | | 120 | |
| Earnings before benefit from income taxes | 1,209 | | | 4,110 | | | 1,216 | |
| Benefit from income taxes | (42) | | | (19) | | | (8) | |
| Equity in undistributed net earnings (loss) of subsidiaries | 134 | | | (382) | | | 1,566 | |
| Net earnings | $ | 1,385 | | | $ | 3,747 | | | $ | 2,790 | |
| | | | | |
| Comprehensive income | $ | 1,392 | | | $ | 3,764 | | | $ | 2,792 | |
Condensed Statements of Financial Position
| | | | | | | | | | | |
| At December 31 ($ in millions) | 2020 | | 2019 |
| Assets | | | |
| Cash and equivalents | $ | 3,721 | | | $ | 4,491 | |
| Debt securities | 136 | | | 502 | |
Investments in and amounts due from subsidiaries(a) | 15,931 | | | 18,196 | |
| Goodwill | 59 | | | 17 | |
| Other assets | 167 | | | 89 | |
| Total assets | $ | 20,014 | | | $ | 23,295 | |
| | | |
| Liabilities and Equity | | | |
| Amounts due to subsidiaries | $ | 268 | | | $ | 220 | |
| | | |
| Senior unsecured notes | 6,468 | | | 7,461 | |
| | | |
| Accrued expenses and other liabilities | 577 | | | 526 | |
| Total liabilities | 7,313 | | | 8,207 | |
| Equity: | | | |
| Total equity | 12,701 | | | 15,088 | |
| Total liabilities and equity | $ | 20,014 | | | $ | 23,295 | |
_____________
(a) Includes investments in and amounts due from bank subsidiaries of $11.2 billion and $12.9 billion at December 31, 2020 and 2019, respectively.
Condensed Statements of Cash Flows
| | | | | | | | | | | | | | | | | |
| For the years ended December 31 ($ in millions) | 2020 | | 2019 | | 2018 |
| Cash flows - operating activities | | | | | |
| Net earnings | $ | 1,385 | | | $ | 3,747 | | | $ | 2,790 | |
| Adjustments to reconcile net earnings to cash provided from operating activities | | | | | |
| Deferred income taxes | 31 | | | (1) | | | 8 | |
| (Increase) decrease in other assets | (70) | | | 14 | | | 106 | |
| Increase (decrease) in accrued expenses and other liabilities | (41) | | | (15) | | | 6 | |
| Equity in undistributed net (earnings) loss of subsidiaries | (134) | | | 382 | | | (1,566) | |
| All other operating activities | 96 | | | 38 | | | 66 | |
| Cash provided from (used for) operating activities | 1,267 | | | 4,165 | | | 1,410 | |
| | | | | |
| Cash flows - investing activities | | | | | |
| Net (increase) decrease in investments in and amounts due from subsidiaries | 109 | | | 210 | | | 1,687 | |
| Maturity and sales of debt securities | 370 | | | 972 | | | 1,493 | |
| Purchases of debt securities | — | | | (597) | | | (681) | |
| All other investing activities | (10) | | | (100) | | | (94) | |
| Cash provided from (used for) investing activities | 469 | | | 485 | | | 2,405 | |
| | | | | |
| Cash flows - financing activities | | | | | |
| Senior unsecured notes | | | | | |
| Proceeds from issuance of senior unsecured notes | — | | | 1,985 | | | — | |
| Maturities and repayment of senior unsecured notes | (1,000) | | | (2,100) | | | — | |
| Dividends paid on preferred stock | (42) | | | — | | | — | |
| Proceeds from issuance of preferred stock | — | | | 734 | | | — | |
| | | | | |
| | | | | |
| | | | | |
| | | | | |
| | | | | |
| Purchases of treasury stock | (985) | | | (3,618) | | | (1,868) | |
| Dividends paid on common stock | (520) | | | (581) | | | (534) | |
| Increase (decrease) in amounts due to subsidiaries | 45 | | | 28 | | | (4) | |
| All other financing activities | (4) | | | 37 | | | (28) | |
| Cash provided from (used for) financing activities | (2,506) | | | (3,515) | | | (2,434) | |
| | | | | |
| Increase (decrease) in cash and equivalents | (770) | | | 1,135 | | | 1,381 | |
| Cash and equivalents at beginning of year | 4,491 | | | 3,356 | | | 1,975 | |
| Cash and equivalents at end of year | $ | 3,721 | | | $ | 4,491 | | | $ | 3,356 | |
NOTE 17. LEGAL PROCEEDINGS AND REGULATORY MATTERS
In the normal course of business, from time to time, we have been named as a defendant in various legal proceedings, including arbitrations, class actions and other litigation, arising in connection with our business activities. Certain of the legal actions include claims for substantial compensatory and/or punitive damages, or claims for indeterminate amounts of damages. We are also involved, from time to time, in reviews, investigations and proceedings (both formal and informal) by governmental agencies regarding our business (collectively, “regulatory matters”), which could subject us to significant fines, penalties, obligations to change our business practices or other requirements resulting in increased expenses, diminished income and damage to our reputation. We contest liability and/or the amount of damages as appropriate in each pending matter. In accordance with applicable accounting guidance, we establish an accrued liability for legal and regulatory matters when those matters present loss contingencies which are both probable and reasonably estimable.
Legal proceedings and regulatory matters are subject to many uncertain factors that generally cannot be predicted with assurance, and we may be exposed to losses in excess of any amounts accrued.
For some matters, we are able to determine that an estimated loss, while not probable, is reasonably possible. For other matters, including those that have not yet progressed through discovery and/or where important factual information and legal issues are unresolved, we are unable to make such an estimate. We currently estimate that the reasonably possible losses for legal proceedings and regulatory matters, whether in excess of a related accrued liability or where there is no accrued liability, and for which we are able to estimate a possible loss, are immaterial. This represents management’s estimate of possible loss with respect to these matters and is based on currently available information. This estimate of possible loss does not represent our maximum loss exposure. The legal proceedings and regulatory matters underlying the estimate will change from time to time and actual results may vary significantly from current estimates.
Our estimate of reasonably possible losses involves significant judgment, given the varying stages of the proceedings, the existence of numerous yet to be resolved issues, the breadth of the claims (often spanning multiple years), unspecified damages and/or the novelty of the legal issues presented. Based on our current knowledge, we do not believe that we are a party to any pending legal proceeding or regulatory matters that would have a material adverse effect on our consolidated financial condition or liquidity. However, in light of the uncertainties involved in such matters, the ultimate outcome of a particular matter could be material to our operating results for a particular period depending on, among other factors, the size of the loss or liability imposed and the level of our earnings for that period, and could adversely affect our business and reputation.
Below is a description of certain of our regulatory matters and legal proceedings.
Regulatory Matters
On May 9, 2017, the Bank received a Civil Investigative Demand from the CFPB seeking information related to the marketing and servicing of deferred interest promotions. On September 23, 2020, Synchrony received a NORA (Notice of Opportunity to Respond and Advise) letter from the CFPB indicating that the CFPB Office of Enforcement is considering whether to recommend that the CFPB take legal action relating to this matter. On January 15, 2021, the CFPB notified Synchrony that the CFPB Office of Enforcement currently does not intend to recommend that the CFPB take enforcement action related to this matter.
Other Matters
The Bank or the Company is, or has been, defending a number of putative class actions alleging claims under the federal Telephone Consumer Protection Act as a result of phone calls made by the Bank. The complaints generally have alleged that the Bank or the Company placed calls to consumers by an automated telephone dialing system or using a pre-recorded message or automated voice without their consent and seek up to $1,500 for each violation, without specifying an aggregate amount. Campbell et al. v. Synchrony Bank was filed on January 25, 2017 in the U.S. District Court for the Northern District of New York. The original complaint named only J.C. Penney Company, Inc. and J.C. Penney Corporation, Inc. as the defendants but was amended on April 7, 2017 to replace those defendants with the Bank. Neal et al. v. Wal-Mart Stores, Inc. and Synchrony Bank, for which the Bank is indemnifying Wal-Mart, was filed on January 17, 2017 in the U.S. District Court for the Western District of North Carolina. The original complaint named only Wal-Mart Stores, Inc. as a defendant but was amended on March 30, 2017 to add Synchrony Bank as an additional defendant. On October 2, 2020, Synchrony entered an agreement to resolve the Campbell and Neal lawsuits, which had been consolidated before the United States District Court for the Western District of North Carolina, on a class basis. On October 19, 2020, the court entered an order preliminarily approving the class action settlement.
On November 2, 2018, a putative class action lawsuit, Retail Wholesale Department Store Union Local 338 Retirement Fund v. Synchrony Financial, et al., was filed in the U.S. District Court for the District of Connecticut, naming as defendants the Company and two of its officers. The lawsuit asserts violations of the Exchange Act for allegedly making materially misleading statements and/or omitting material information concerning the Company’s underwriting practices and private-label card business, and was filed on behalf of a putative class of persons who purchased or otherwise acquired the Company’s common stock between October 21, 2016 and November 1, 2018. The complaint seeks an award of unspecified compensatory damages, costs and expenses. On February 5, 2019, the court appointed Stichting Depositary APG Developed Markets Equity Pool as lead plaintiff for the putative class. On April 5, 2019, an amended complaint was filed, asserting a new claim for violations of the Securities Act in connection with statements in the offering materials for the Company’s December 1, 2017 note offering. The Securities Act claims are filed on behalf of persons who purchased or otherwise acquired Company bonds in or traceable to the December 1, 2017 note offering between December 1, 2017 and November 1, 2018. The amended complaint names as additional defendants two additional Company officers, the Company’s board of directors, and the underwriters of the December 1, 2017 note offering. The amended complaint is captioned Stichting Depositary APG Developed Markets Equity Pool and Stichting Depositary APG Fixed Income Credit Pool v. Synchrony Financial et al. On March 26, 2020, the District Court recaptioned the case In re Synchrony Financial Securities Litigation and on March 31, 2020, the District Court granted the defendants’ motion to dismiss the complaint with prejudice. On April 20, 2020, plaintiffs filed a notice to appeal the decision to the United States Court of Appeal for the Second Circuit.
On January 28, 2019, a purported shareholder derivative action, Gilbert v. Keane, et al., was filed in the U.S. District Court for the District of Connecticut against the Company as a nominal defendant, and certain of the Company’s officers and directors. The lawsuit alleges breach of fiduciary duty claims based on the allegations raised by the plaintiff in the Stichting Depositar APG class action, unjust enrichment, waste of corporate assets, and that the defendants made materially misleading statements and/or omitted material information in violation of the Exchange Act. The complaint seeks a declaration that the defendants breached and/or aided and abetted the breach of their fiduciary duties to the Company, unspecified monetary damages with interest, restitution, a direction that the defendants take all necessary actions to reform and improve corporate governance and internal procedures, and attorneys’ and experts’ fees. On March 11, 2019, a second purported shareholder derivative action, Aldridge v. Keane, et al., was filed in the U.S. District Court for the District of Connecticut. The allegations in the Aldridge complaint are substantially similar to those in the Gilbert complaint. On March 26, 2020, the District Court recaptioned the Gilbert and Aldridge cases as In re Synchrony Financial Derivative Litigation.
On April 30, 2014 Belton et al. v. GE Capital Consumer Lending, a putative class action adversary proceeding was filed in the U.S. Bankruptcy Court for the Southern District of New York. Plaintiff alleges that the Bank violates the discharge injunction under Section 524(a)(2) of the Bankruptcy Code by attempting to collect discharged debts and by failing to update and correct credit information to credit reporting agencies to show that such debts are no longer due and owing because they have been discharged in bankruptcy. Plaintiff seeks declaratory judgment, injunctive relief and an unspecified amount of damages. On December 15, 2014, the Bankruptcy Court entered an order staying the adversary proceeding pending an appeal to the District Court of the Bankruptcy Court’s order denying the Bank’s motion to compel arbitration. On October 14, 2015, the District Court reversed the Bankruptcy Court and on November 4, 2015, the Bankruptcy Court granted the Bank’s motion to compel arbitration. On March 4, 2019, on plaintiff’s motion for reconsideration, the District Court vacated its decision reversing the Bankruptcy Court and affirmed the Bankruptcy Court’s decision denying the Bank’s motion to compel arbitration. On June 16, 2020, the Court of Appeals for the Second Circuit denied the Bank’s appeal of the District Court’s decision.
Controls and Procedures
____________________________________________________________________________________________
Evaluation of Disclosure Controls and Procedures
Under the direction of our Chief Executive Officer and Chief Financial Officer, we evaluated the effectiveness of our disclosure controls and procedures (as defined in Rules 13a-15(e) and 15d-15(e) under the Exchange Act), and based on such evaluation, our Chief Executive Officer and Chief Financial Officer concluded that our disclosure controls and procedures were effective as of December 31, 2020.
Changes in Internal Control Over Financial Reporting
There was no change in internal control over financial reporting that occurred during the fiscal quarter ended December 31, 2020 that has materially affected, or is reasonably likely to materially affect, our internal control over financial reporting.
Report on Management's Assessment of Internal Control Over Financial Reporting
The management of Synchrony Financial (“the Company”) is responsible for establishing and maintaining adequate internal control over financial reporting for the Company as defined by Exchange Act Rules 13a-15 and 15d-15. The Company's internal control over financial reporting is designed to provide reasonable assurance regarding the reliability of financial reporting and the preparation of financial statements for external reporting purposes in accordance with U.S. generally accepted accounting principles. The Company's internal control over financial reporting includes those policies and procedures that (i) pertain to the maintenance of records that in reasonable detail accurately and fairly reflect the transactions and dispositions of the Company's assets; (ii) provide reasonable assurance that transactions are recorded as necessary to permit preparation of financial statements in accordance with generally accepted accounting principles, and that the Company's receipts and expenditures are made only in accordance with authorizations of the Company's management and directors; and (iii) provide reasonable assurance regarding prevention or timely detection of unauthorized acquisition, use or disposition of the Company's assets that could have a material effect on its financial statements.
Because of its inherent limitations, internal control over financial reporting may not prevent or detect misstatements. Also, projections of any evaluation of effectiveness to future periods are subject to the risk that controls may become inadequate because of changes in conditions, or that the degree of compliance with the policies or procedures may deteriorate. Although any system of internal control can be compromised by human error or intentional circumvention of required procedures, we believe our system provides reasonable assurance that financial transactions are recorded and reported properly, providing an adequate basis for reliable financial statements.
The Company’s management has used the criteria established in Internal Control - Integrated Framework (2013 framework) issued by the Committee of Sponsoring Organizations of the Treadway Commission (“COSO”) to evaluate the effectiveness of the Company’s internal control over financial reporting.
The Company’s management has assessed the effectiveness of the Company’s internal control over financial reporting as of December 31, 2020 and has concluded that such internal control over financial reporting is effective. There are no material weaknesses in the Company’s internal control over financial reporting that have been identified by the Company’s management.
KPMG LLP, an independent registered public accounting firm, has audited the consolidated financial statements of the Company for the year ended December 31, 2020 and has also issued an audit report, which is included in "Consolidated Financial Statements and Supplementary Data” of this Form 10-K Report, on internal control over financial reporting as of December 31, 2020 under Auditing Standard No. 2201 of the Public Company Accounting Oversight Board (“PCAOB”).
OTHER KEY INFORMATION
Properties
____________________________________________________________________________________________
Our corporate headquarters are located on a site in Stamford, Connecticut that we lease from a third party.
In addition to those set forth below, we maintain small offices at a few of our U.S. partner locations pursuant to servicing, lease or license agreements.
We believe our space is adequate for our current needs and that suitable additional or substitute space will be available to accommodate the foreseeable expansion of our operations.
The table below sets out selected information on our principal facilities.
| | | | | | | | |
Location(a) | | Owned/Leased |
| Corporate Headquarters: | | |
| Stamford, CT | | Leased |
| | |
| Bank Headquarters: | | |
| Draper, UT | | Leased |
| | |
| | |
| Customer Service Centers: | | |
| Altamonte Springs, FL | | Leased |
| Canton, OH | | Leased |
| Charlotte, NC | | Leased |
| Hyderabad, India | | Leased |
| Manila, Philippines | | Leased |
| Cebu, Philippines | | Leased |
| Merriam, KS | | Owned |
| Phoenix, AZ | | Leased |
| | |
| Other Support Centers: | | |
| Alpharetta, GA | | Leased |
| Bentonville, AR | | Leased |
| Boise, ID | | Leased |
| Champaign, IL | | Leased |
| Chicago, IL | | Leased |
| Costa Mesa, CA | | Leased |
| New York, NY | | Leased |
| San Francisco, CA | | Leased |
| St. Paul, MN | | Leased |
_______________________
(a)At September 30, 2020, several sites transitioned to virtual hubs (no longer have a physical location), including three customer service centers.
Market for Registrant's Common Equity, Related Stockholder Matters and Issuer Purchases of Equity Securities
____________________________________________________________________________________________
Market Information
Our common stock trades on the New York Stock Exchange under the symbol “SYF.”
The following table reflects the cash dividends we declared for the periods indicated.
| | | | | |
| Cash dividends declared |
| ($ in dollars) |
| 2020 | |
| Fourth quarter | $ | 0.22 | |
| Third quarter | $ | 0.22 | |
| Second quarter | $ | 0.22 | |
| First quarter | $ | 0.22 | |
| |
| 2019 | |
| Fourth quarter | $ | 0.22 | |
| Third quarter | $ | 0.22 | |
| Second quarter | $ | 0.21 | |
| First quarter | $ | 0.21 | |
Holders
At February 8, 2021, the approximate number of holders of record of common stock was 2,550.
Dividends
Dividend Policy. The declaration and payment of any future dividends to holders of our common or preferred stock or stock repurchases will be at the discretion of Synchrony's Board of Directors and will depend on many factors, including the financial condition, earnings, capital and liquidity requirements of us and the Bank, applicable regulatory restrictions, corporate law and contractual restrictions and other factors that the Board of Directors deems relevant.
As a savings and loan holding company, our ability to pay dividends to our stockholders or to repurchase our stock is subject to regulation by the Federal Reserve Board. In addition, as a holding company, we rely significantly on dividends, distributions and other payments from the Bank to fund dividends to our stockholders. The ability of the Bank to make dividends and other distributions and payments to us is subject to regulation by the OCC and the Federal Reserve Board. See “Regulation—Risk Factors Relating to Regulation—Failure by Synchrony and the Bank to meet applicable capital adequacy and liquidity requirements could have a material adverse effect on us” and “—We are subject to restrictions that limit our ability to pay dividends and repurchase our common stock; the Bank is subject to restrictions that limit its ability to pay dividends to us, which could limit our ability to pay dividends, repurchase our common stock or make payments on our indebtedness.”
Performance Graph
The following graph compares the cumulative total stockholders return (rounded to the nearest whole dollar) of the Company's common stock, the S&P 500 Stock Index and the S&P 500 Financials Index for the period from December 31, 2015 through December 31, 2020. The graph assumes an initial investment of $100 on December 31, 2015. The cumulative returns for the Company's common stock and financial indices assume full reinvestment of dividends. This graph does not forecast future performance of the Company's common stock.
| | | | | | | | | | | | | | | | | | | | | | | | | | | | | | | | | | | | | | |
| | December 31, 2015 | | December 31, 2016 | | December 31, 2017 | | December 31, 2018 | | December 31, 2019 | | December 31, 2020 |
| Synchrony Financial | | $ | 100.00 | | | $ | 120.38 | | | $ | 130.44 | | | $ | 81.13 | | | $ | 127.76 | | | $ | 123.15 | |
| S&P 500 | | $ | 100.00 | | | $ | 111.96 | | | $ | 136.40 | | | $ | 130.42 | | | $ | 171.49 | | | $ | 203.04 | |
| S&P 500 Financials | | $ | 100.00 | | | $ | 122.80 | | | $ | 150.04 | | | $ | 130.49 | | | $ | 172.40 | | | $ | 169.49 | |
Issuer Purchases of Equity Securities
The table below sets forth information regarding purchases of our common stock primarily related to our share repurchase program that were made by us or on our behalf during the three months ended December 31, 2020.
| | | | | | | | | | | | | | | | | | | | | | | |
| ($ in millions, except per share data) | Total Number of Shares Purchased(a) | | Average Price Paid Per Share(b) | | Total Number of Shares Purchased as Part of Publicly Announced Program(c) | | Maximum Dollar Value of Shares That May Yet Be Purchased Under the Program(b) |
October 1 - 31, 2020 | 7,692 | | | $ | 27.25 | | | — | | | $ | — | |
November 1 - 30, 2020 | 4 | | | $ | 28.87 | | | — | | | $ | — | |
December 1 - 31, 2020 | 54 | | | $ | 32.29 | | | — | | | $ | — | |
| Total | 7,750 | | | $ | 27.29 | | | — | | | $ | — | |
_______________________
(a)Includes 7,692 shares, 4 shares and 54 shares withheld in October, November and December, respectively, to offset tax withholding obligations that occur upon the delivery of outstanding shares underlying performance stock awards, restricted stock awards or upon the exercise of stock options.
(b)Amounts exclude commission costs.
(c)In January 2021, we announced that the Board of Directors approved a new share repurchase program of up to $1.6 billion through December 31, 2021, beginning in the first quarter of 2021.
Exhibits and Financial Statement Schedules
____________________________________________________________________________________________
(a) Documents filed as part of this Form 10-K:
1. Consolidated Financial Statements
The consolidated financial statements required to be filed in this annual report on Form 10-K are listed below and appear herein on the pages indicated.
INDEX TO CONSOLIDATED FINANCIAL STATEMENTS
| | | | | |
| Reports of Independent Registered Public Accounting Firm | |
Consolidated Statements of Earnings for the years ended December 31, 2020, 2019 and 2018 | |
Consolidated Statements of Comprehensive Income for the years ended December 31, 2020, 2019 and 2018 | |
Consolidated Statements of Financial Position as of December 31, 2020 and 2019 | |
Consolidated Statements of Changes in Equity for the years ended December 31, 2020, 2019 and 2018 | |
Consolidated Statements of Cash Flows for the years ended December 31, 2020, 2019 and 2018 | |
| Notes to the Consolidated Financial Statements | |
2. Financial Statement Schedules
Separate financial statement schedules have been omitted either because they are not applicable or because the required information is included in the consolidated financial statements.
3. Exhibits
A list of the exhibits being filed or furnished with or incorporated by reference into this annual report on Form 10-K is provided below:
EXHIBIT INDEX
| | | | | |
| Exhibit Number | Description |
| |
| |
| |
| |
| |
| |
| |
| |
| |
| |
| | | | | |
| |
| |
| |
| |
| |
| |
| |
| |
| |
| |
| |
| |
| |
| |
| |
| |
| |
| Omnibus Amendment No. 1 to Securitization Documents, dated as of February 9, 2004, among RFS Holding, L.L.C., RFS Funding Trust, GE Capital Retail Bank (formerly known as Monogram Credit Card Bank of Georgia), Synchrony Credit Card Master Note Trust, Deutsche Bank Trust Company Delaware, as Trustee of RFS Funding Trust, RFS Holding, Inc. and Deutsche Bank Trust Company Americas, as Indenture Trustee (incorporated by reference to Exhibit 4.16 of Amendment No. 1 to Form S-3 Registration Statement filed by Synchrony Credit Card Master Note Trust and RFS Holding, L.L.C. on May 20, 2004 (No. 333-107495, 333-107495-01 and 333-107495-02)) |
| |
| | | | | |
| |
| |
| |
| |
| |
| |
| |
| |
| |
| |
| Eighth Amendment to Receivables Sale Agreement, dated as of March 20, 2012, among GE Capital Retail Bank, RFS Holding, Inc., PLT Holding, L.L.C. and RFS Holding, L.L.C. (incorporated by reference to Exhibit 4.1 of the current report on Form 8-K filed by Synchrony Credit Card Master Note Trust and RFS Holding, L.L.C. on March 21, 2012) |
| Ninth Amendment to Receivables Sale Agreement, dated as of March 11, 2014, among GE Capital Retail Bank, RFS Holding, Inc., PLT Holding, L.L.C. and RFS Holding, L.L.C. (incorporated by reference to Exhibit 4.2 of the current report on Form 8-K filed by Synchrony Credit Card Master Note Trust and RFS Holding, L.L.C. on March 14, 2014) |
| |
| |
| |
| | | | | |
| |
| |
| |
| 101.INS | XBRL Instance Document - the instance document does not appear in the Interactive Data File because its XBRL tags are embedded within the Inline XBRL document |
| 101.SCH | XBRL Taxonomy Extension Schema Document |
| 101.CAL | XBRL Taxonomy Extension Calculation Linkbase Document |
| 101.DEF | XBRL Taxonomy Extension Definition Linkbase Document |
| 101.LAB | XBRL Taxonomy Extension Label Linkbase Document |
| 101.PRE | XBRL Taxonomy Extension Presentation Linkbase Document |
| 104 | The cover page from the Company's Annual Report on Form 10-K for the year ended December 31, 2020, formatted in Inline XBRL (included as Exhibit 101) |
______________________
*Filed electronically herewith.
†Confidential treatment granted to certain portions, which portions have been provided separately to the Securities and Exchange Commission.
+ Management contract or compensatory plan or arrangement required to be filed as an exhibit to Form 10-K pursuant to Item 15(b) of this report.
Signatures
Pursuant to the requirements of Section 13 or 15(d) of the Securities Exchange Act of 1934, the registrant has duly caused this annual report on Form 10-K for the fiscal year ended December 31, 2020, to be signed on its behalf by the undersigned, and in the capacity indicated, thereunto duly authorized in the City of Stamford and State of Connecticut on the 11th day of February 2021.
Synchrony Financial
(Registrant)
| | | | | | | | |
| | /s/ Brian J. Wenzel Sr. |
| | Brian J. Wenzel Sr.
Executive Vice President and Chief Financial Officer
(Duly Authorized Officer and Principal Financial Officer) |
Power of Attorney
Each person whose signature appears below hereby constitutes and appoints Margaret M. Keane, Brian D. Doubles and Jonathan S. Mothner, and each of them acting individually, as his or her true and lawful attorneys-in-fact and agents, with full power of substitution and resubstitution, to execute for him or her and in his or her name, place and stead, in any and all capacities, any and all amendments to this annual report on Form 10-K, and to file the same, with all exhibits thereto and any other documents required in connection therewith with the Securities and Exchange Commission, granting unto said attorneys-in-fact and agents and their substitutes, and each of them, full power and authority to do and perform each and every act and thing requisite and necessary to be done in connection therewith, as fully as he or she might or could do in person, hereby ratifying and confirming all that said attorneys-in-fact and agents, or any of them, or their or his or her substitutes, may lawfully do or cause to be done by virtue hereof.
Pursuant to the requirements of the Securities Exchange Act of 1934, this report has been signed below by the following persons on behalf of the registrant and in the capacities and on the dates indicated.
| | | | | | | | | | | |
| Signature | | Title | Date |
| | | |
| /s/ Margaret M. Keane | | Principal Executive Officer
Director | February 11, 2021 |
Margaret M. Keane
Director and Chief Executive Officer | | | |
| | | |
| /s/ Brian J. Wenzel Sr. | | Principal Financial Officer | February 11, 2021 |
Brian J. Wenzel Sr.
Executive Vice President and Chief Financial Officer
(Duly Authorized Officer and Principal Financial Officer) | | | |
| | | |
| /s/ David P. Melito | | Principal Accounting Officer | February 11, 2021 |
David P. Melito
Senior Vice President and Controller | | | |
| | | |
| /s/ Fernando Aguirre | | Director | February 11, 2021 |
| Fernando Aguirre | | | |
| | | |
| /s/ Paget L. Alves | | Director | February 11, 2021 |
Paget L. Alves
| | | |
| | | |
| /s/ Arthur W. Coviello, Jr. | | Director | February 11, 2021 |
Arthur W. Coviello, Jr.
| | | |
| | | |
| /s/ William W. Graylin | | Director | February 11, 2021 |
William W. Graylin
| | | |
| | | |
| /s/ Roy A. Guthrie | | Director | February 11, 2021 |
| Roy A. Guthrie | | | |
| | | |
| /s/ Richard C. Hartnack | | Director | February 11, 2021 |
| Richard C. Hartnack | | | |
| | | |
| /s/ Jeffrey G. Naylor | | Director | February 11, 2021 |
Jeffrey G. Naylor
| | | |
| | | |
| /s/ P.W. Parker | | Director | February 11, 2021 |
| P.W. Parker | | | |
| | | |
| /s/ Laurel J. Richie | | Director | February 11, 2021 |
Laurel J. Richie
| | | |
| | | |
| /s/ Olympia J. Snowe | | Director | February 11, 2021 |
Olympia J. Snowe
| | | |
| | | |
| /s/ Ellen M. Zane | | Director | February 11, 2021 |
| Ellen M. Zane | | | |
| | | |