Exhibit 99.1 Investor Supplement With Sales Platform Presentations June 20, 2019
Disclaimers Cautionary Statement Regarding Forward-Looking Statements This presentation contains certain forward-looking statements as defined in Section 27A of the Securities Act of 1933, as amended, and Section 21E of the Securities Exchange Act of 1934, as amended, which are subject to the “safe harbor” created by those sections. Forward-looking statements are based on management's current expectations and assumptions, and are subject to inherent uncertainties, risks and changes in circumstances that are difficult to predict. As a result, actual results could differ materially from those indicated in these forward-looking statements. Factors that could cause actual results to differ materially include global political, economic, business, competitive, market, regulatory and other factors and risks, such as: the impact of macroeconomic conditions and whether industry trends we have identified develop as anticipated; retaining existing partners and attracting new partners, concentration of our revenue in a small number of Retail Card partners, promotion and support of our products by our partners, and financial performance of our partners; cyber-attacks or other security breaches; higher borrowing costs and adverse financial market conditions impacting our funding and liquidity, and any reduction in our credit ratings; our ability to grow our deposits in the future; our ability to securitize our loan receivables, occurrence of an early amortization of our securitization facilities, loss of the right to service or subservice our securitized loan receivables, and lower payment rates on our securitized loan receivables; changes in market interest rates and the impact of any margin compression; effectiveness of our risk management processes and procedures, reliance on models which may be inaccurate or misinterpreted, our ability to manage our credit risk, the sufficiency of our allowance for loan losses and the accuracy of the assumptions or estimates used in preparing our financial statements; our ability to offset increases in our costs in retailer share arrangements; competition in the consumer finance industry; our concentration in the U.S. consumer credit market; our ability to successfully develop and commercialize new or enhanced products and services; our ability to realize the value of acquisitions and strategic investments; reductions in interchange fees; fraudulent activity; failure of third parties to provide various services that are important to our operations; disruptions in the operations of our computer systems and data centers; international risks and compliance and regulatory risks and costs associated with international operations; alleged infringement of intellectual property rights of others and our ability to protect our intellectual property; litigation and regulatory actions; damage to our reputation; our ability to attract, retain and motivate key officers and employees; tax legislation initiatives or challenges to our tax positions and/or interpretations, and state sales tax rules and regulations; a material indemnification obligation to GE under the Tax Sharing and Separation Agreement with GE if we cause the split-off from GE or certain preliminary transactions to fail to qualify for tax-free treatment or in the case of certain significant transfers of our stock following the split-off; regulation, supervision, examination and enforcement of our business by governmental authorities, the impact of the Dodd-Frank Wall Street Reform and Consumer Protection Act and the impact of the Consumer Financial Protection Bureau’s regulation of our business; impact of capital adequacy rules and liquidity requirements; restrictions that limit our ability to pay dividends and repurchase our common stock, and restrictions that limit the Synchrony Bank’s ability to pay dividends to us; regulations relating to privacy, information security and data protection; use of third-party vendors and ongoing third-party business relationships; and failure to comply with anti-money laundering and anti-terrorism financing laws. For the reasons described above, we caution you against relying on any forward-looking statements, which should also be read in conjunction with the other cautionary statements that are included elsewhere in this presentation and in our public filings, including under the heading “Risk Factors” in the Company's Annual Report on Form 10-K for the fiscal year ended December 31, 2018, as filed on February 15, 2019. You should not consider any list of such factors to be an exhaustive statement of all of the risks, uncertainties, or potentially inaccurate assumptions that could cause our current expectations or beliefs to change. Further, any forward-looking statement speaks only as of the date on which it is made, and we undertake no obligation to update or revise any forward-looking statement to reflect events or circumstances after the date on which the statement is made or to reflect the occurrence of unanticipated events, except as otherwise may be required by law. Non-GAAP Measures The information provided herein includes a financial measure that is not prepared in accordance with U.S. generally accepted accounting principles (“GAAP”). We refer to “managed-basis” as presenting certain loan performance measures as if loans sold by us to our securitization trusts were never sold and derecognized in our GAAP financial statements. We believe it is useful to consider these performance measures on a managed-basis for 2009 when comparing to similar GAAP measures in later years since we serviced the securitized and owned loans, and related accounts, in the same manner without regard to ownership of the loans. The reconciliation of the managed-basis loan performance measures in this presentation to the comparable GAAP measures for the twelve months ended December 31, 2009 is included at the end of this presentation in “Appendix-Non-GAAP Reconciliations.” 2
Synchrony Financial Overview Leading Consumer Finance Business • A leading Private Label Credit Card (PLCC) provider in US • A leader in financing for major consumer purchases and healthcare services • Long-standing and diverse partner base Strong Value Proposition for Partners & Consumers • Advanced data analytics and targeted marketing capabilities • Dedicated team members support partners to help maximize program effectiveness • Enhanced sales growth and additional economic benefits for partners • Access to instant credit, promotional financing, and rewards for customers Robust Data and Technology Capabilities • Deep partner integration enables customized loyalty products across channels • Partner and cardholder focused mobile payments and e-commerce solutions • Leveraging digital, loyalty, and analytics capabilities to augment growth Attractive Growth and Ample Opportunities • Strong receivables growth • Significant opportunity to leverage long-standing partnerships to increase penetration • Opportunity to attract new partners • Developing broad product suite to build a leading, full-scale online bank Strong Financial Profile and Operating Performance • Solid fundamentals with attractive returns • Strong capital and liquidity with diverse funding profile 3
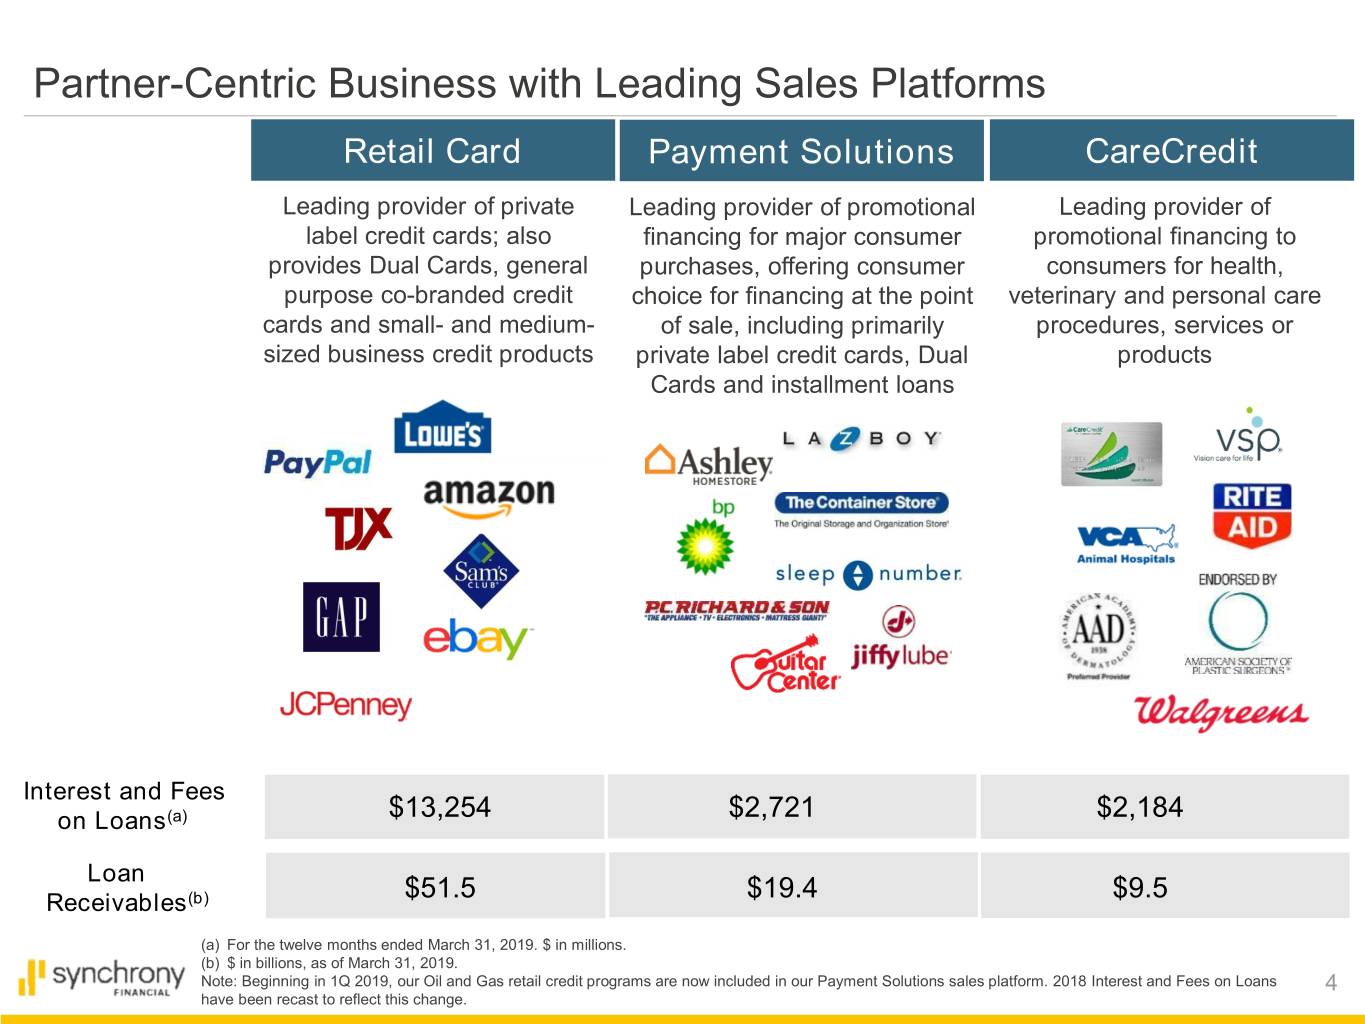
Partner-Centric Business with Leading Sales Platforms Retail Card Payment Solutions CareCredit Leading provider of private Leading provider of promotional Leading provider of label credit cards; also financing for major consumer promotional financing to provides Dual Cards, general purchases, offering consumer consumers for health, purpose co-branded credit choice for financing at the point veterinary and personal care cards and small- and medium- of sale, including primarily procedures, services or sized business credit products private label credit cards, Dual products Cards and installment loans Interest and Fees on Loans(a) $13,254 $2,721 $2,184 Loan $51.5 $19.4 $9.5 Receivables(b) (a) For the twelve months ended March 31, 2019. $ in millions. (b) $ in billions, as of March 31, 2019. Note: Beginning in 1Q 2019, our Oil and Gas retail credit programs are now included in our Payment Solutions sales platform. 2018 Interest and Fees on Loans 4 have been recast to reflect this change.
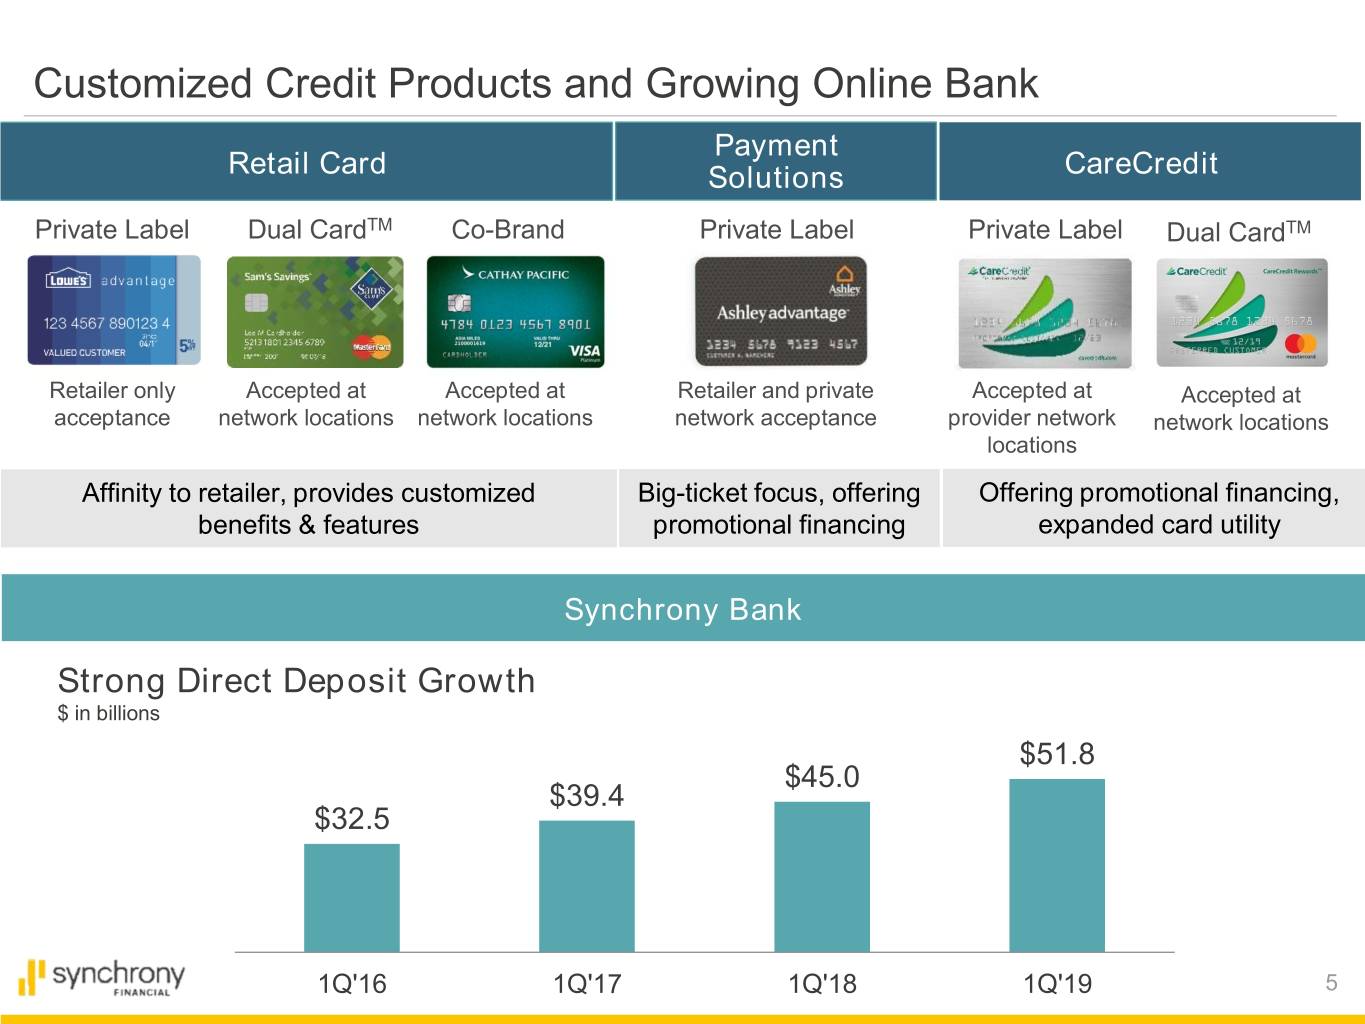
Customized Credit Products and Growing Online Bank Payment Retail Card Solutions CareCredit Private Label Dual CardTM Co-Brand Private Label Private Label Dual CardTM Retailer only Accepted at Accepted at Retailer and private Accepted at Accepted at acceptance network locations network locations network acceptance provider network network locations locations Affinity to retailer, provides customized Big-ticket focus, offering Offering promotional financing, benefits & features promotional financing expanded card utility Synchrony Bank Strong Direct Deposit Growth $ in billions $51.8 $45.0 $39.4 $32.5 1Q'16 1Q'17 1Q'18 1Q'19 5
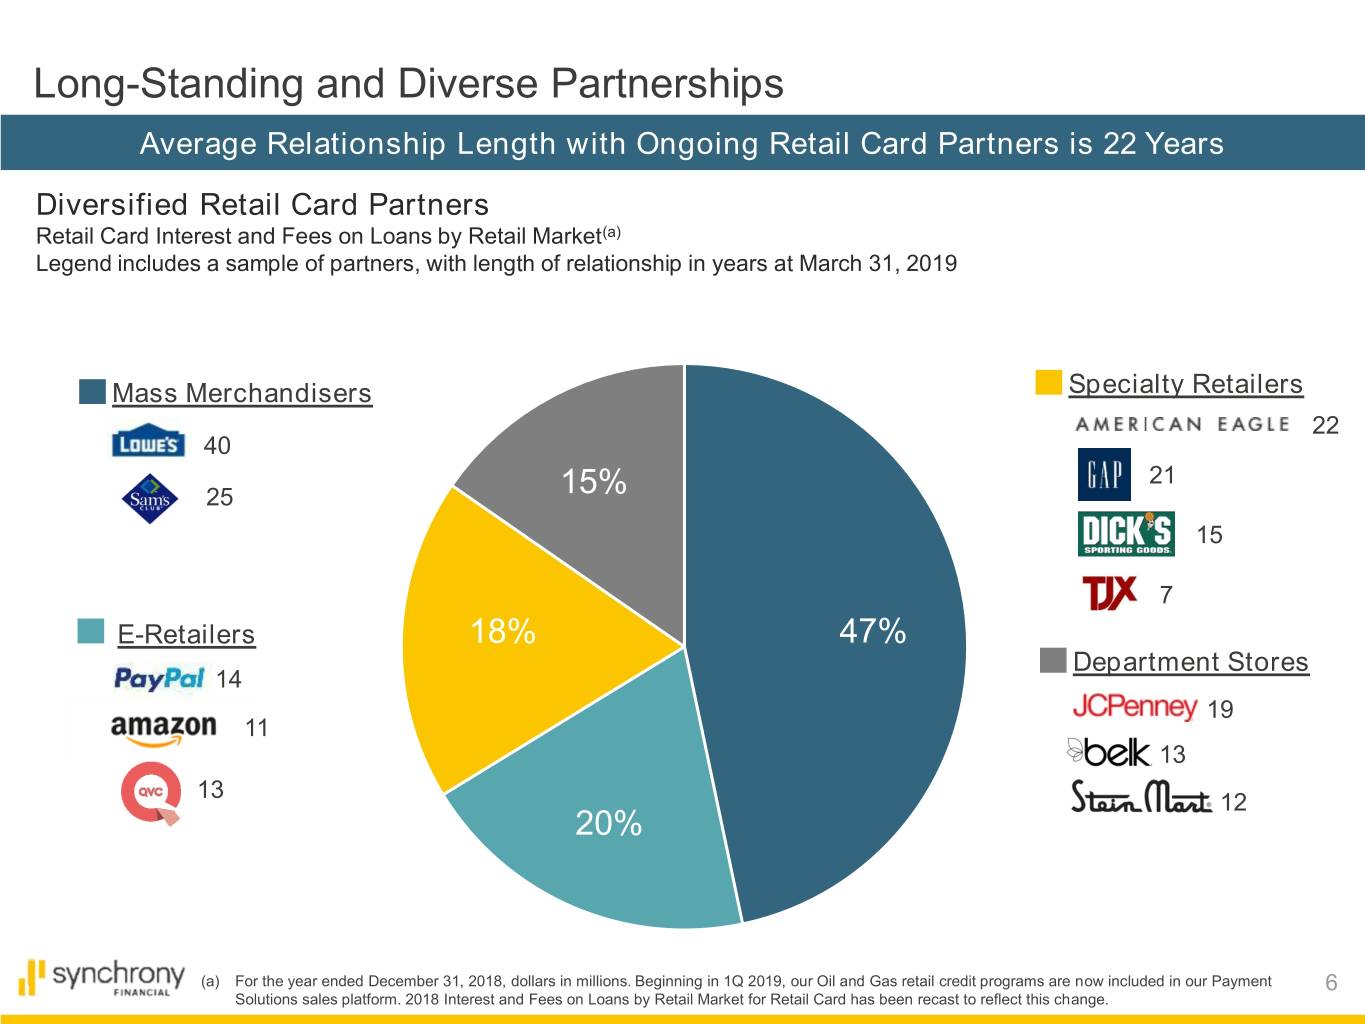
Long-Standing and Diverse Partnerships Average Relationship Length with Ongoing Retail Card Partners is 22 Years Diversified Retail Card Partners Retail Card Interest and Fees on Loans by Retail Market(a) Legend includes a sample of partners, with length of relationship in years at March 31, 2019 Mass Merchandisers Specialty Retailers 22 40 21 25 15% 15 7 E-Retailers 18% 47% Department Stores 14 19 11 13 13 12 20% (a) For the year ended December 31, 2018, dollars in millions. Beginning in 1Q 2019, our Oil and Gas retail credit programs are now included in our Payment 6 Solutions sales platform. 2018 Interest and Fees on Loans by Retail Market for Retail Card has been recast to reflect this change.
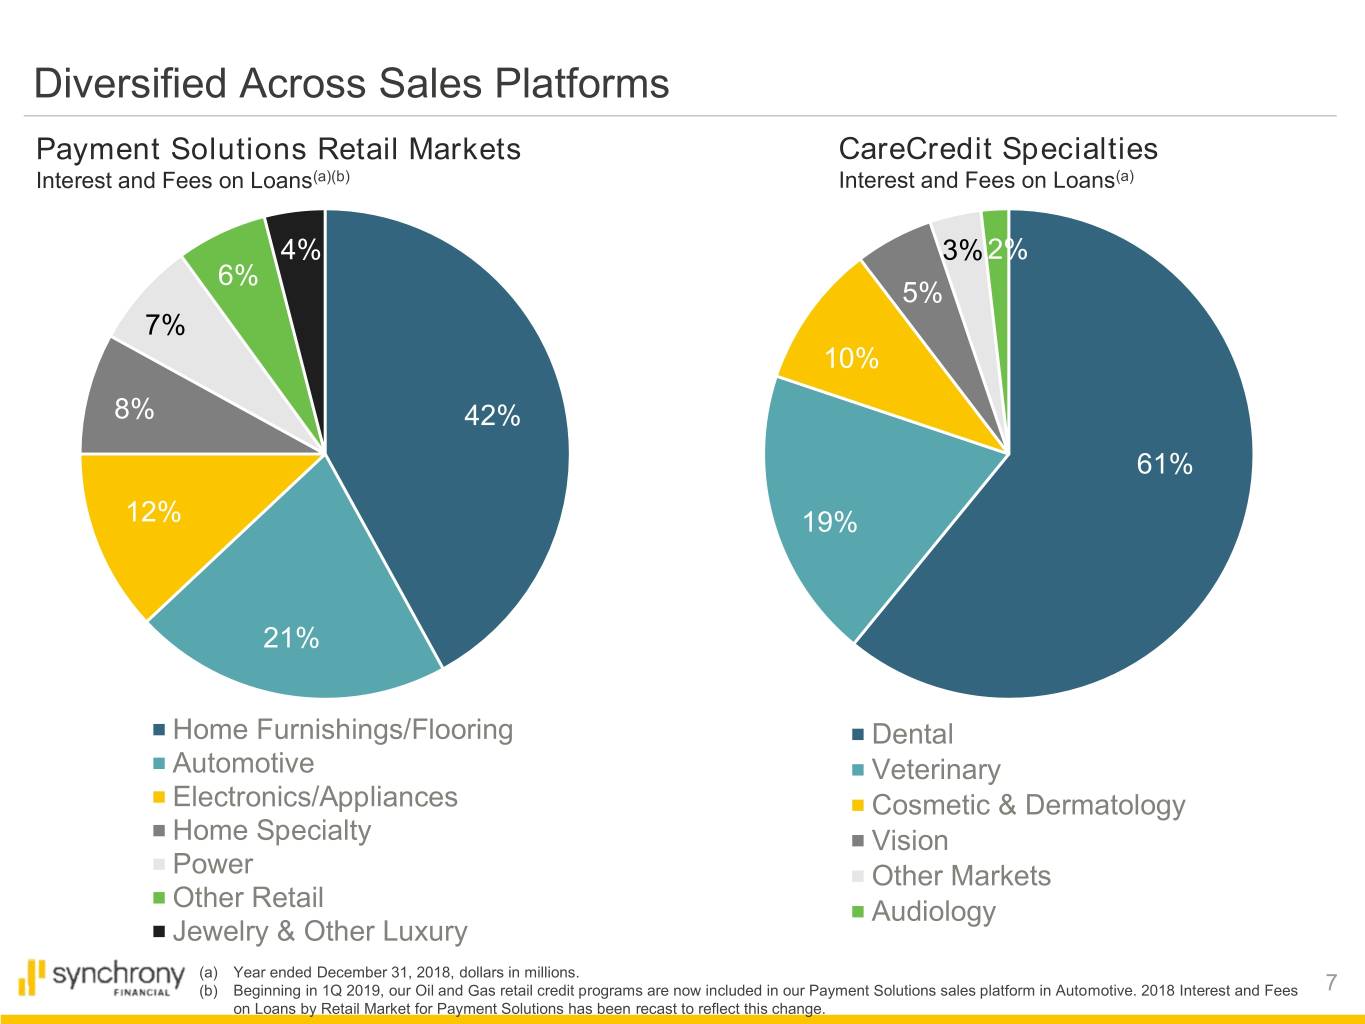
Diversified Across Sales Platforms Payment Solutions Retail Markets CareCredit Specialties Interest and Fees on Loans(a)(b) Interest and Fees on Loans(a) 4% 3% 2% 6% 5% 7% 10% 8% 42% 61% 12% 19% 21% Home Furnishings/Flooring Dental Automotive Veterinary Electronics/Appliances Cosmetic & Dermatology Home Specialty Vision Power Other Markets Other Retail Audiology Jewelry & Other Luxury (a) Year ended December 31, 2018, dollars in millions. (b) Beginning in 1Q 2019, our Oil and Gas retail credit programs are now included in our Payment Solutions sales platform in Automotive. 2018 Interest and Fees 7 on Loans by Retail Market for Payment Solutions has been recast to reflect this change.
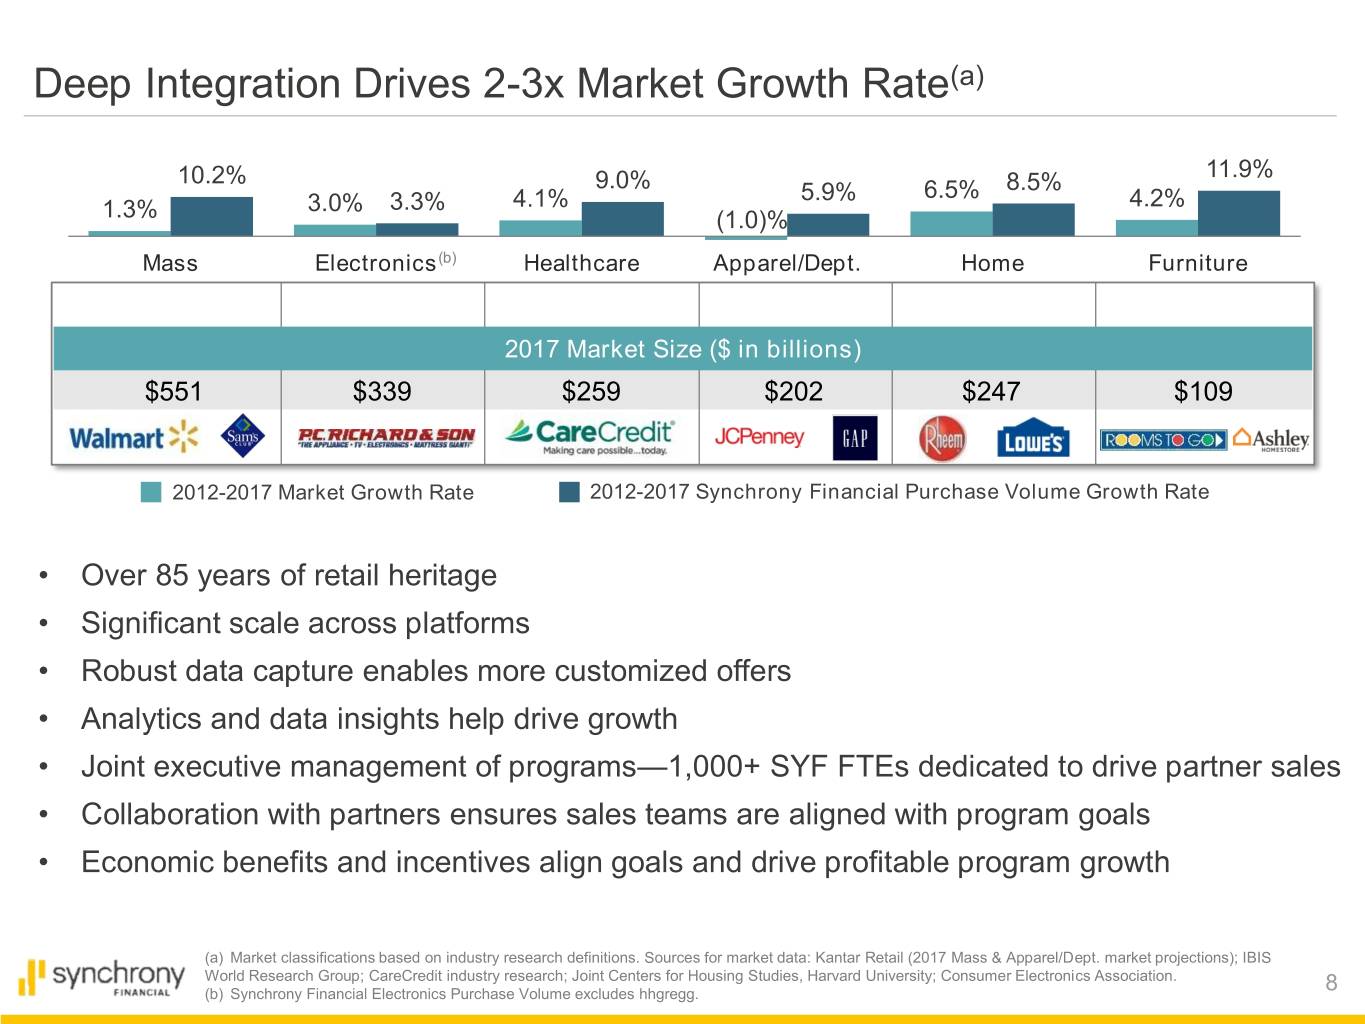
Deep Integration Drives 2-3x Market Growth Rate(a) 10.2% 11.9% 9.0% 6.5% 8.5% 3.0% 3.3% 4.1% 5.9% 4.2% 1.3% (1.0)% Mass Electronics(b) Healthcare Apparel/Dept. Home Furniture 2017 Market Size ($ in billions) $551 $339 $259 $202 $247 $109 2012-2017 Market Growth Rate 2012-2017 Synchrony Financial Purchase Volume Growth Rate • Over 85 years of retail heritage • Significant scale across platforms • Robust data capture enables more customized offers • Analytics and data insights help drive growth • Joint executive management of programs—1,000+ SYF FTEs dedicated to drive partner sales • Collaboration with partners ensures sales teams are aligned with program goals • Economic benefits and incentives align goals and drive profitable program growth (a) Market classifications based on industry research definitions. Sources for market data: Kantar Retail (2017 Mass & Apparel/Dept. market projections); IBIS World Research Group; CareCredit industry research; Joint Centers for Housing Studies, Harvard University; Consumer Electronics Association. (b) Synchrony Financial Electronics Purchase Volume excludes hhgregg. 8
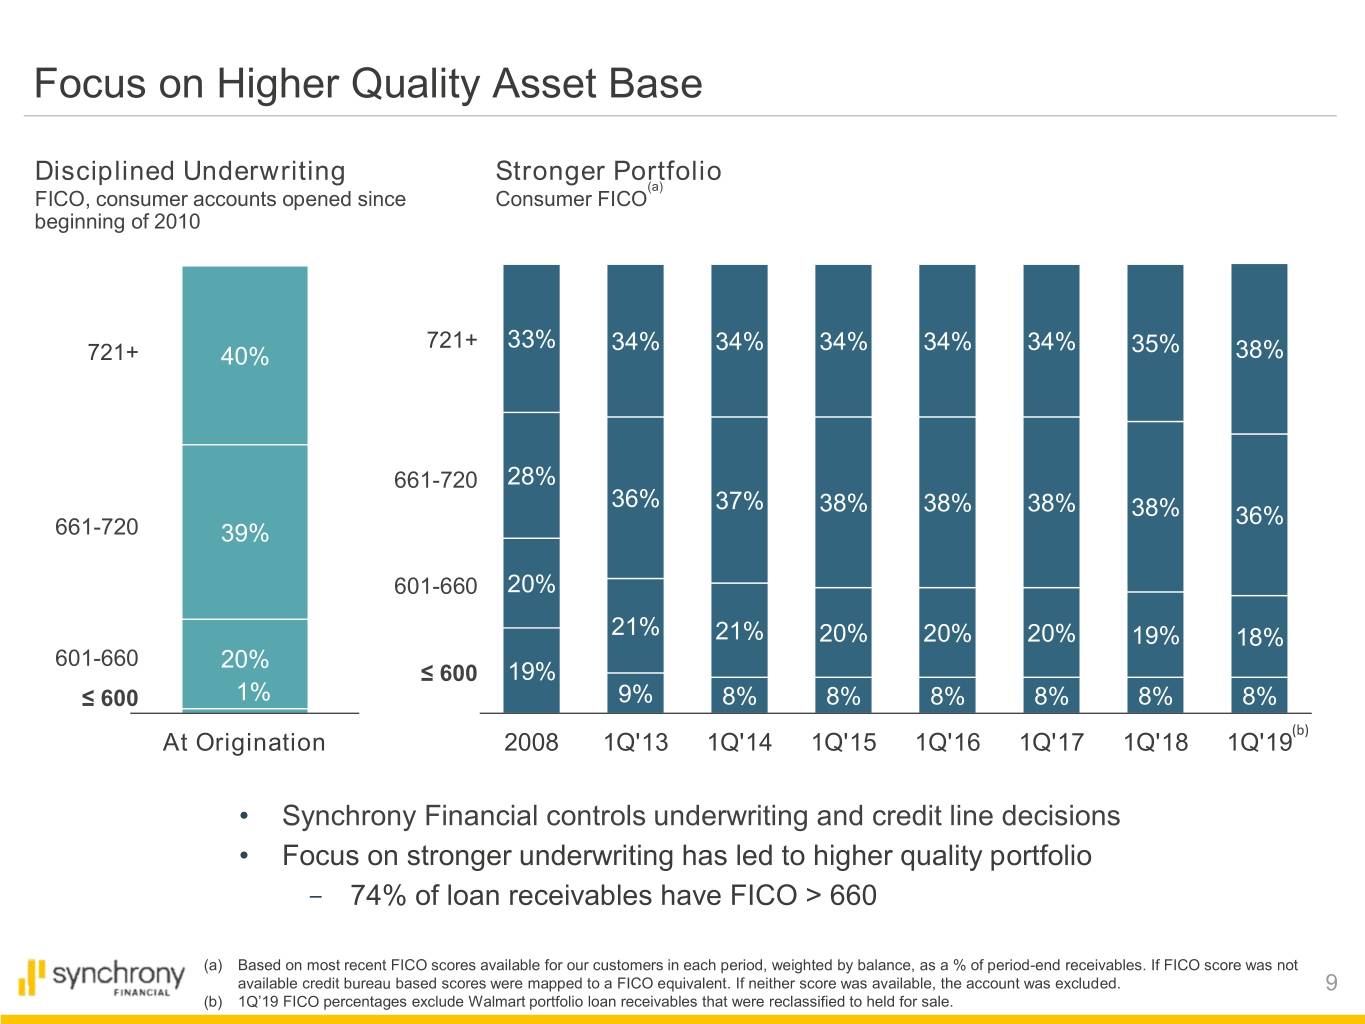
Focus on Higher Quality Asset Base Disciplined Underwriting Stronger Portfolio (a) FICO, consumer accounts opened since Consumer FICO beginning of 2010 721+ 33% 34% 34% 34% 34% 34% 35% 721+ 40% 38% 661-720 28% 36% 37% 38% 38% 38% 38% 36% 661-720 39% 601-660 20% 21% 21% 20% 20% 20% 19% 18% 601-660 20% ≤ 600 19% ≤ 600 1% 9% 8% 8% 8% 8% 8% 8% (b) At Origination 2008 1Q'13 1Q'14 1Q'15 1Q'16 1Q'17 1Q'18 1Q'19 • Synchrony Financial controls underwriting and credit line decisions • Focus on stronger underwriting has led to higher quality portfolio - 74% of loan receivables have FICO > 660 (a) Based on most recent FICO scores available for our customers in each period, weighted by balance, as a % of period-end receivables. If FICO score was not available credit bureau based scores were mapped to a FICO equivalent. If neither score was available, the account was excluded. 9 (b) 1Q’19 FICO percentages exclude Walmart portfolio loan receivables that were reclassified to held for sale.
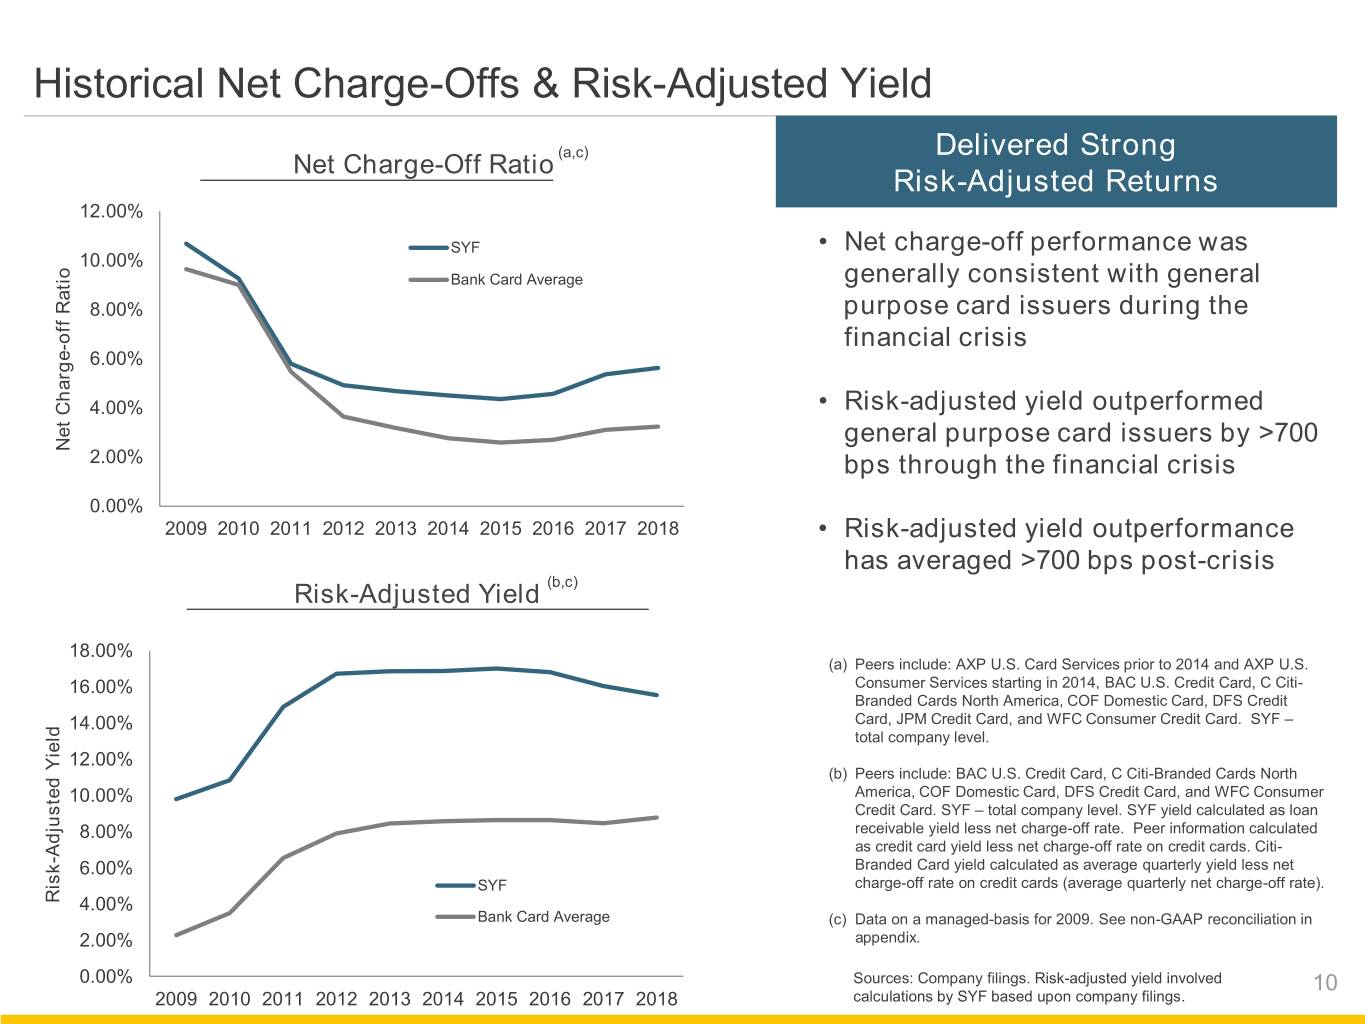
Historical Net Charge-Offs & Risk-Adjusted Yield (a,c) Delivered Strong Net Charge-Off Ratio Risk-Adjusted Returns 12.00% SYF • Net charge-off performance was 10.00% Bank Card Average generally consistent with general 8.00% purpose card issuers during the off Ratio - financial crisis 6.00% 4.00% • Risk-adjusted yield outperformed general purpose card issuers by >700 Net Charge Net 2.00% bps through the financial crisis 0.00% 2009 2010 2011 2012 2013 2014 2015 2016 2017 2018 • Risk-adjusted yield outperformance has averaged >700 bps post-crisis Risk-Adjusted Yield (b,c) 18.00% (a) Peers include: AXP U.S. Card Services prior to 2014 and AXP U.S. 16.00% Consumer Services starting in 2014, BAC U.S. Credit Card, C Citi- Branded Cards North America, COF Domestic Card, DFS Credit 14.00% Card, JPM Credit Card, and WFC Consumer Credit Card. SYF – total company level. 12.00% (b) Peers include: BAC U.S. Credit Card, C Citi-Branded Cards North 10.00% America, COF Domestic Card, DFS Credit Card, and WFC Consumer Credit Card. SYF – total company level. SYF yield calculated as loan 8.00% receivable yield less net charge-off rate. Peer information calculated as credit card yield less net charge-off rate on credit cards. Citi- Adjusted Adjusted Yield - 6.00% Branded Card yield calculated as average quarterly yield less net SYF charge-off rate on credit cards (average quarterly net charge-off rate). Risk 4.00% Bank Card Average (c) Data on a managed-basis for 2009. See non-GAAP reconciliation in 2.00% appendix. 0.00% Sources: Company filings. Risk-adjusted yield involved 10 2009 2010 2011 2012 2013 2014 2015 2016 2017 2018 calculations by SYF based upon company filings.
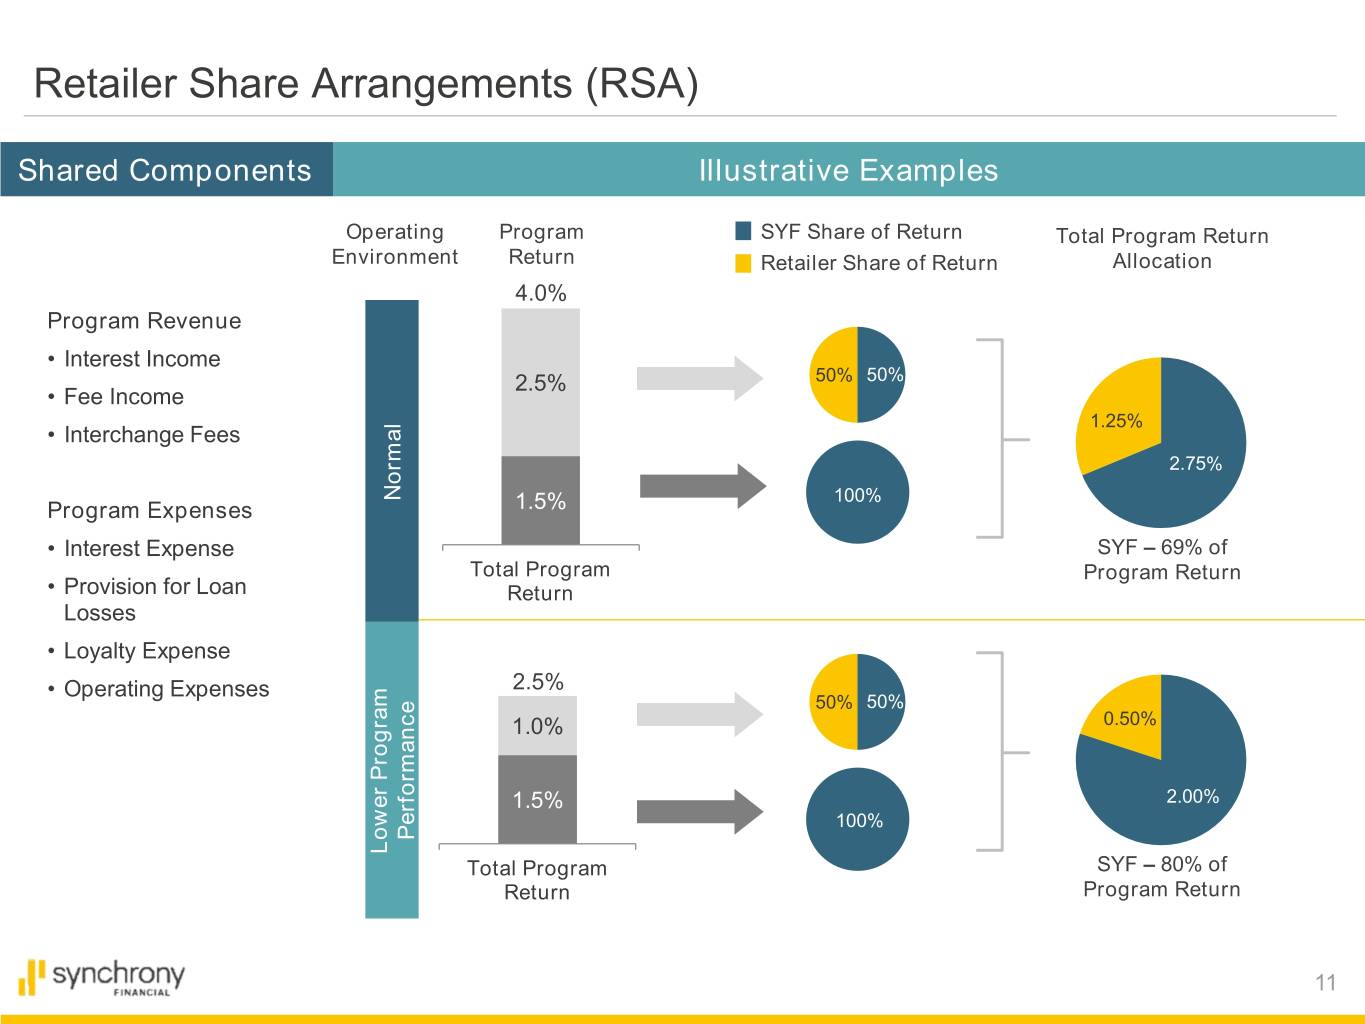
Retailer Share Arrangements (RSA) Shared Components Illustrative Examples Operating Program SYF Share of Return Total Program Return Environment Return Retailer Share of Return Allocation 4.0% Program Revenue • Interest Income 2.5% 50% 50% • Fee Income 1.25% • Interchange Fees 2.75% Normal 100% Program Expenses 1.5% • Interest Expense SYF – 69% of Total Program Program Return • Provision for Loan Return Losses • Loyalty Expense • Operating Expenses 2.5% 50% 50% 1.0% 0.50% 1.5% 2.00% 100% Performance LowerProgram Total Program SYF – 80% of Return Program Return 11
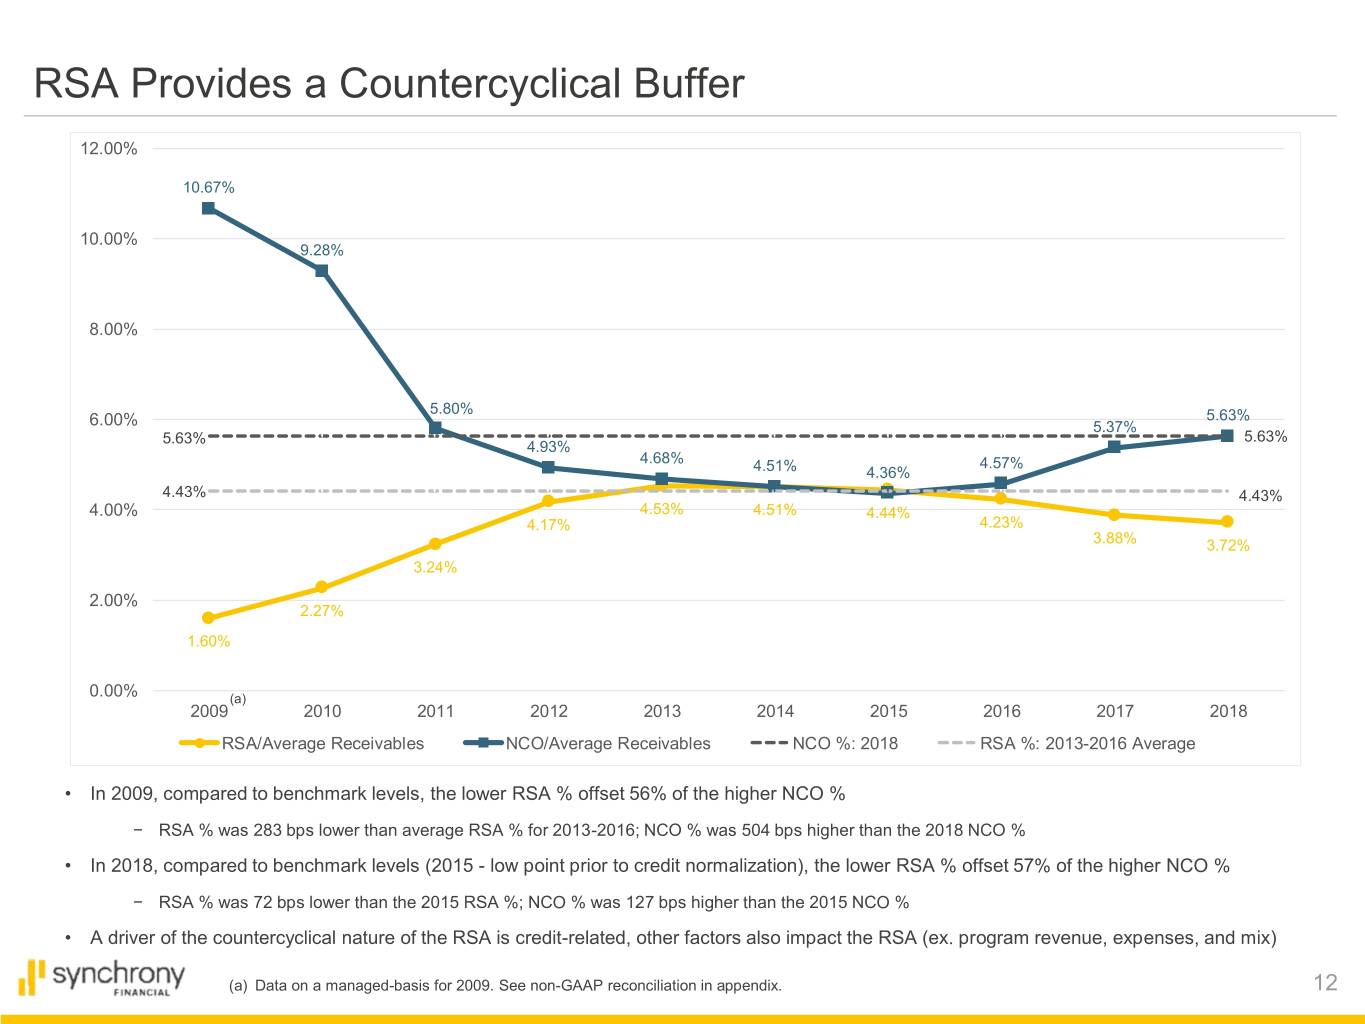
RSA Provides a Countercyclical Buffer 12.00% 10.67% 10.00% 9.28% 8.00% 5.80% 5.63% 6.00% 5.37% 5.63% 5.63% 4.93% 4.68% 4.57% 4.51% 4.36% 4.43% 4.43% 4.00% 4.53% 4.51% 4.44% 4.17% 4.23% 3.88% 3.72% 3.24% 2.00% 2.27% 1.60% 0.00% (a) 2009 2010 2011 2012 2013 2014 2015 2016 2017 2018 RSA/Average Receivables NCO/Average Receivables NCO %: 2018 RSA %: 2013-2016 Average • In 2009, compared to benchmark levels, the lower RSA % offset 56% of the higher NCO % − RSA % was 283 bps lower than average RSA % for 2013-2016; NCO % was 504 bps higher than the 2018 NCO % • In 2018, compared to benchmark levels (2015 - low point prior to credit normalization), the lower RSA % offset 57% of the higher NCO % − RSA % was 72 bps lower than the 2015 RSA %; NCO % was 127 bps higher than the 2015 NCO % • A driver of the countercyclical nature of the RSA is credit-related, other factors also impact the RSA (ex. program revenue, expenses, and mix) (a) Data on a managed-basis for 2009. See non-GAAP reconciliation in appendix. 12
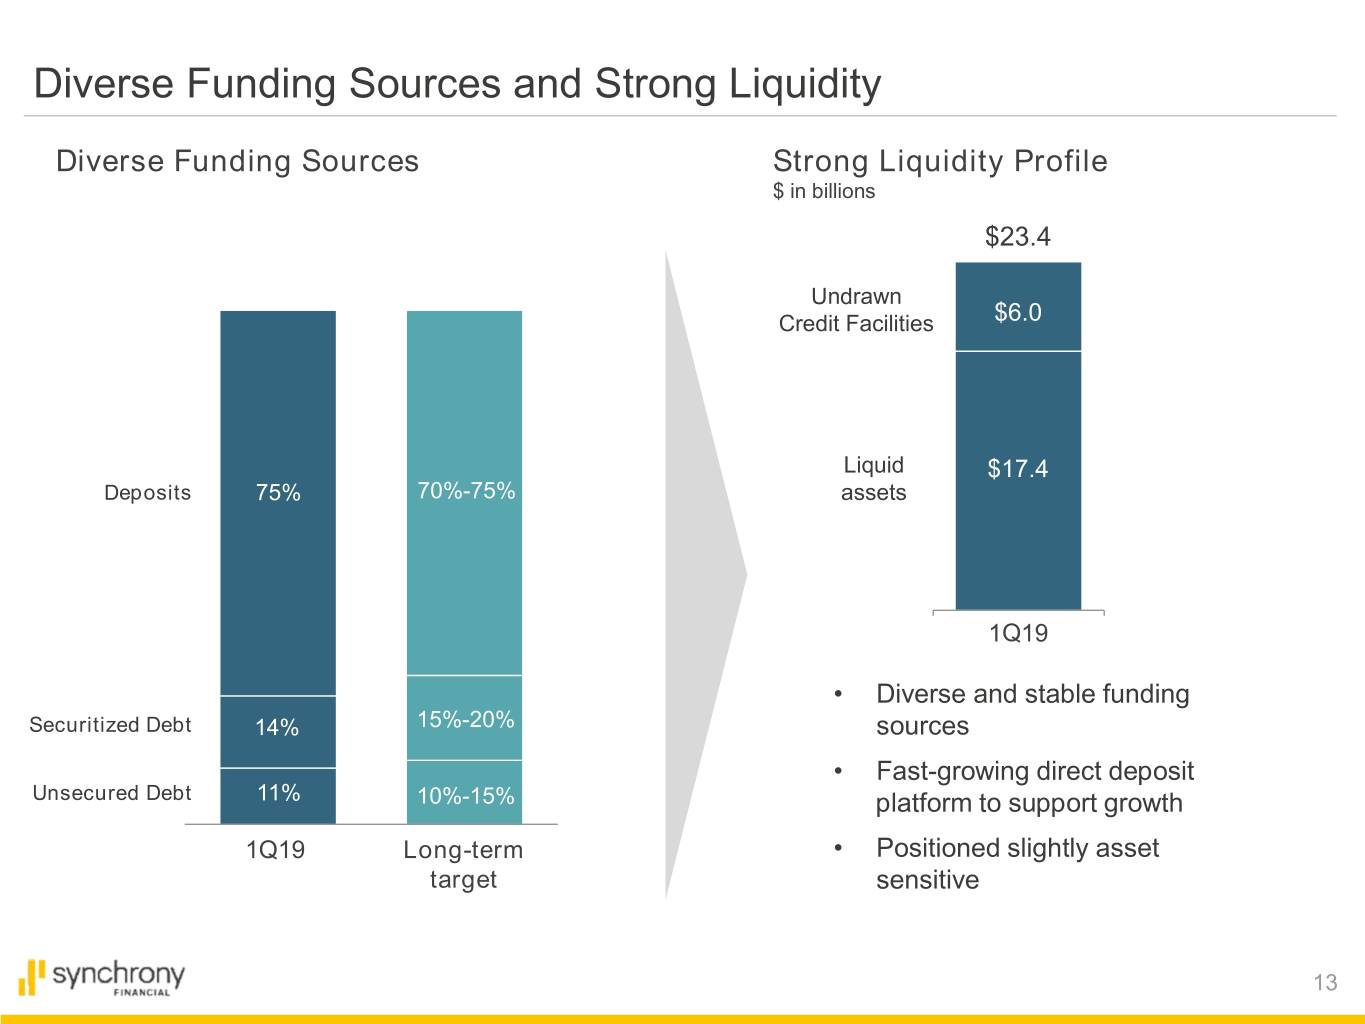
Diverse Funding Sources and Strong Liquidity Diverse Funding Sources Strong Liquidity Profile $ in billions $23.4 Undrawn Credit Facilities $6.0 Liquid $17.4 Deposits 75% 70%-75% assets 1Q19 • Diverse and stable funding Securitized Debt 14% 15%-20% sources • Fast-growing direct deposit Unsecured Debt 11% 10%-15% platform to support growth 1Q19 Long-term • Positioned slightly asset target sensitive 13
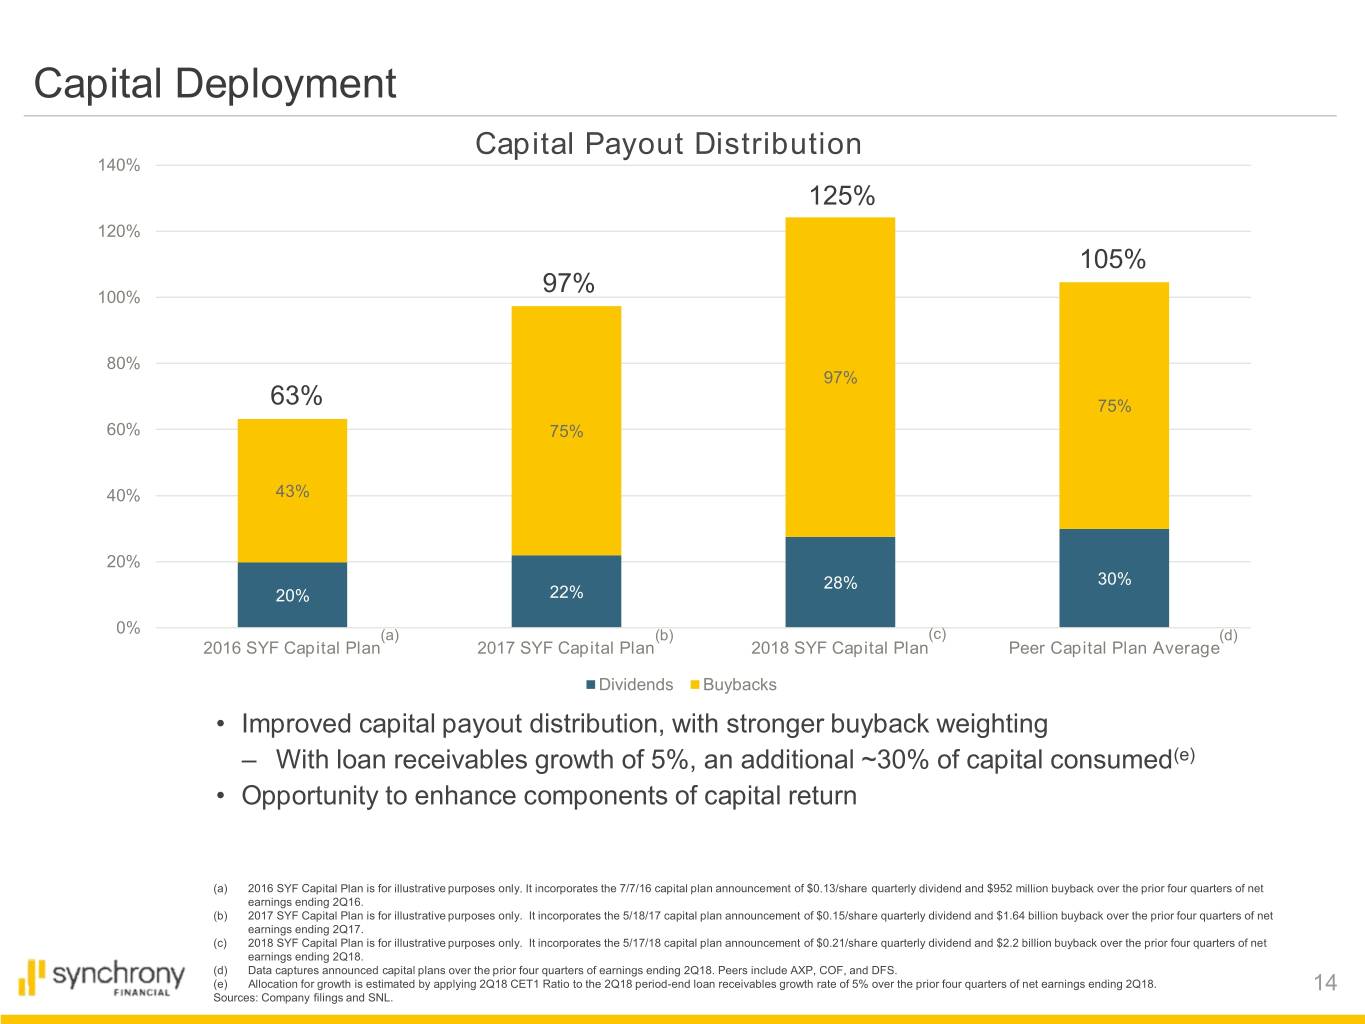
Capital Deployment Capital Payout Distribution 140% 125% 120% 105% 97% 100% 80% 97% 63% 75% 60% 75% 40% 43% 20% 28% 30% 20% 22% 0% (a) (b) (c) (d) 2016 SYF Capital Plan 2017 SYF Capital Plan 2018 SYF Capital Plan Peer Capital Plan Average Dividends Buybacks • Improved capital payout distribution, with stronger buyback weighting ‒ With loan receivables growth of 5%, an additional ~30% of capital consumed(e) • Opportunity to enhance components of capital return (a) 2016 SYF Capital Plan is for illustrative purposes only. It incorporates the 7/7/16 capital plan announcement of $0.13/share quarterly dividend and $952 million buyback over the prior four quarters of net earnings ending 2Q16. (b) 2017 SYF Capital Plan is for illustrative purposes only. It incorporates the 5/18/17 capital plan announcement of $0.15/share quarterly dividend and $1.64 billion buyback over the prior four quarters of net earnings ending 2Q17. (c) 2018 SYF Capital Plan is for illustrative purposes only. It incorporates the 5/17/18 capital plan announcement of $0.21/share quarterly dividend and $2.2 billion buyback over the prior four quarters of net earnings ending 2Q18. (d) Data captures announced capital plans over the prior four quarters of earnings ending 2Q18. Peers include AXP, COF, and DFS. (e) Allocation for growth is estimated by applying 2Q18 CET1 Ratio to the 2Q18 period-end loan receivables growth rate of 5% over the prior four quarters of net earnings ending 2Q18. 14 Sources: Company filings and SNL.
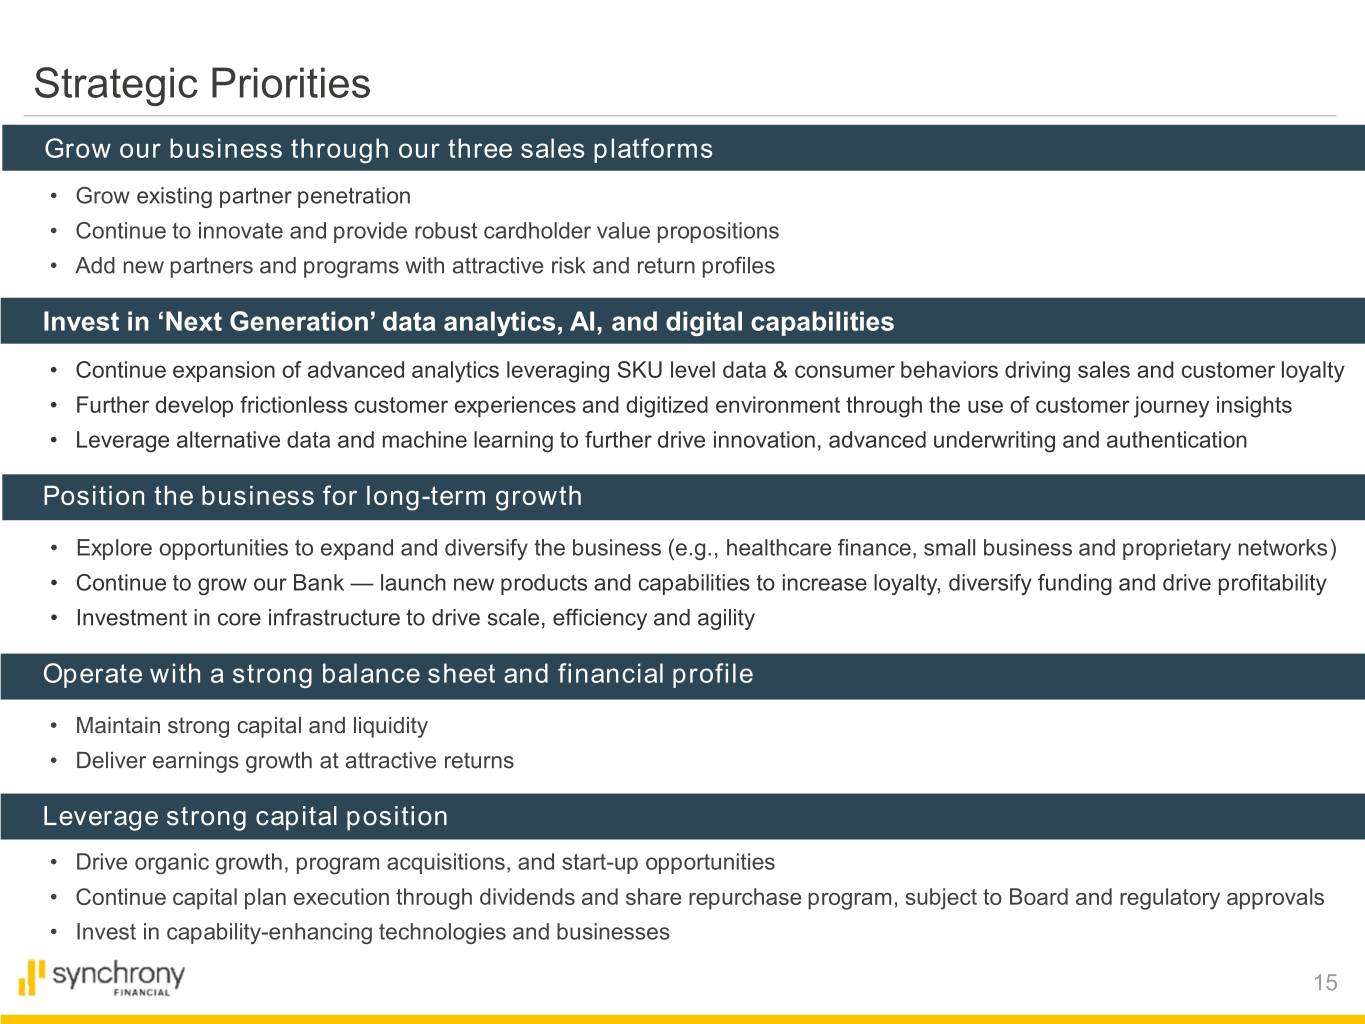
Strategic Priorities Grow our business through our three sales platforms • Grow existing partner penetration • Continue to innovate and provide robust cardholder value propositions • Add new partners and programs with attractive risk and return profiles Invest in ‘Next Generation’ data analytics, AI, and digital capabilities • Continue expansion of advanced analytics leveraging SKU level data & consumer behaviors driving sales and customer loyalty • Further develop frictionless customer experiences and digitized environment through the use of customer journey insights • Leverage alternative data and machine learning to further drive innovation, advanced underwriting and authentication Position the business for long-term growth • Explore opportunities to expand and diversify the business (e.g., healthcare finance, small business and proprietary networks) • Continue to grow our Bank — launch new products and capabilities to increase loyalty, diversify funding and drive profitability • Investment in core infrastructure to drive scale, efficiency and agility Operate with a strong balance sheet and financial profile • Maintain strong capital and liquidity • Deliver earnings growth at attractive returns Leverage strong capital position • Drive organic growth, program acquisitions, and start-up opportunities • Continue capital plan execution through dividends and share repurchase program, subject to Board and regulatory approvals • Invest in capability-enhancing technologies and businesses 15

Appendix
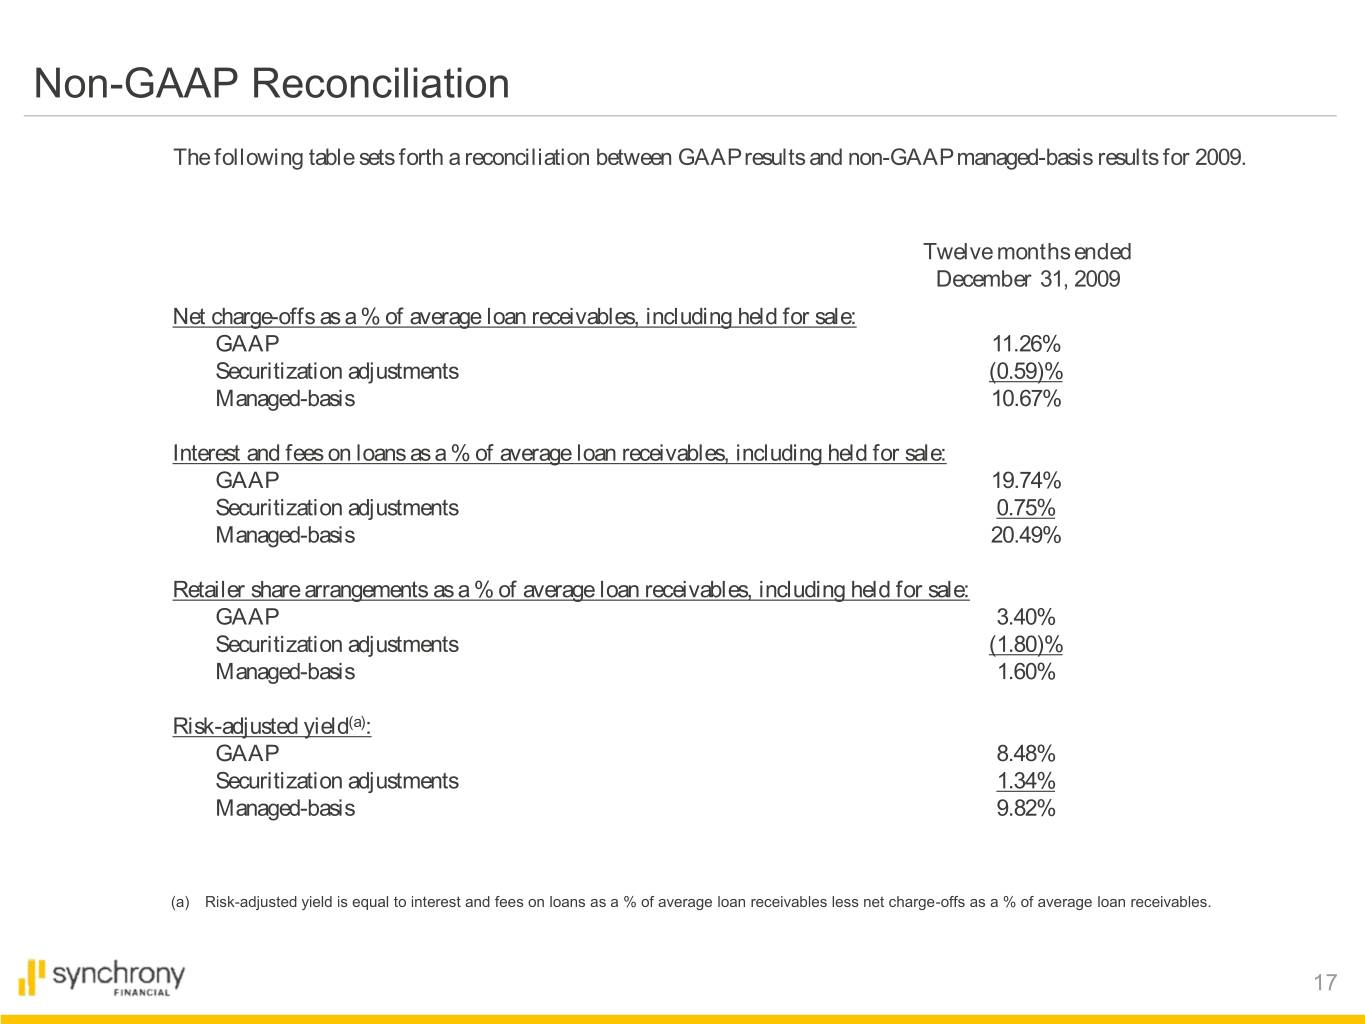
Non-GAAP Reconciliation The following table sets forth a reconciliation between GAAP results and non-GAAP managed-basis results for 2009. Twelve months ended December 31, 2009 Net charge-offs as a % of average loan receivables, including held for sale: GAAP 11.26% Securitization adjustments (0.59)% Managed-basis 10.67% Interest and fees on loans as a % of average loan receivables, including held for sale: GAAP 19.74% Securitization adjustments 0.75% Managed-basis 20.49% Retailer share arrangements as a % of average loan receivables, including held for sale: GAAP 3.40% Securitization adjustments (1.80)% Managed-basis 1.60% Risk-adjusted yield(a): GAAP 8.48% Securitization adjustments 1.34% Managed-basis 9.82% (a) Risk-adjusted yield is equal to interest and fees on loans as a % of average loan receivables less net charge-offs as a % of average loan receivables. 17
Retail Card
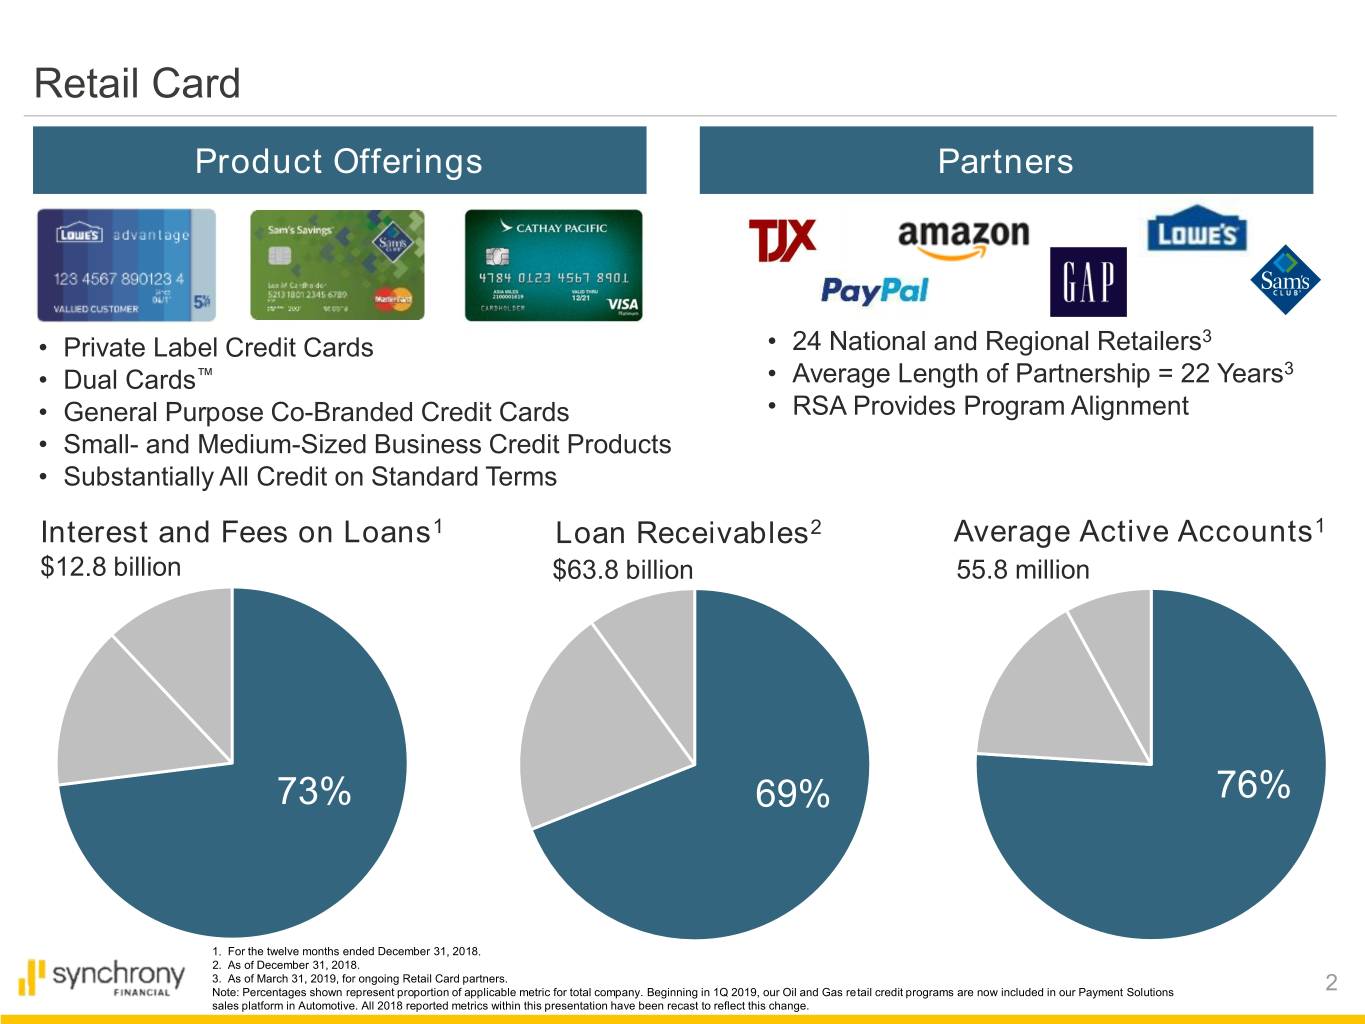
Retail Card Product Offerings Partners • Private Label Credit Cards • 24 National and Regional Retailers3 • Dual Cards™ • Average Length of Partnership = 22 Years3 • General Purpose Co-Branded Credit Cards • RSA Provides Program Alignment • Small- and Medium-Sized Business Credit Products • Substantially All Credit on Standard Terms Interest and Fees on Loans1 Loan Receivables2 Average Active Accounts1 $12.8 billion $63.8 billion 55.8 million 73% 69% 76% 1. For the twelve months ended December 31, 2018. 2. As of December 31, 2018. 3. As of March 31, 2019, for ongoing Retail Card partners. Note: Percentages shown represent proportion of applicable metric for total company. Beginning in 1Q 2019, our Oil and Gas retail credit programs are now included in our Payment Solutions 2 sales platform in Automotive. All 2018 reported metrics within this presentation have been recast to reflect this change.
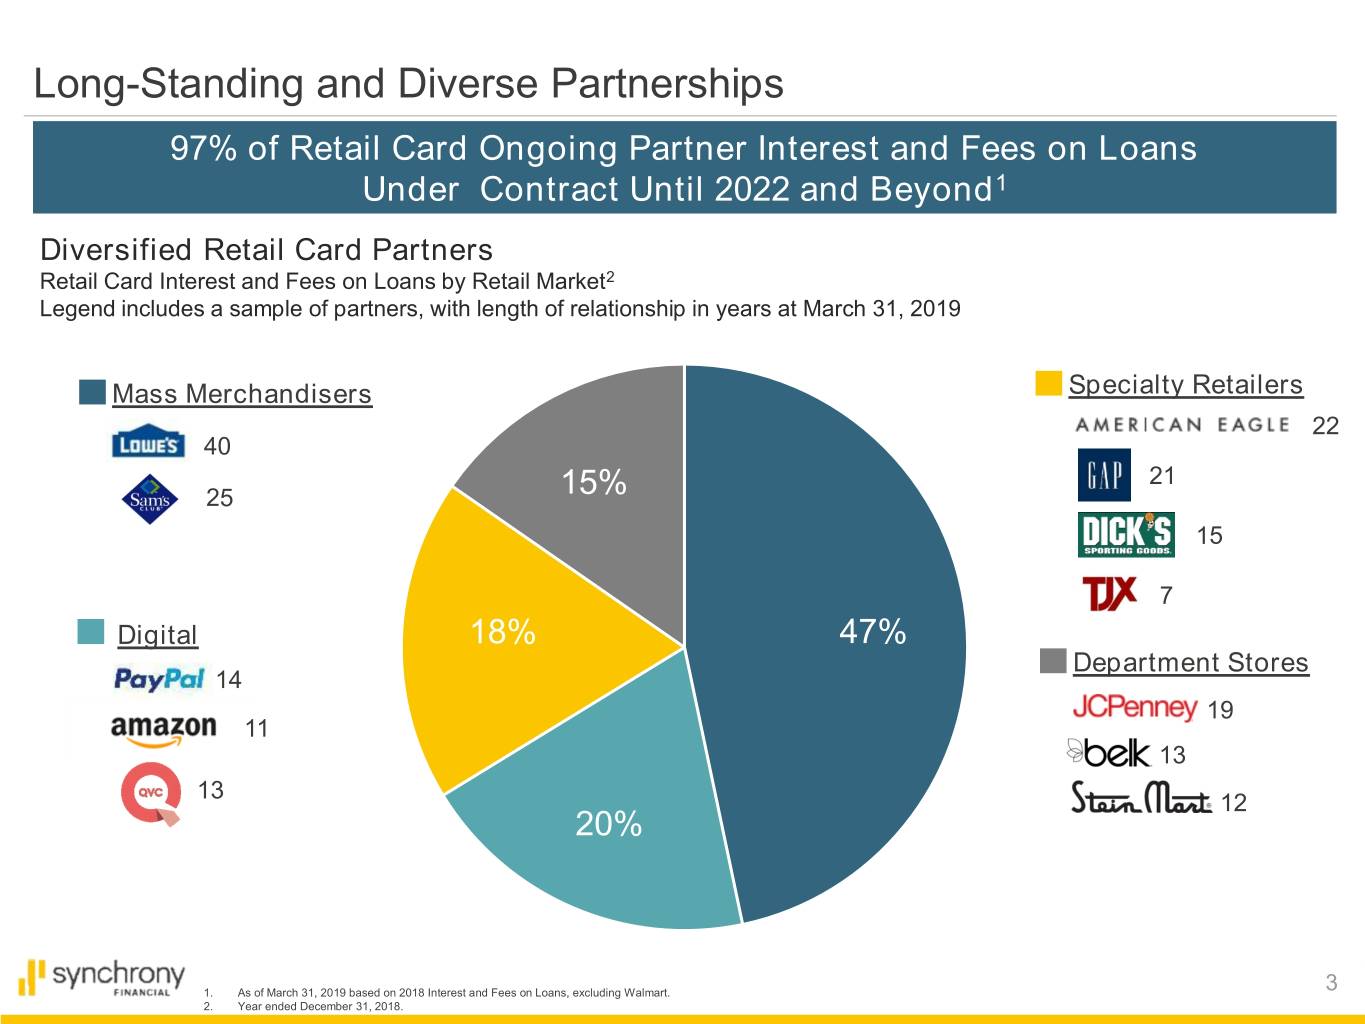
Long-Standing and Diverse Partnerships 97% of Retail Card Ongoing Partner Interest and Fees on Loans Under Contract Until 2022 and Beyond1 Diversified Retail Card Partners Retail Card Interest and Fees on Loans by Retail Market2 Legend includes a sample of partners, with length of relationship in years at March 31, 2019 Mass Merchandisers Specialty Retailers 22 40 21 25 15% 15 7 Digital 18% 47% Department Stores 14 19 11 13 13 12 20% 1. As of March 31, 2019 based on 2018 Interest and Fees on Loans, excluding Walmart. 3 2. Year ended December 31, 2018.
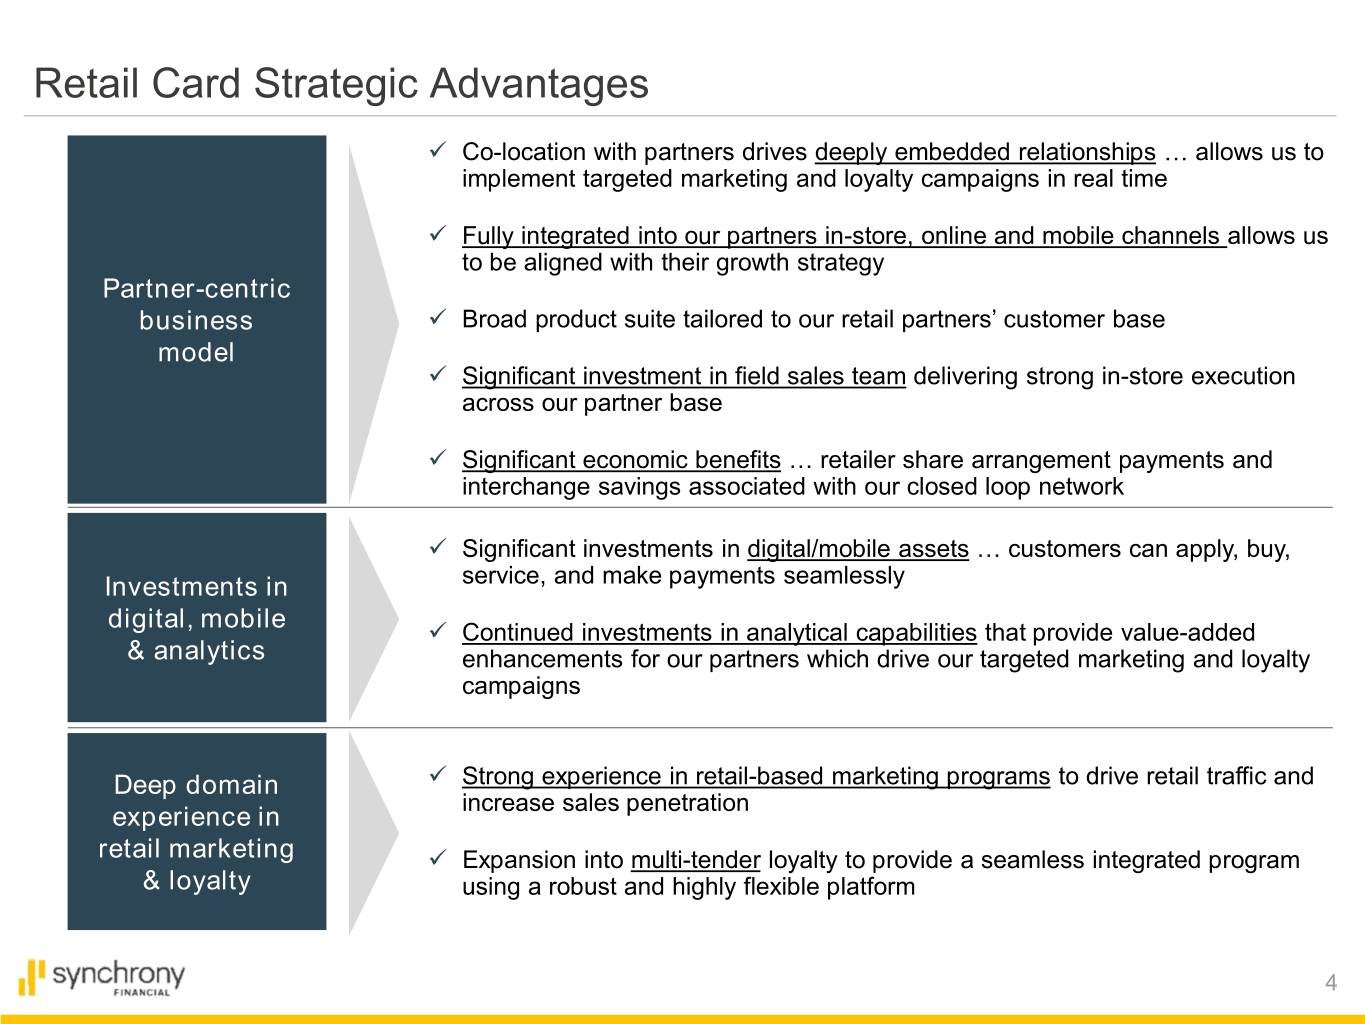
Retail Card Strategic Advantages ✓ Co-location with partners drives deeply embedded relationships … allows us to implement targeted marketing and loyalty campaigns in real time ✓ Fully integrated into our partners in-store, online and mobile channels allows us to be aligned with their growth strategy Partner-centric business ✓ Broad product suite tailored to our retail partners’ customer base model ✓ Significant investment in field sales team delivering strong in-store execution across our partner base ✓ Significant economic benefits … retailer share arrangement payments and interchange savings associated with our closed loop network ✓ Significant investments in digital/mobile assets … customers can apply, buy, Investments in service, and make payments seamlessly digital, mobile ✓ Continued investments in analytical capabilities that provide value-added & analytics enhancements for our partners which drive our targeted marketing and loyalty campaigns Deep domain ✓ Strong experience in retail-based marketing programs to drive retail traffic and increase sales penetration experience in retail marketing ✓ Expansion into multi-tender loyalty to provide a seamless integrated program & loyalty using a robust and highly flexible platform 4
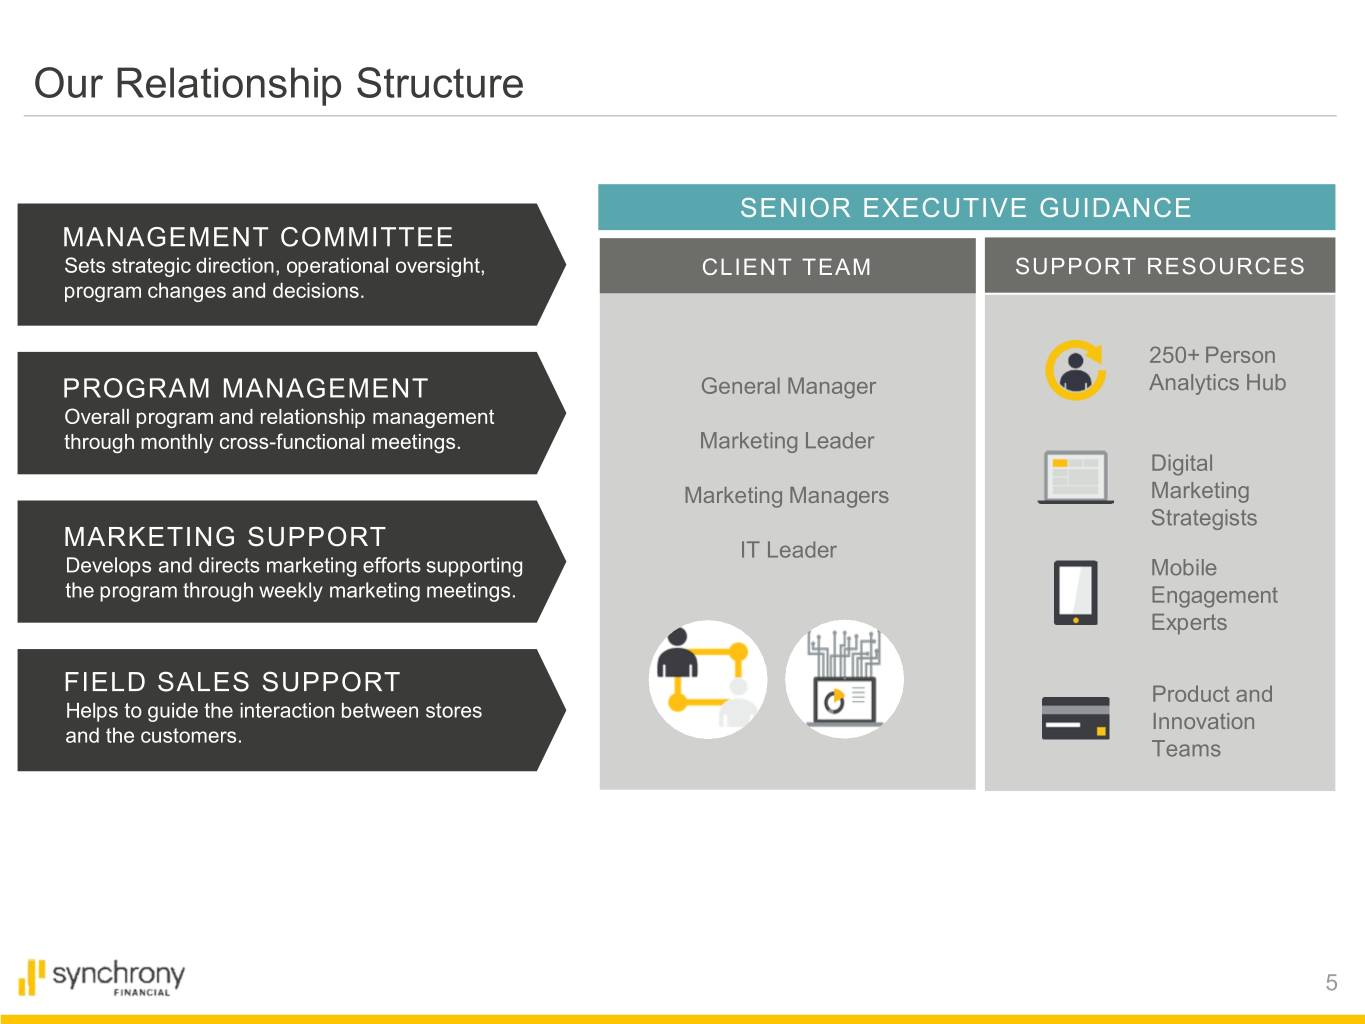
Our Relationship Structure SENIOR EXECUTIVE GUIDANCE MANAGEMENT COMMITTEE Sets strategic direction, operational oversight, CLIENT TEAM SUPPORT RESOURCES program changes and decisions. 250+ Person PROGRAM MANAGEMENT General Manager Analytics Hub Overall program and relationship management through monthly cross-functional meetings. Marketing Leader Digital Marketing Managers Marketing Strategists MARKETING SUPPORT IT Leader Develops and directs marketing efforts supporting Mobile the program through weekly marketing meetings. Engagement Experts FIELD SALES SUPPORT Product and Helps to guide the interaction between stores Innovation and the customers. Teams 5
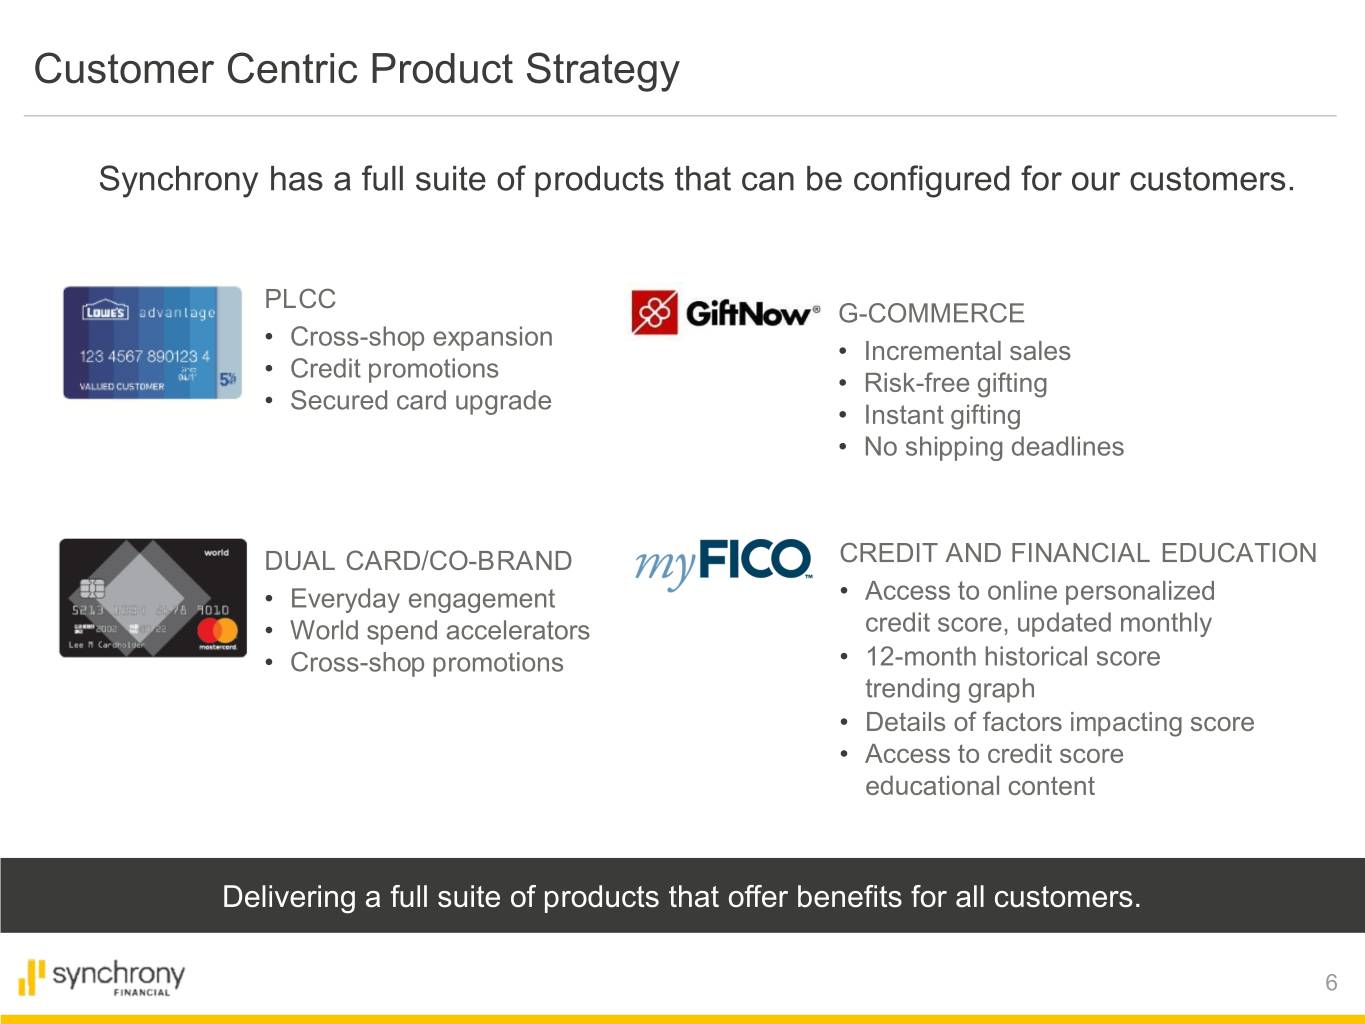
Customer Centric Product Strategy Synchrony has a full suite of products that can be configured for our customers. PLCC G-COMMERCE • Cross-shop expansion • Incremental sales • Credit promotions • Risk-free gifting • Secured card upgrade • Instant gifting • No shipping deadlines DUAL CARD/CO-BRAND CREDIT AND FINANCIAL EDUCATION • Everyday engagement • Access to online personalized • World spend accelerators credit score, updated monthly • Cross-shop promotions • 12-month historical score trending graph • Details of factors impacting score • Access to credit score educational content Delivering a full suite of products that offer benefits for all customers. 6
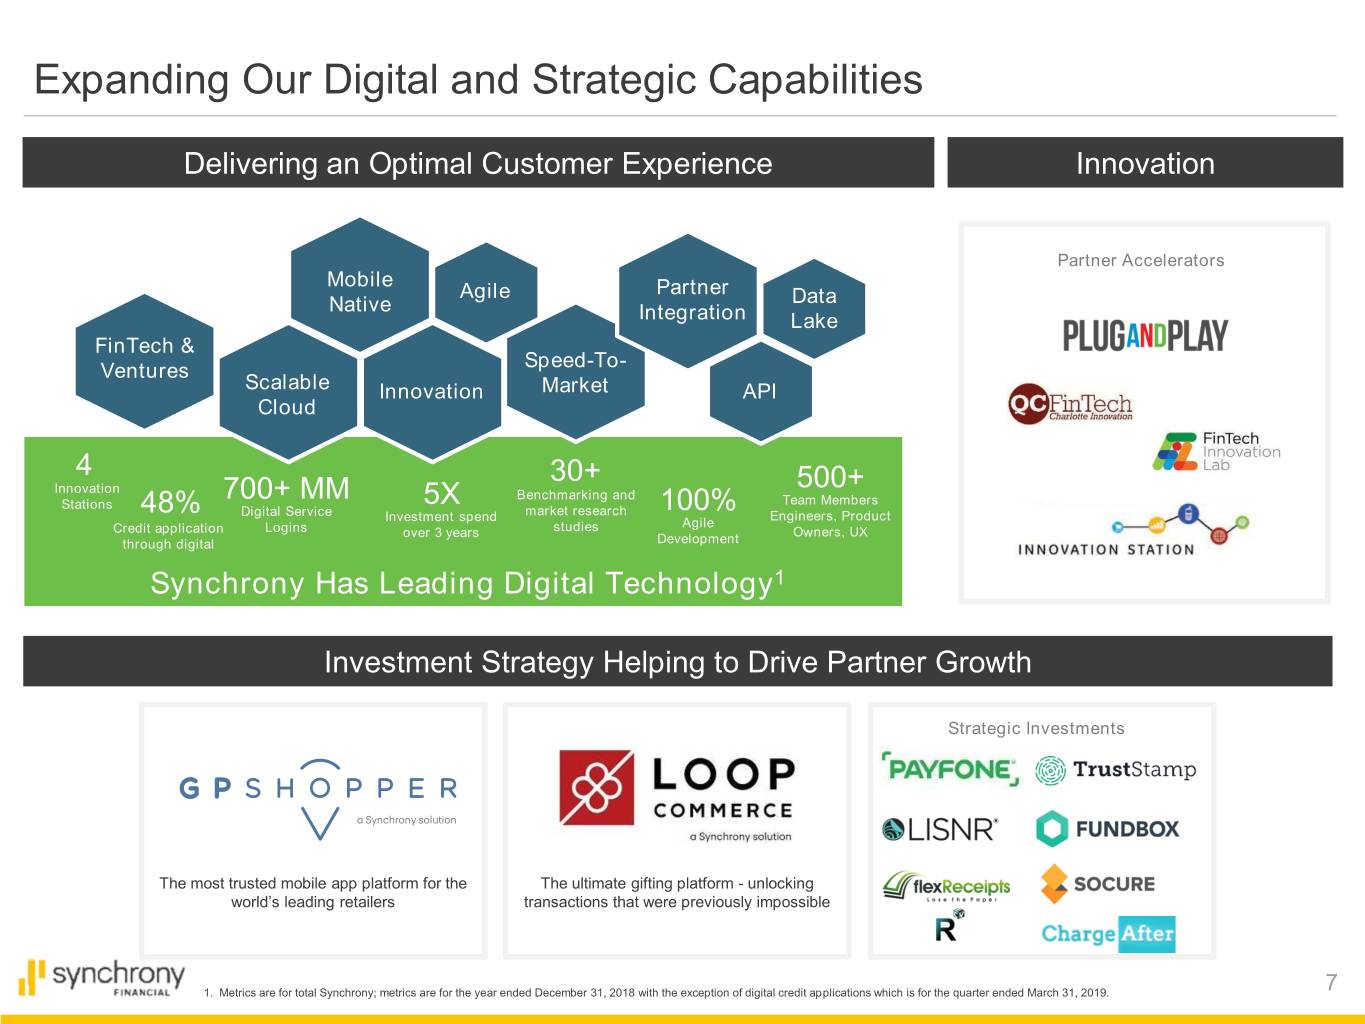
Expanding Our Digital and Strategic Capabilities Delivering an Optimal Customer Experience Innovation Partner Accelerators Mobile Agile Partner Native Data Integration Lake FinTech & Speed-To- Ventures Scalable Innovation Market API Cloud 4 30+ 500+ Innovation 700+ MM Benchmarking and Stations 5X 100% Team Members 48% Digital Service market research Engineers, Product Investment spend Agile Credit application Logins over 3 years studies Owners, UX through digital Development Synchrony Has Leading Digital Technology1 Investment Strategy Helping to Drive Partner Growth Strategic Investments The most trusted mobile app platform for the The ultimate gifting platform - unlocking world’s leading retailers transactions that were previously impossible 1. Metrics are for total Synchrony; metrics are for the year ended December 31, 2018 with the exception of digital credit applications which is for the quarter ended March 31, 2019. 7
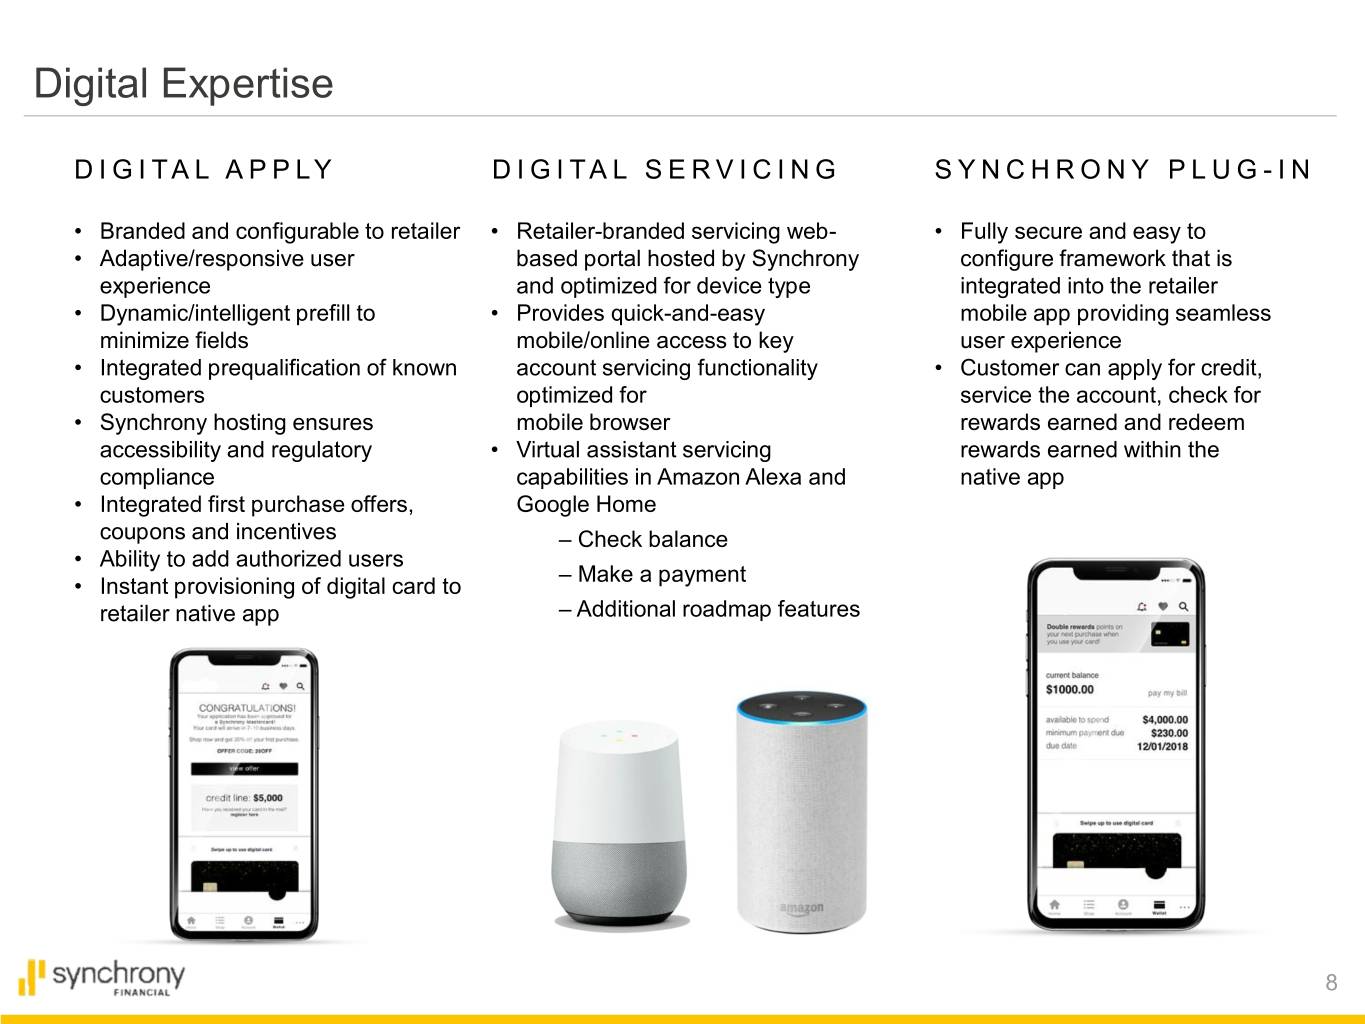
Digital Expertise DIGITAL APPLY DIGITAL SERVICING SYNCHRONY PLUG - IN • Branded and configurable to retailer • Retailer-branded servicing web- • Fully secure and easy to • Adaptive/responsive user based portal hosted by Synchrony configure framework that is experience and optimized for device type integrated into the retailer • Dynamic/intelligent prefill to • Provides quick-and-easy mobile app providing seamless minimize fields mobile/online access to key user experience • Integrated prequalification of known account servicing functionality • Customer can apply for credit, customers optimized for service the account, check for • Synchrony hosting ensures mobile browser rewards earned and redeem accessibility and regulatory • Virtual assistant servicing rewards earned within the compliance capabilities in Amazon Alexa and native app • Integrated first purchase offers, Google Home coupons and incentives – Check balance • Ability to add authorized users – Make a payment • Instant provisioning of digital card to retailer native app – Additional roadmap features 8
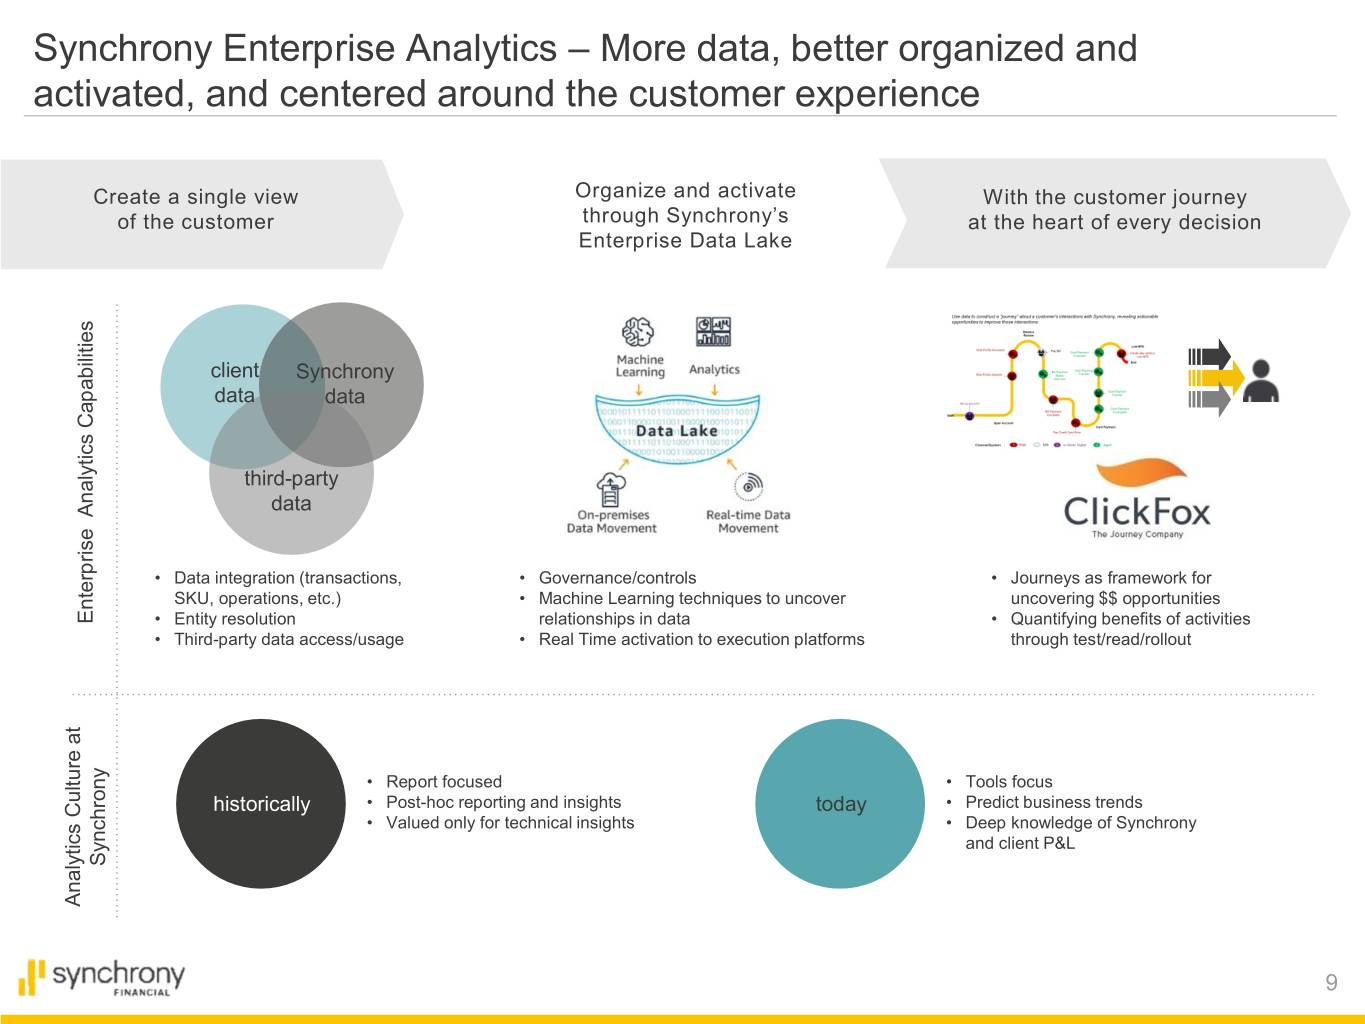
Synchrony Enterprise Analytics – More data, better organized and activated, and centered around the customer experience Create a single view Organize and activate With the customer journey of the customer through Synchrony’s at the heart of every decision Enterprise Data Lake client Synchrony data data third-party data • Data integration (transactions, • Governance/controls • Journeys as framework for SKU, operations, etc.) • Machine Learning techniques to uncover uncovering $$ opportunities Enterprise Analytics Capabilities Capabilities Analytics Enterprise • Entity resolution relationships in data • Quantifying benefits of activities • Third-party data access/usage • Real Time activation to execution platforms through test/read/rollout • Report focused • Tools focus historically • Post-hoc reporting and insights today • Predict business trends • Valued only for technical insights • Deep knowledge of Synchrony and client P&L Synchrony Analytics at Culture Analytics 9
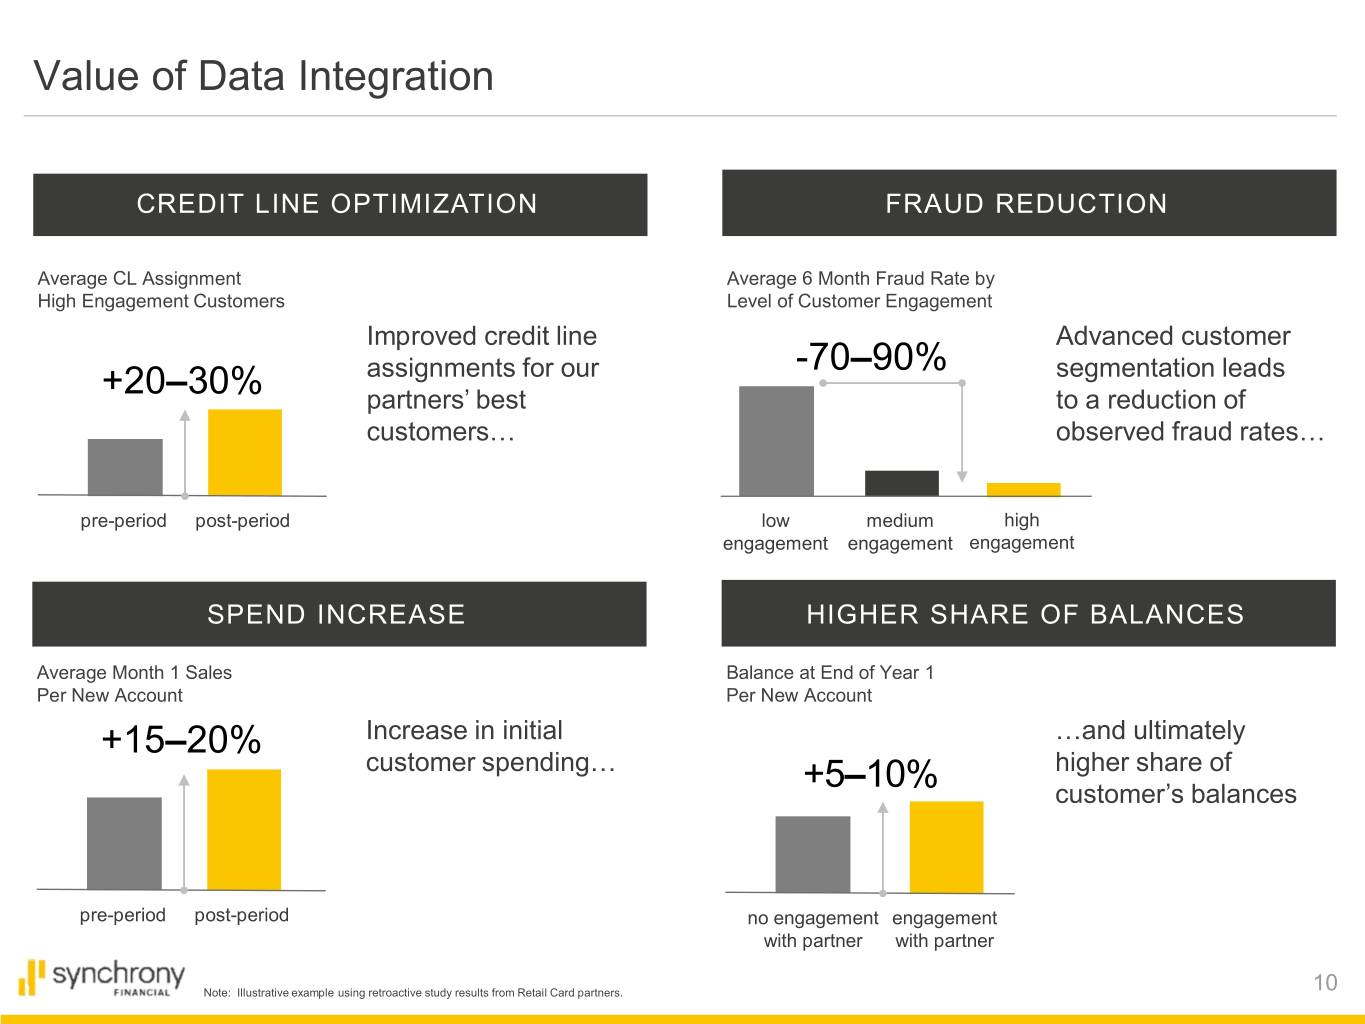
Value of Data Integration CREDIT LINE OPTIMIZATION FRAUD REDUCTION Average CL Assignment Average 6 Month Fraud Rate by High Engagement Customers Level of Customer Engagement Improved credit line Advanced customer assignments for our -70–90% segmentation leads +20–30% partners’ best to a reduction of customers… observed fraud rates… pre-period post-period low medium high engagement engagement engagement SPEND INCREASE HIGHER SHARE OF BALANCES Average Month 1 Sales Balance at End of Year 1 Per New Account Per New Account +15–20% Increase in initial …and ultimately customer spending… +5–10% higher share of customer’s balances pre-period post-period no engagement engagement with partner with partner Note: Illustrative example using retroactive study results from Retail Card partners. 10
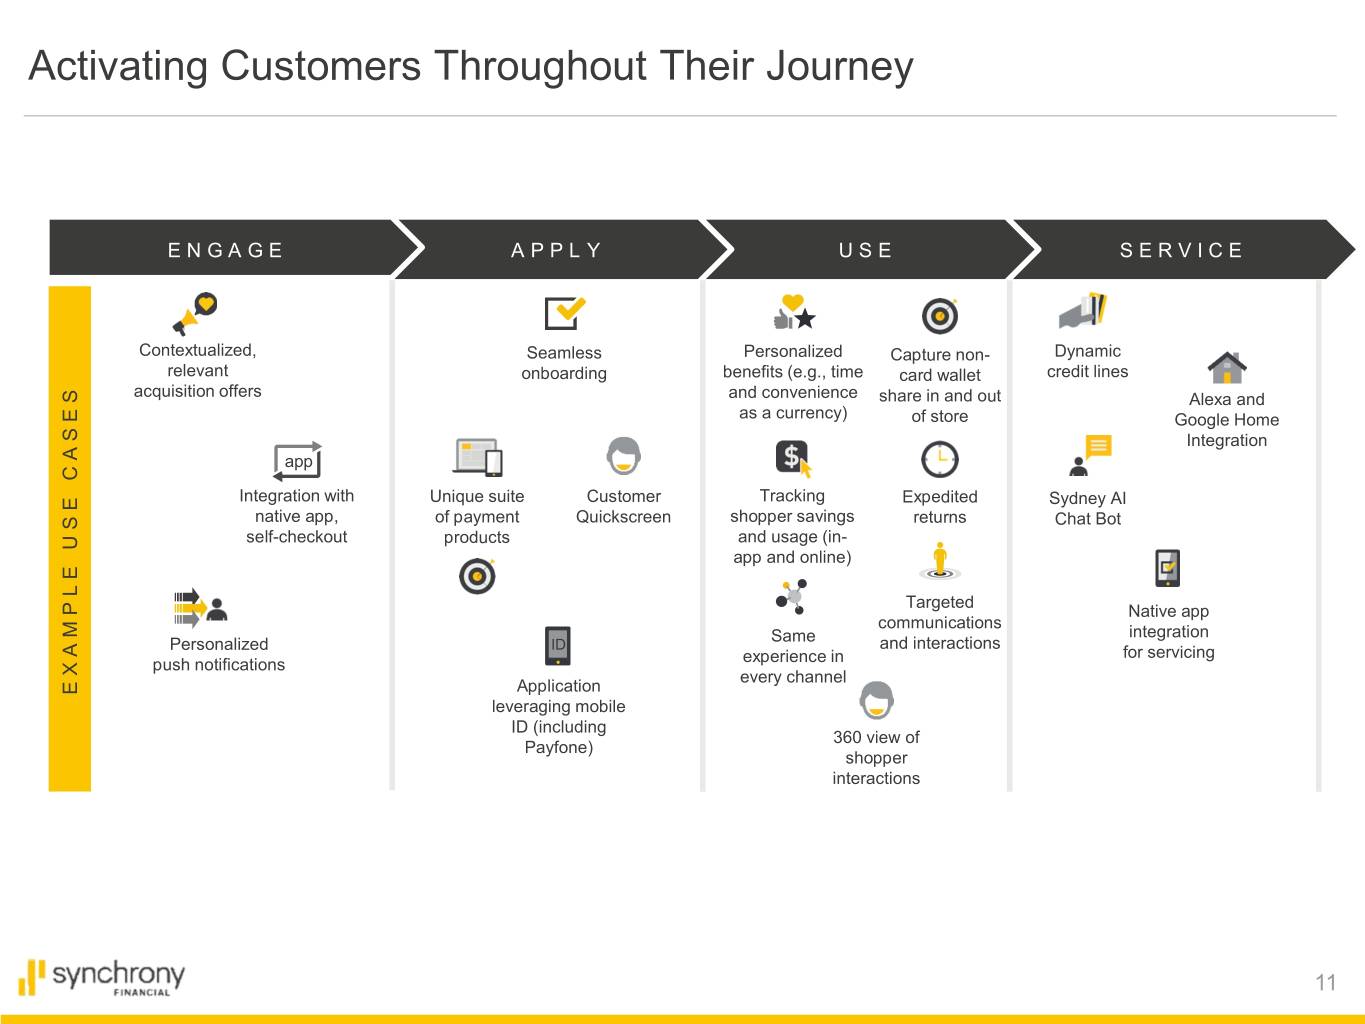
Activating Customers Throughout Their Journey ENGAGE APPLY USE SERVICE Contextualized, Seamless Personalized Capture non- Dynamic relevant onboarding benefits (e.g., time card wallet credit lines acquisition offers and convenience share in and out Alexa and as a currency) of store Google Home Integration app Integration with Unique suite Customer Tracking Expedited Sydney AI native app, of payment Quickscreen shopper savings returns Chat Bot self-checkout products and usage (in- app and online) Targeted Native app communications integration Same and interactions Personalized ID for servicing push notifications experience in every channel EXAMPLE USE CASES Application leveraging mobile ID (including 360 view of Payfone) shopper interactions 11

Engage with us.
Payment Solutions
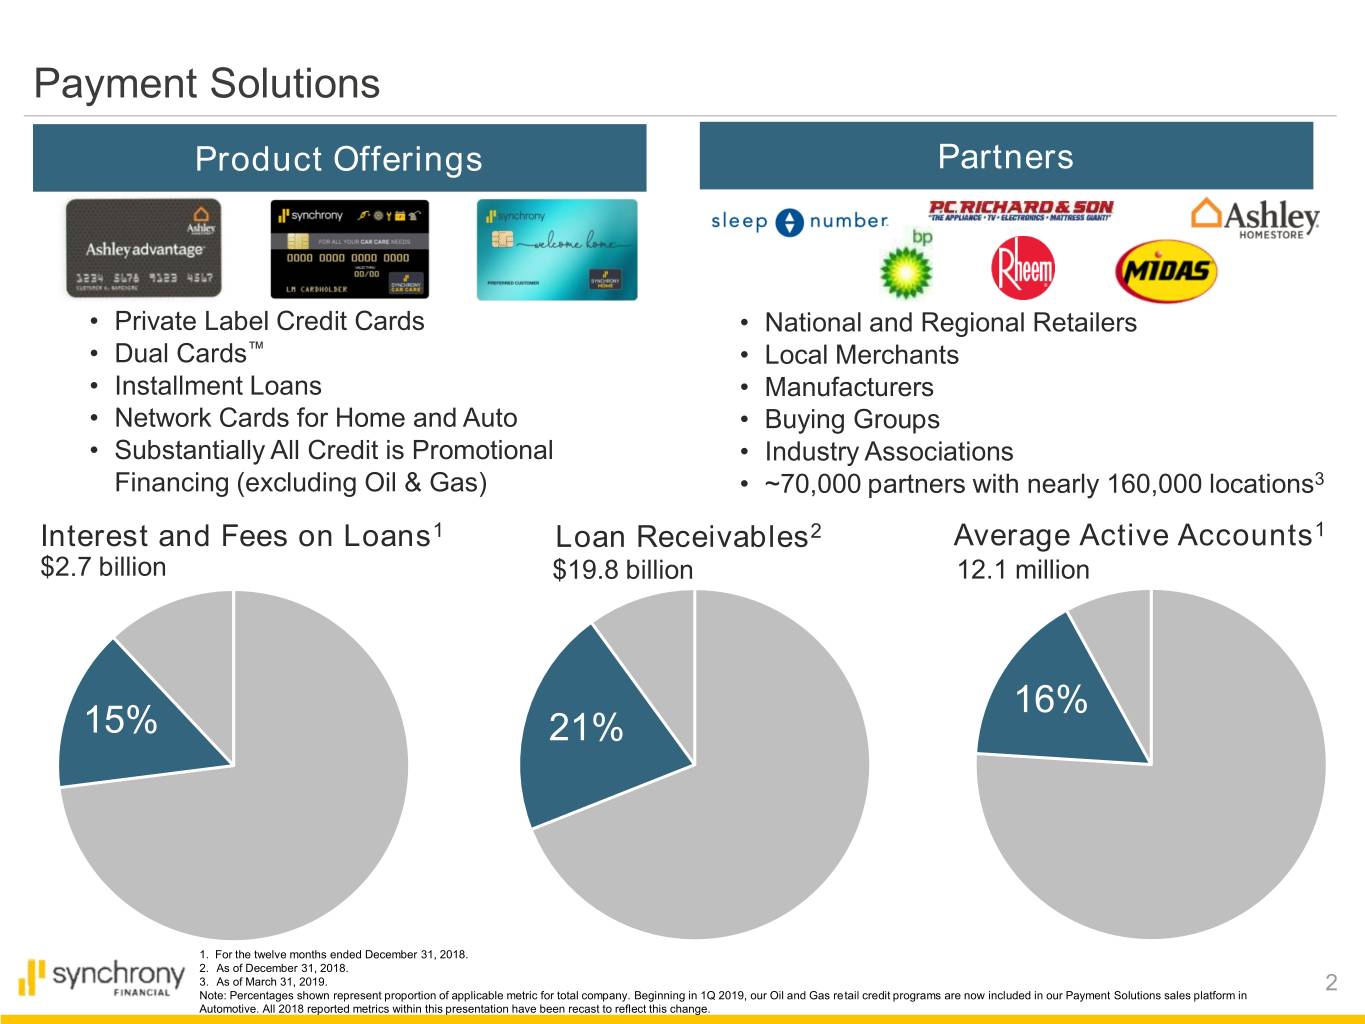
Payment Solutions Product Offerings Partners • Private Label Credit Cards • National and Regional Retailers • Dual Cards™ • Local Merchants • Installment Loans • Manufacturers • Network Cards for Home and Auto • Buying Groups • Substantially All Credit is Promotional • Industry Associations Financing (excluding Oil & Gas) • ~70,000 partners with nearly 160,000 locations3 Interest and Fees on Loans1 Loan Receivables2 Average Active Accounts1 $2.7 billion $19.8 billion 12.1 million 16% 15% 21% 1. For the twelve months ended December 31, 2018. 2. As of December 31, 2018. 3. As of March 31, 2019. 2 Note: Percentages shown represent proportion of applicable metric for total company. Beginning in 1Q 2019, our Oil and Gas retail credit programs are now included in our Payment Solutions sales platform in Automotive. All 2018 reported metrics within this presentation have been recast to reflect this change.
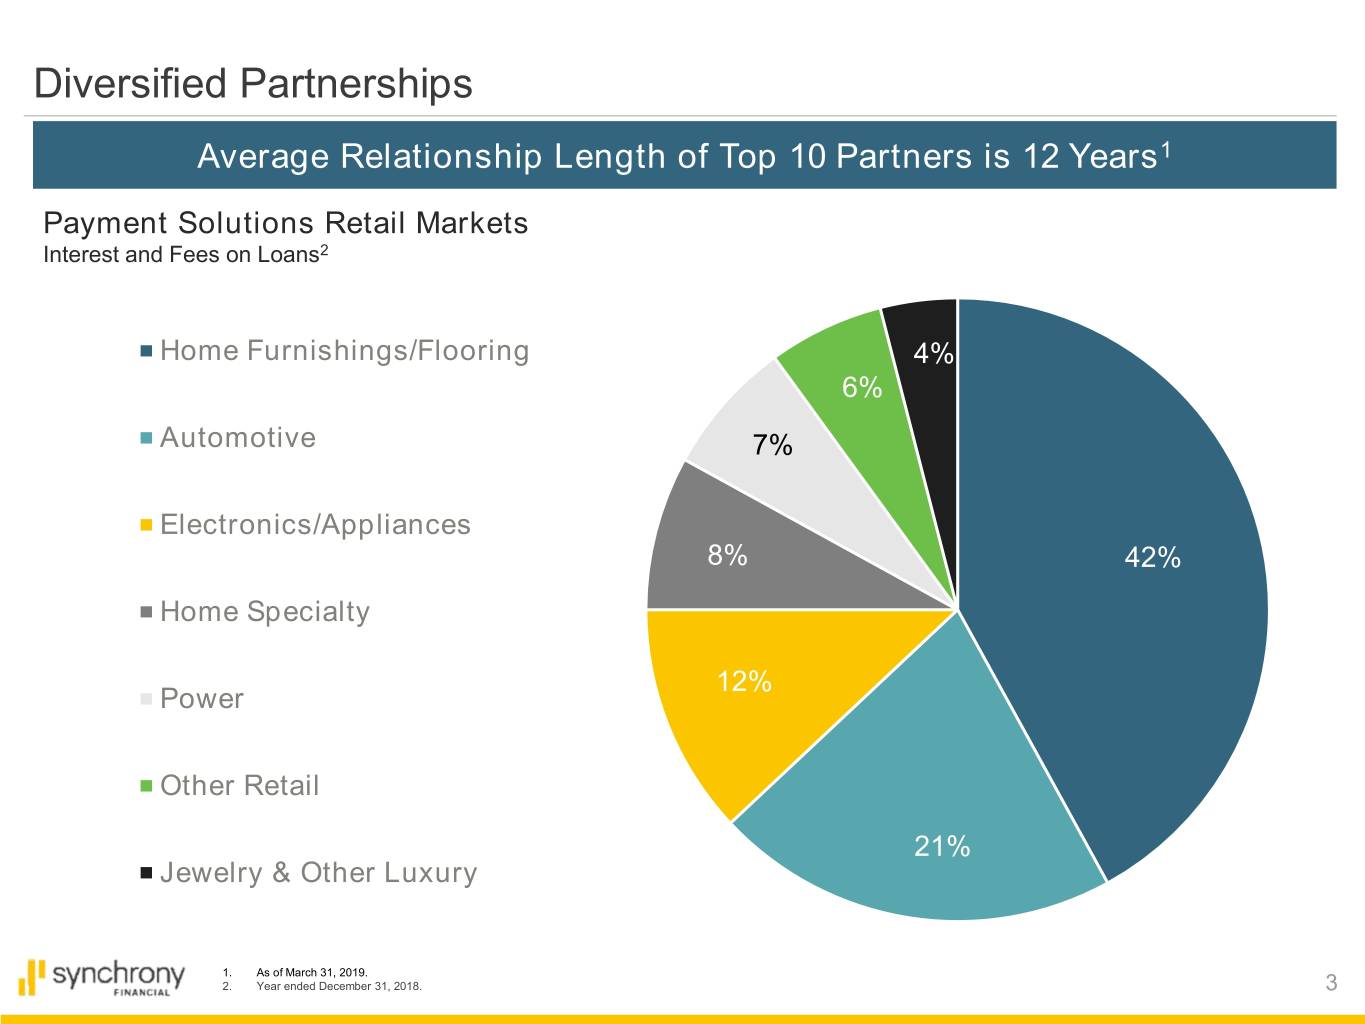
Diversified Partnerships Average Relationship Length of Top 10 Partners is 12 Years1 Payment Solutions Retail Markets Interest and Fees on Loans2 Home Furnishings/Flooring 4% 6% Automotive 7% Electronics/Appliances 8% 42% Home Specialty 12% Power Other Retail 21% Jewelry & Other Luxury 1. As of March 31, 2019. 2. Year ended December 31, 2018. 3
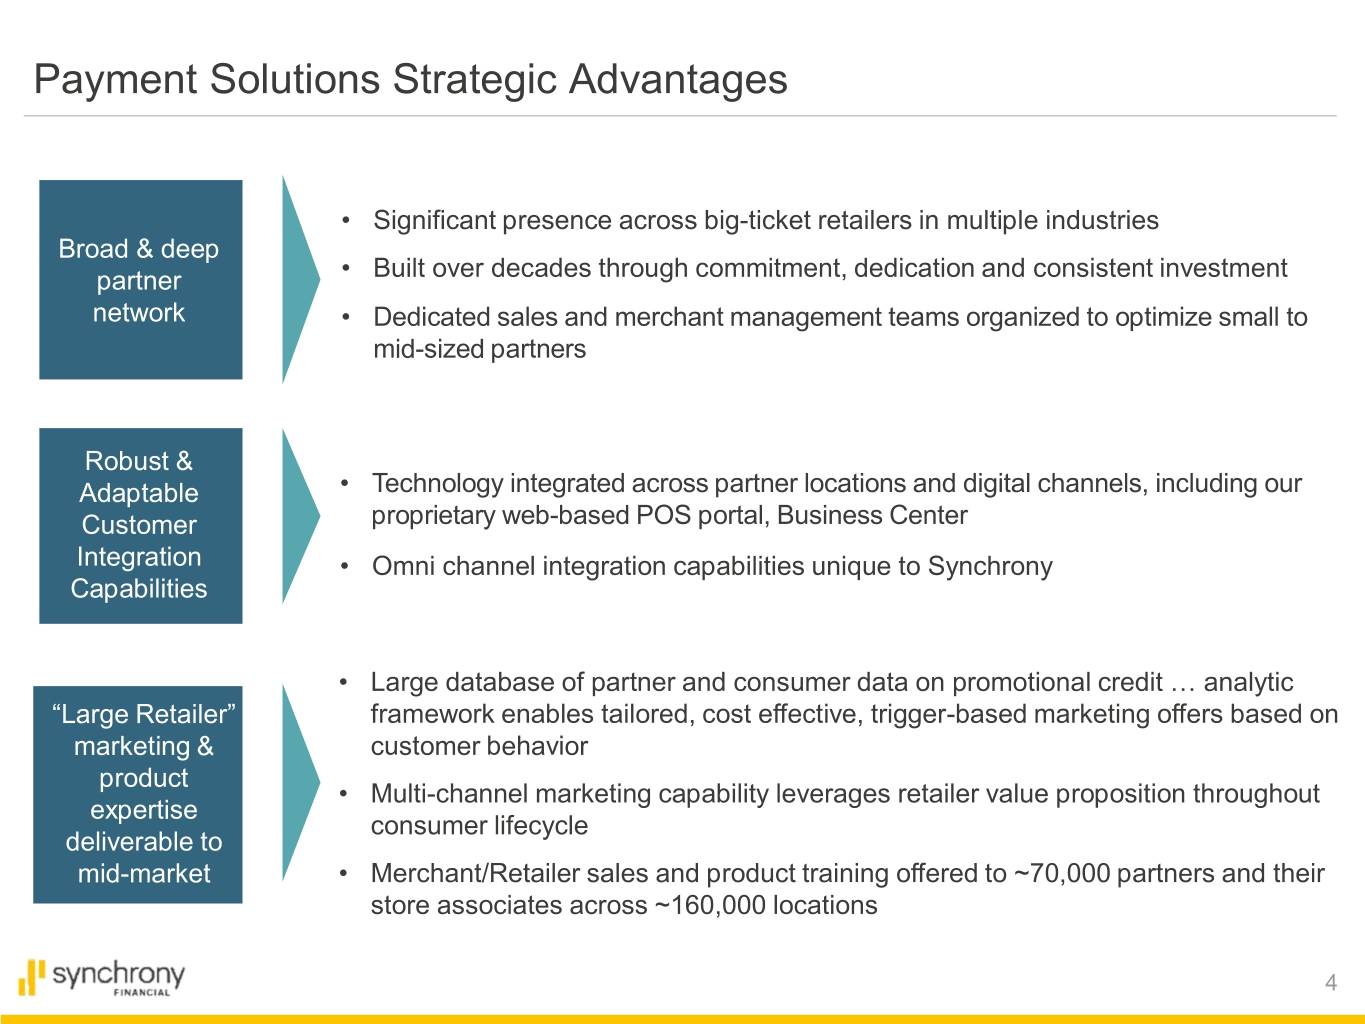
Payment Solutions Strategic Advantages • Significant presence across big-ticket retailers in multiple industries Broad & deep partner • Built over decades through commitment, dedication and consistent investment network • Dedicated sales and merchant management teams organized to optimize small to mid-sized partners Robust & Adaptable • Technology integrated across partner locations and digital channels, including our Customer proprietary web-based POS portal, Business Center Integration • Omni channel integration capabilities unique to Synchrony Capabilities • Large database of partner and consumer data on promotional credit … analytic “Large Retailer” framework enables tailored, cost effective, trigger-based marketing offers based on marketing & customer behavior product • Multi-channel marketing capability leverages retailer value proposition throughout expertise consumer lifecycle deliverable to mid-market • Merchant/Retailer sales and product training offered to ~70,000 partners and their store associates across ~160,000 locations 4
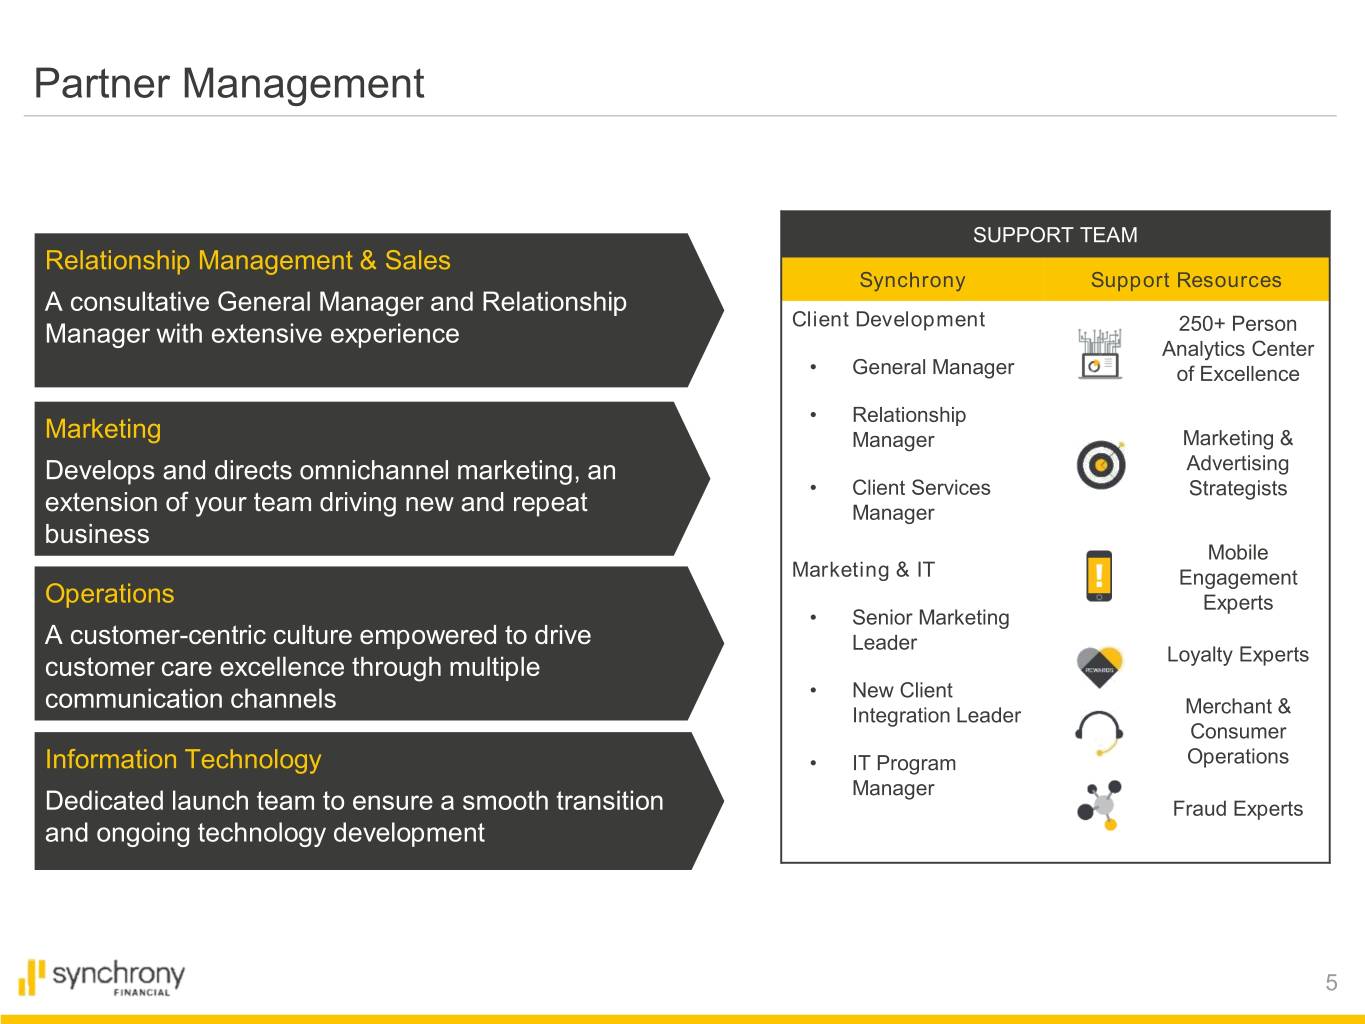
Partner Management SUPPORT TEAM Relationship Management & Sales Synchrony Support Resources A consultative General Manager and Relationship Client Development Manager with extensive experience 250+ Person Analytics Center • General Manager of Excellence • Relationship Marketing Manager Marketing & Develops and directs omnichannel marketing, an Advertising • Client Services Strategists extension of your team driving new and repeat Manager business Mobile Marketing & IT Engagement Operations Experts • Senior Marketing A customer-centric culture empowered to drive Leader customer care excellence through multiple Loyalty Experts communication channels • New Client Integration Leader Merchant & Consumer Information Technology • IT Program Operations Manager Dedicated launch team to ensure a smooth transition Fraud Experts and ongoing technology development 5
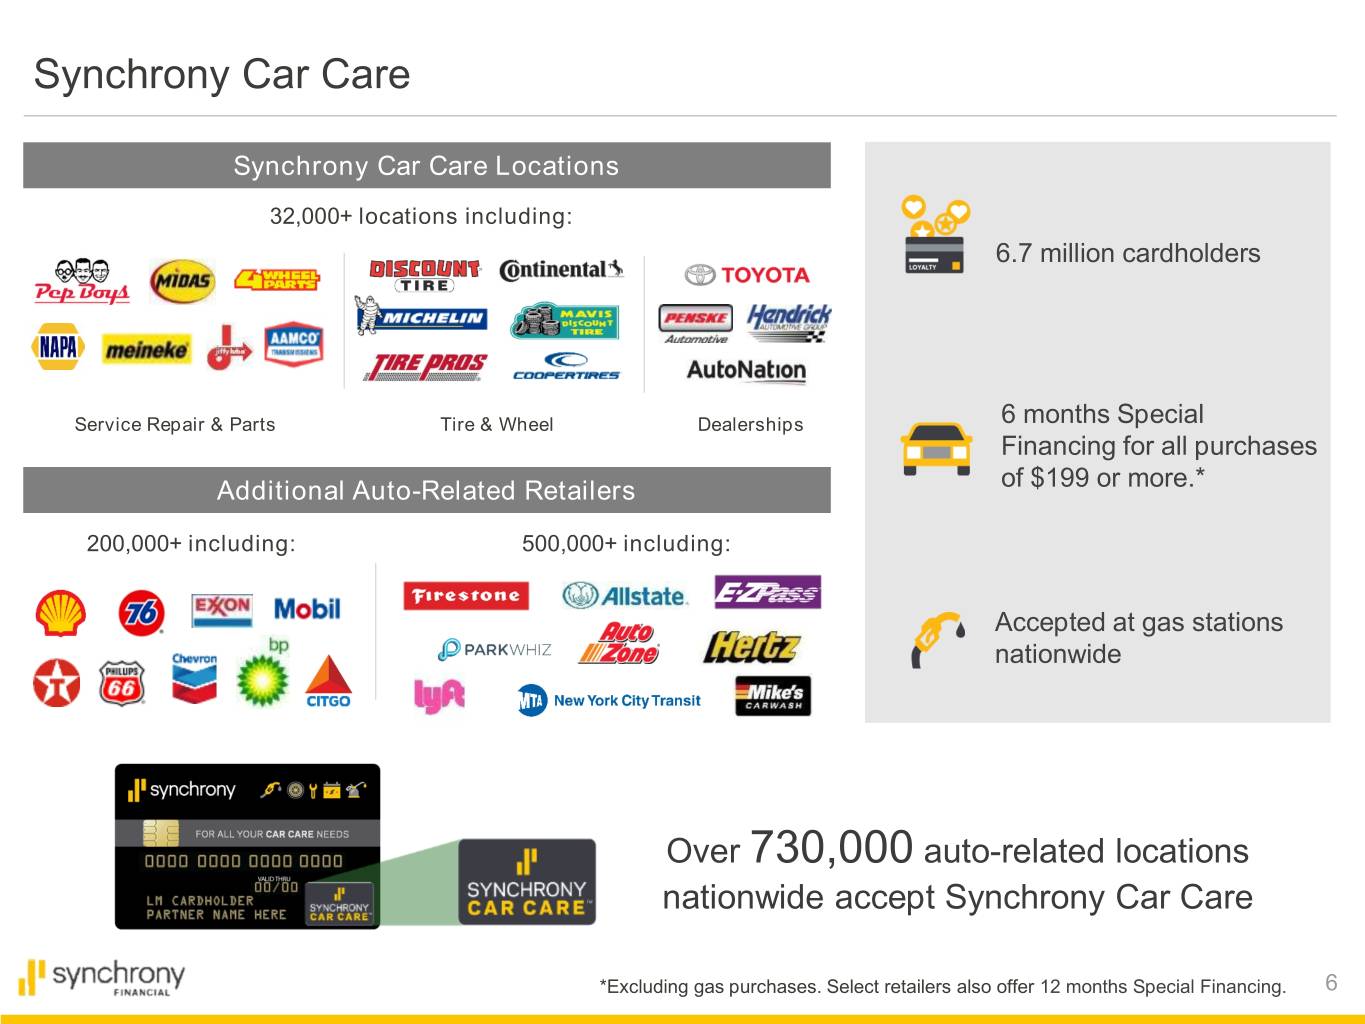
Synchrony Car Care Synchrony Car Care Locations 32,000+ locations including: 6.7 million cardholders Service Repair & Parts Tire & Wheel Dealerships 6 months Special Financing for all purchases Additional Auto-Related Retailers of $199 or more.* 200,000+ including: 500,000+ including: Accepted at gas stations nationwide Over 730,000 auto-related locations nationwide accept Synchrony Car Care *Excluding gas purchases. Select retailers also offer 12 months Special Financing. 6
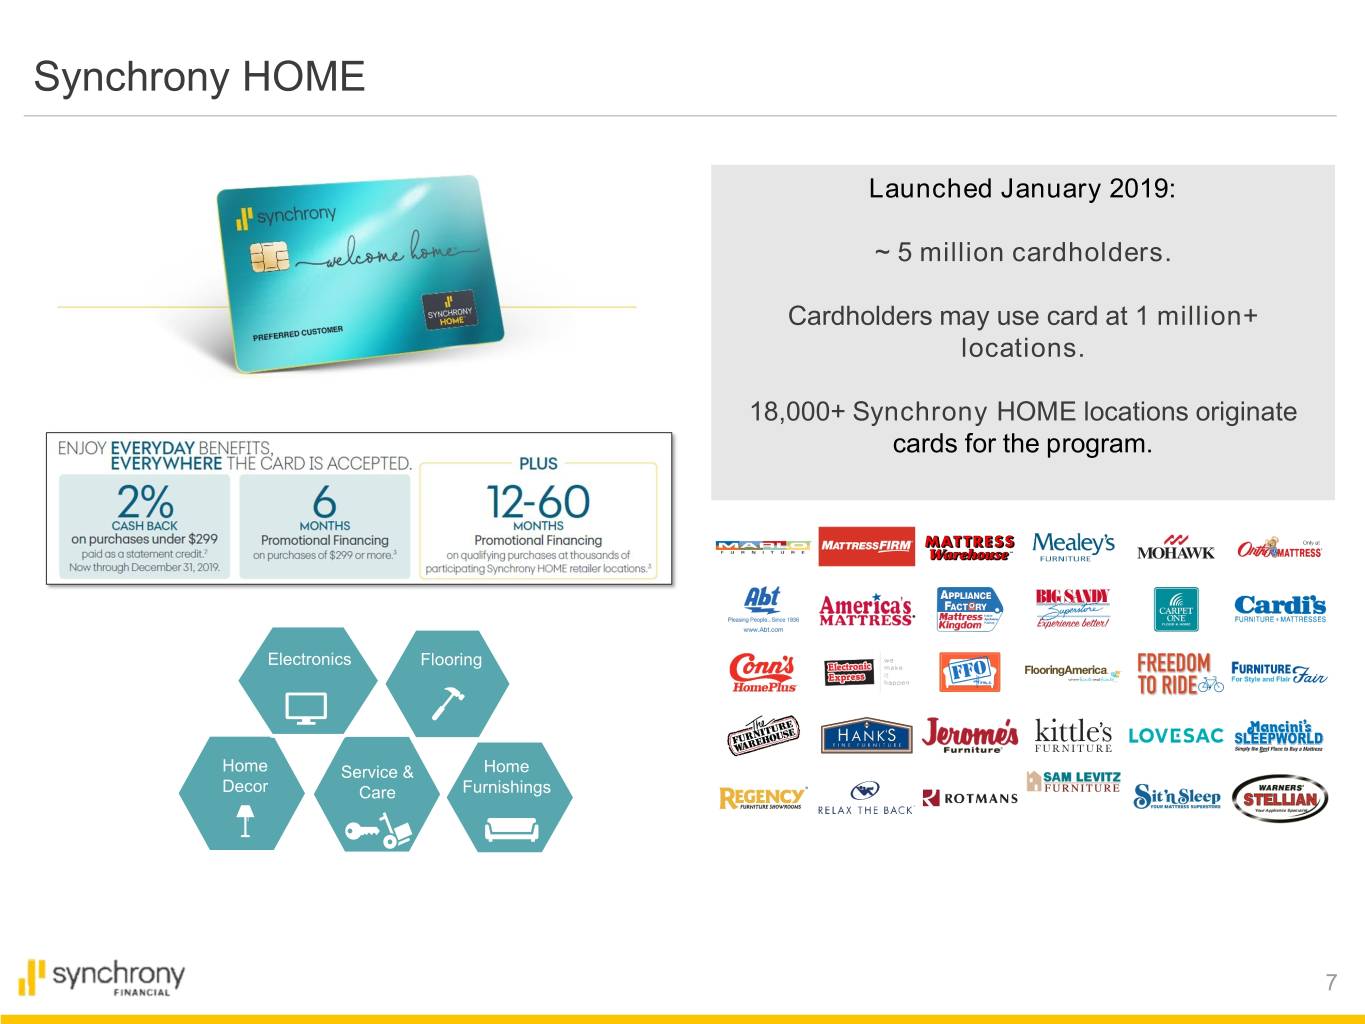
Synchrony HOME Launched January 2019: ~ 5 million cardholders. Cardholders may use card at 1 million+ locations. 18,000+ Synchrony HOME locations originate cards for the program. Electronics Flooring Home Service & Home Decor Care Furnishings 7
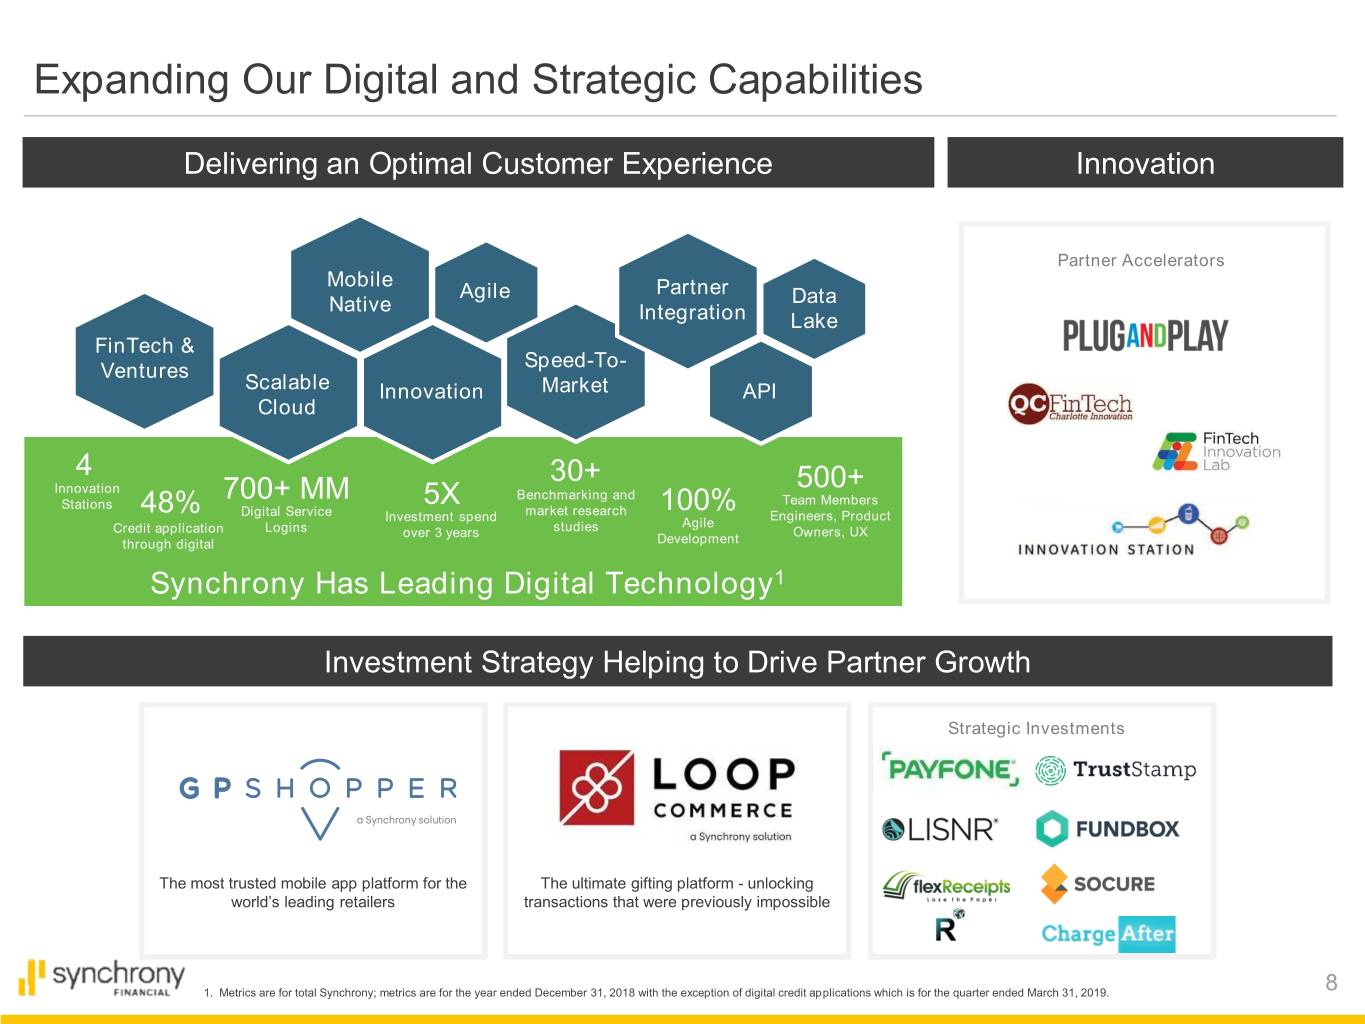
Expanding Our Digital and Strategic Capabilities Delivering an Optimal Customer Experience Innovation Partner Accelerators Mobile Agile Partner Native Data Integration Lake FinTech & Speed-To- Ventures Scalable Innovation Market API Cloud 4 30+ 500+ Innovation 700+ MM Benchmarking and Stations 5X 100% Team Members 48% Digital Service market research Engineers, Product Investment spend Agile Credit application Logins over 3 years studies Owners, UX through digital Development Synchrony Has Leading Digital Technology1 Investment Strategy Helping to Drive Partner Growth Strategic Investments The most trusted mobile app platform for the The ultimate gifting platform - unlocking world’s leading retailers transactions that were previously impossible 1. Metrics are for total Synchrony; metrics are for the year ended December 31, 2018 with the exception of digital credit applications which is for the quarter ended March 31, 2019. 8
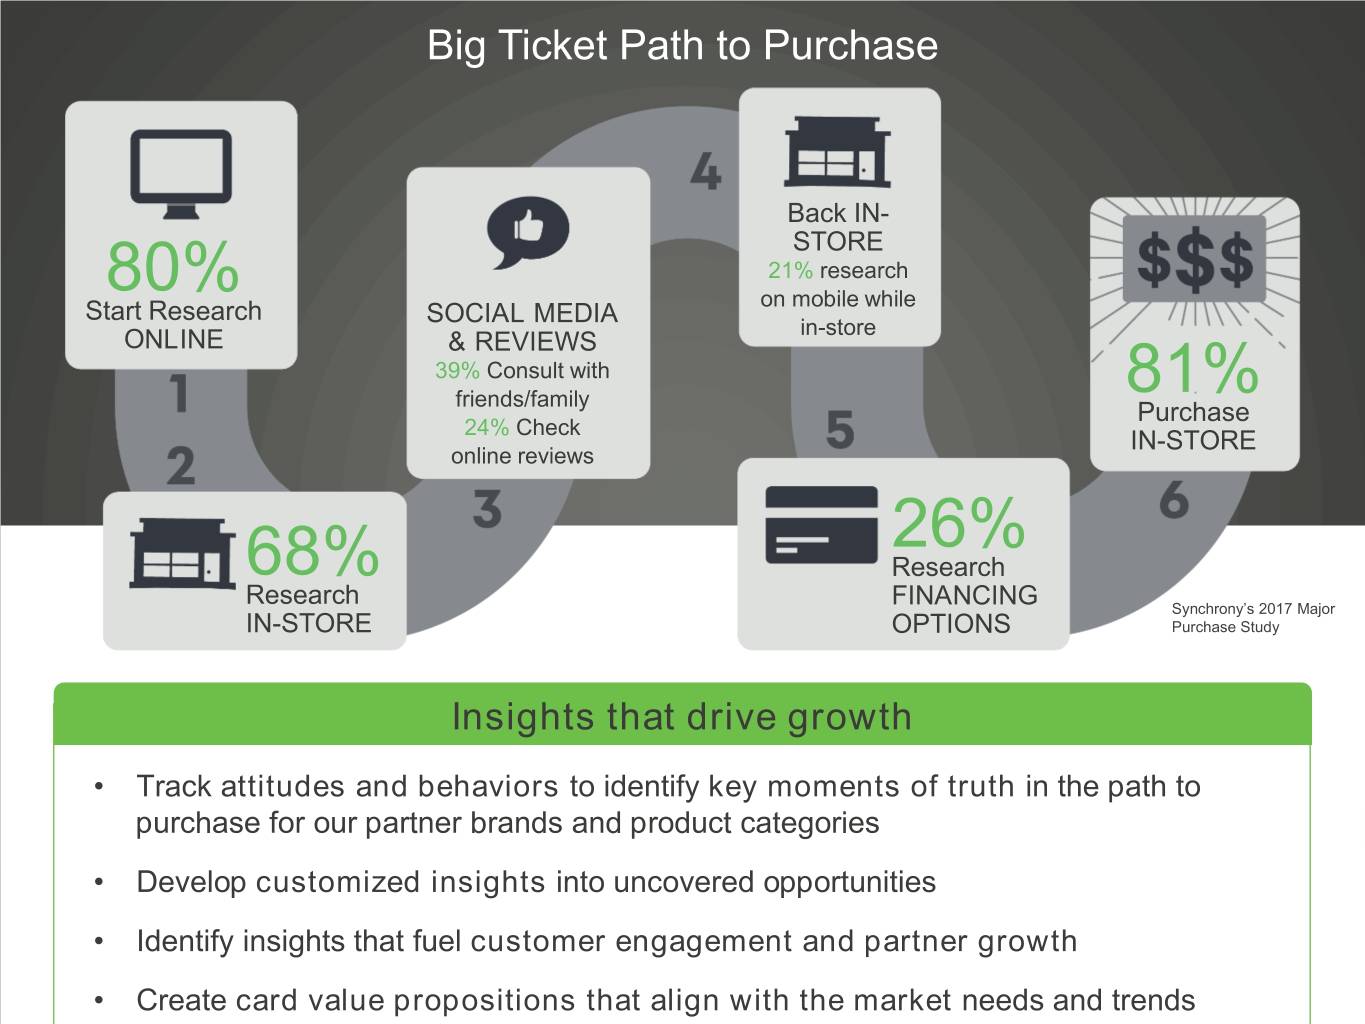
Big Ticket Path to Purchase Back IN- STORE 21% research 80% on mobile while Start Research SOCIAL MEDIA in-store ONLINE & REVIEWS 39% Consult with 81% friends/family Purchase 24% Check IN-STORE online reviews 26% 68% Research Research FINANCING Synchrony’s 2017 Major IN-STORE OPTIONS Purchase Study Insights thatKey Insights drive growth • Track attitudes and behaviors to identify key moments of truth in the path to purchase for our partner brands and product categories • Develop customized insights into uncovered opportunities • Identify insights that fuel customer engagement and partner growth • Create card value propositions that align with the market needs and trends
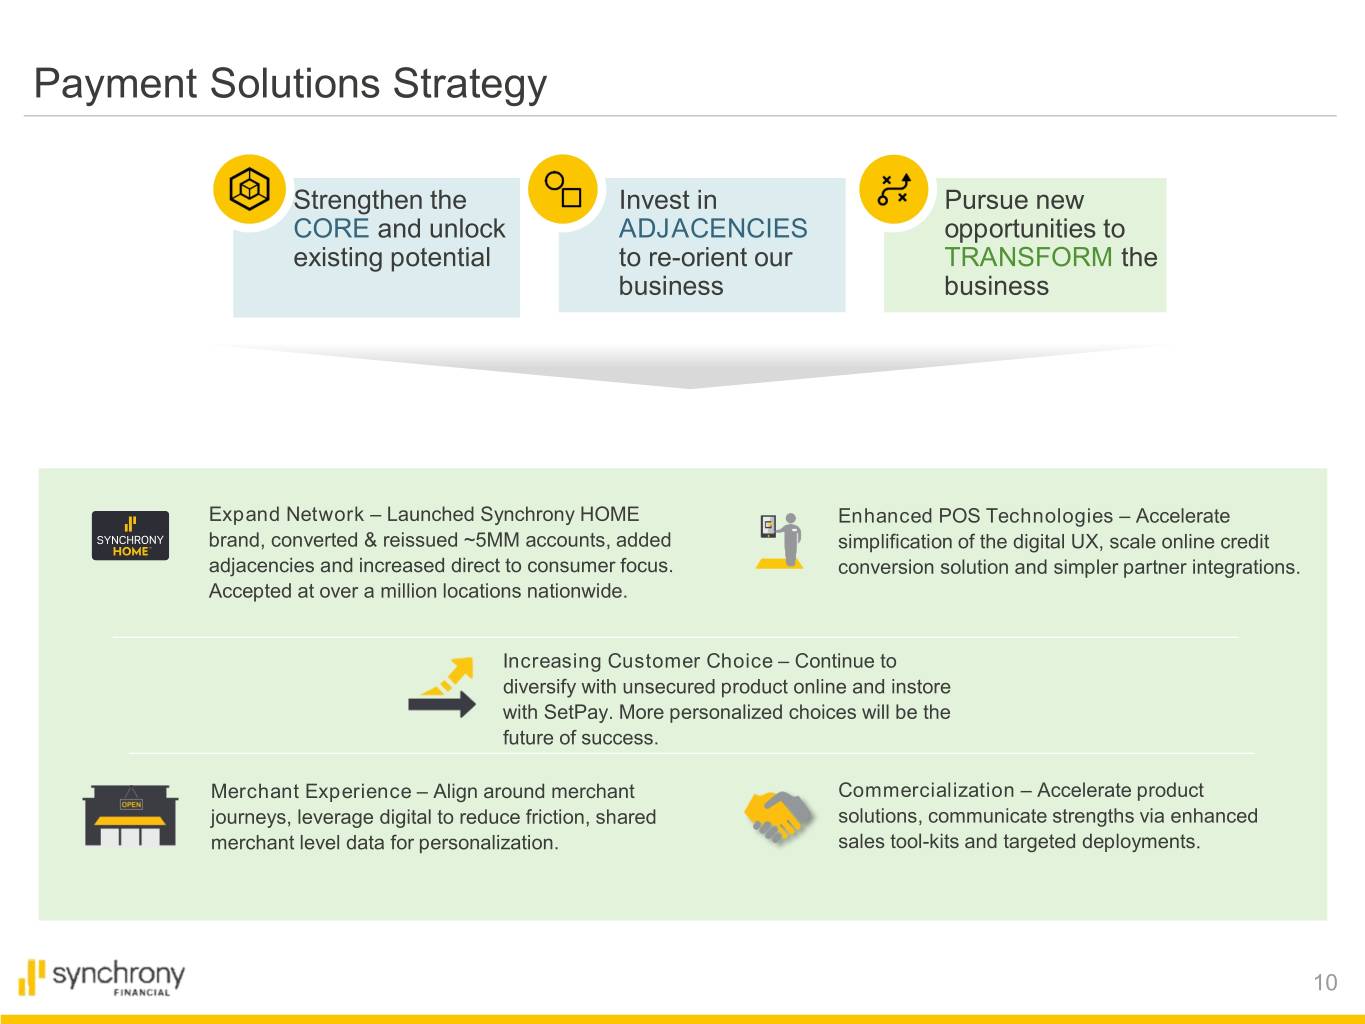
Payment Solutions Strategy Strengthen the Invest in Pursue new CORE and unlock ADJACENCIES opportunities to existing potential to re-orient our TRANSFORM the business business Expand Network – Launched Synchrony HOME Enhanced POS Technologies – Accelerate brand, converted & reissued ~5MM accounts, added simplification of the digital UX, scale online credit adjacencies and increased direct to consumer focus. conversion solution and simpler partner integrations. Accepted at over a million locations nationwide. Increasing Customer Choice – Continue to diversify with unsecured product online and instore with SetPay. More personalized choices will be the future of success. Merchant Experience – Align around merchant Commercialization – Accelerate product journeys, leverage digital to reduce friction, shared solutions, communicate strengths via enhanced merchant level data for personalization. sales tool-kits and targeted deployments. 10

Engage with us.
CareCredit
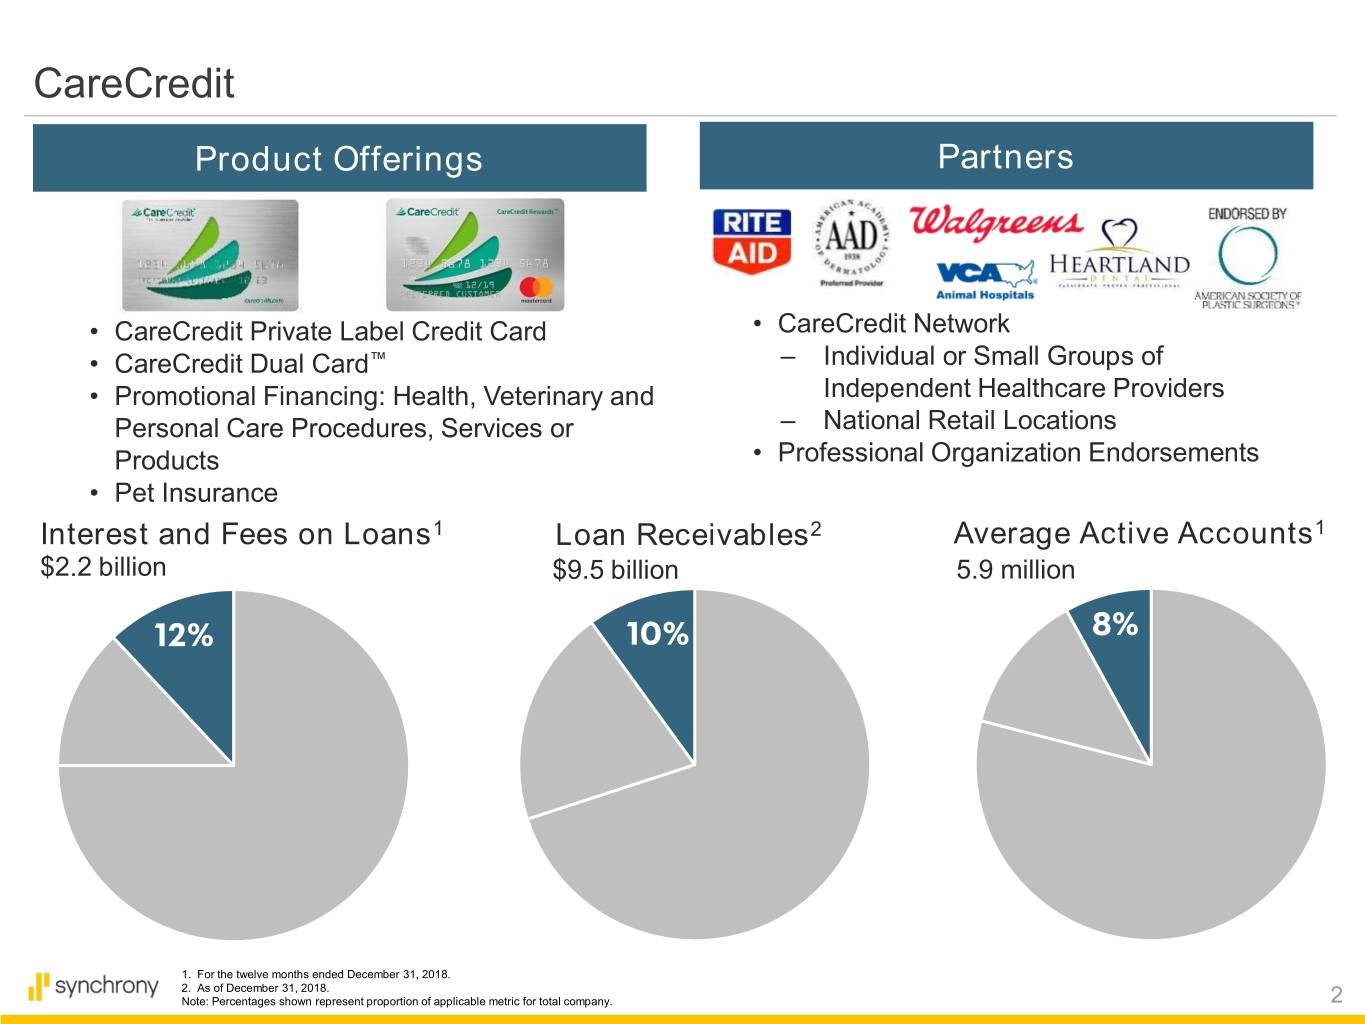
CareCredit Product Offerings Partners • CareCredit Private Label Credit Card • CareCredit Network • CareCredit Dual Card™ ‒ Individual or Small Groups of • Promotional Financing: Health, Veterinary and Independent Healthcare Providers Personal Care Procedures, Services or ‒ National Retail Locations Products • Professional Organization Endorsements • Pet Insurance Interest and Fees on Loans1 Loan Receivables2 Average Active Accounts1 $2.2 billion $9.5 billion 5.9 million 12% 10% 8% 1. For the twelve months ended December 31, 2018. 2. As of December 31, 2018. Note: Percentages shown represent proportion of applicable metric for total company. 2
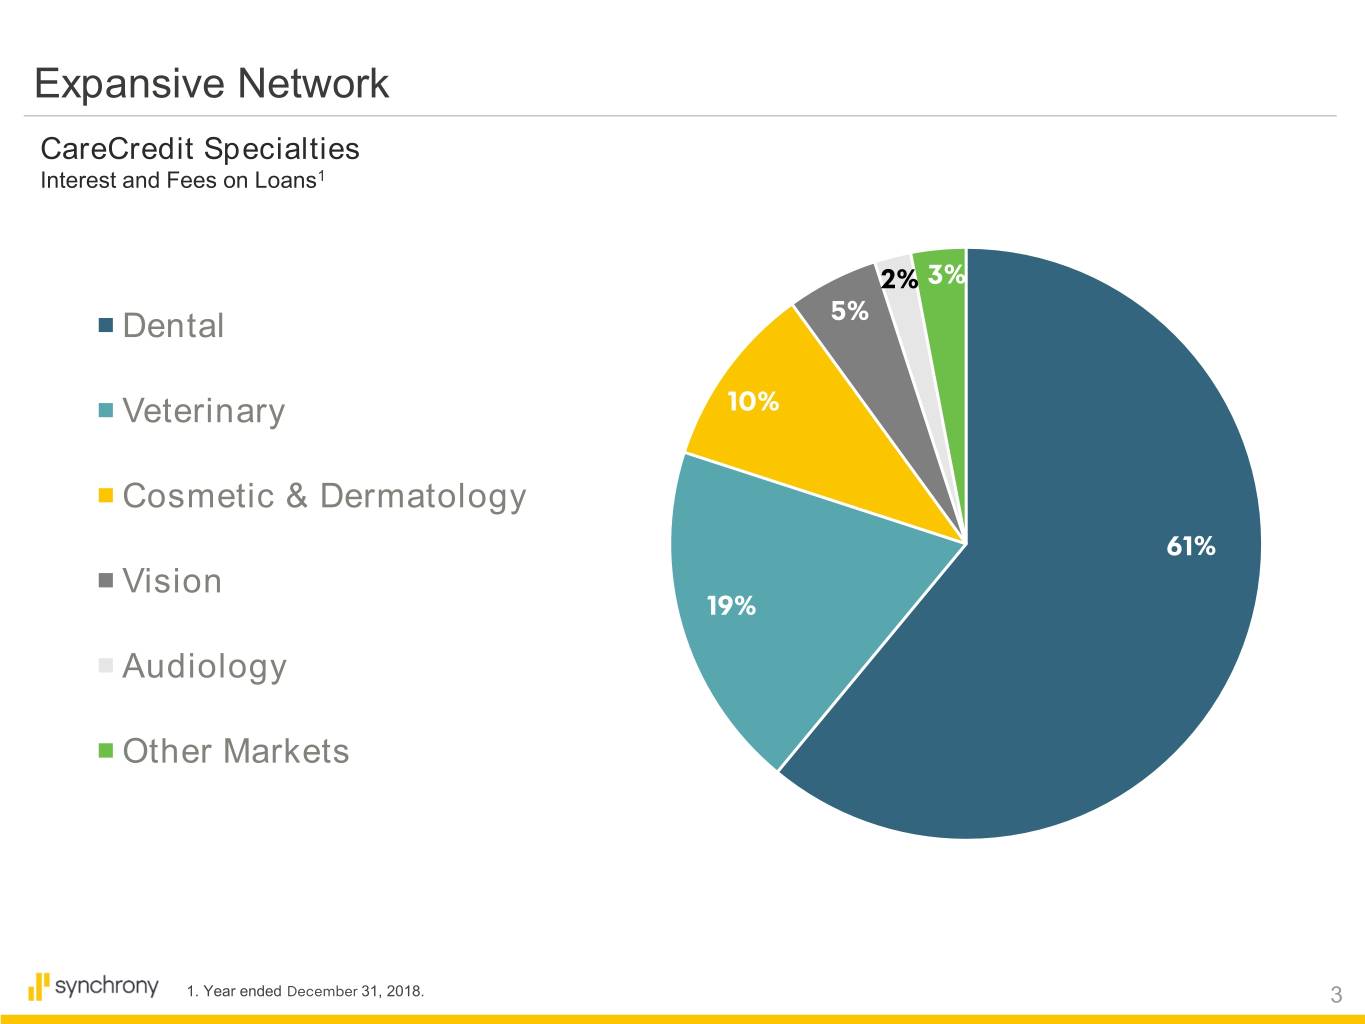
Expansive Network CareCredit Specialties Interest and Fees on Loans1 2% 3% Dental 5% Veterinary 10% Cosmetic & Dermatology 61% Vision 19% Audiology Other Markets 1. Year ended December 31, 2018. 3
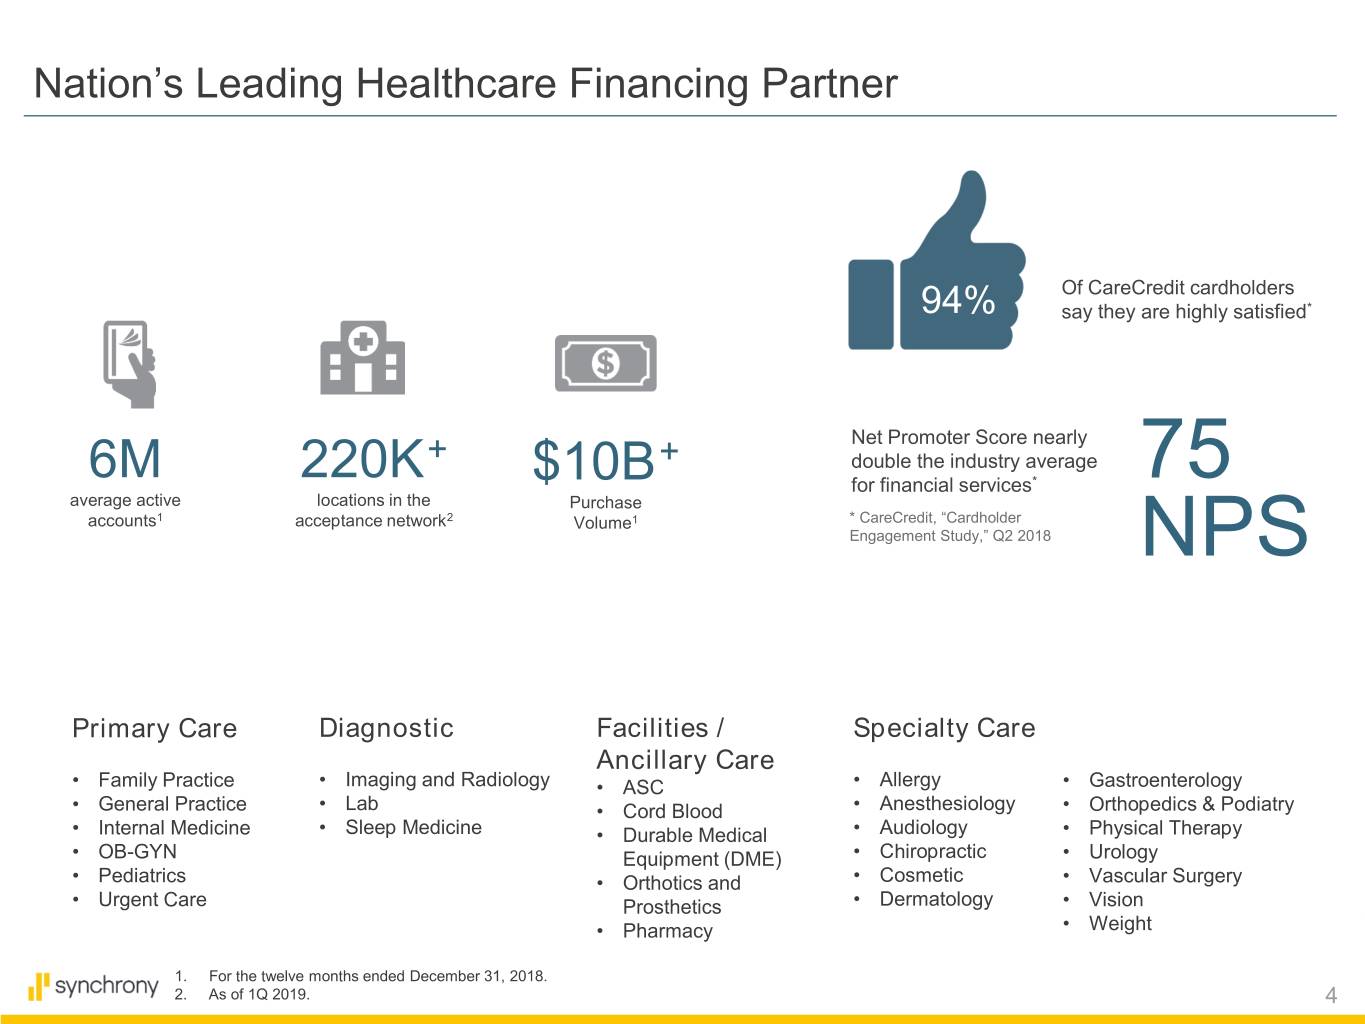
Nation’s Leading Healthcare Financing Partner Of CareCredit cardholders 94% say they are highly satisfied* Net Promoter Score nearly + + double the industry average 6M 220K $10B * 75 for financial services average active locations in the Purchase accounts1 acceptance network2 Volume1 * CareCredit, “Cardholder Engagement Study,” Q2 2018 NPS 1 Primary Care Diagnostic Facilities / Specialty Care Ancillary Care • Family Practice • Imaging and Radiology • ASC • Allergy • Gastroenterology • General Practice • Lab • Cord Blood • Anesthesiology • Orthopedics & Podiatry • Internal Medicine • Sleep Medicine • Durable Medical • Audiology • Physical Therapy • OB-GYN Equipment (DME) • Chiropractic • Urology • Pediatrics • Orthotics and • Cosmetic • Vascular Surgery • Urgent Care Prosthetics • Dermatology • Vision • Pharmacy • Weight 1. For the twelve months ended December 31, 2018. 2. As of 1Q 2019. 4
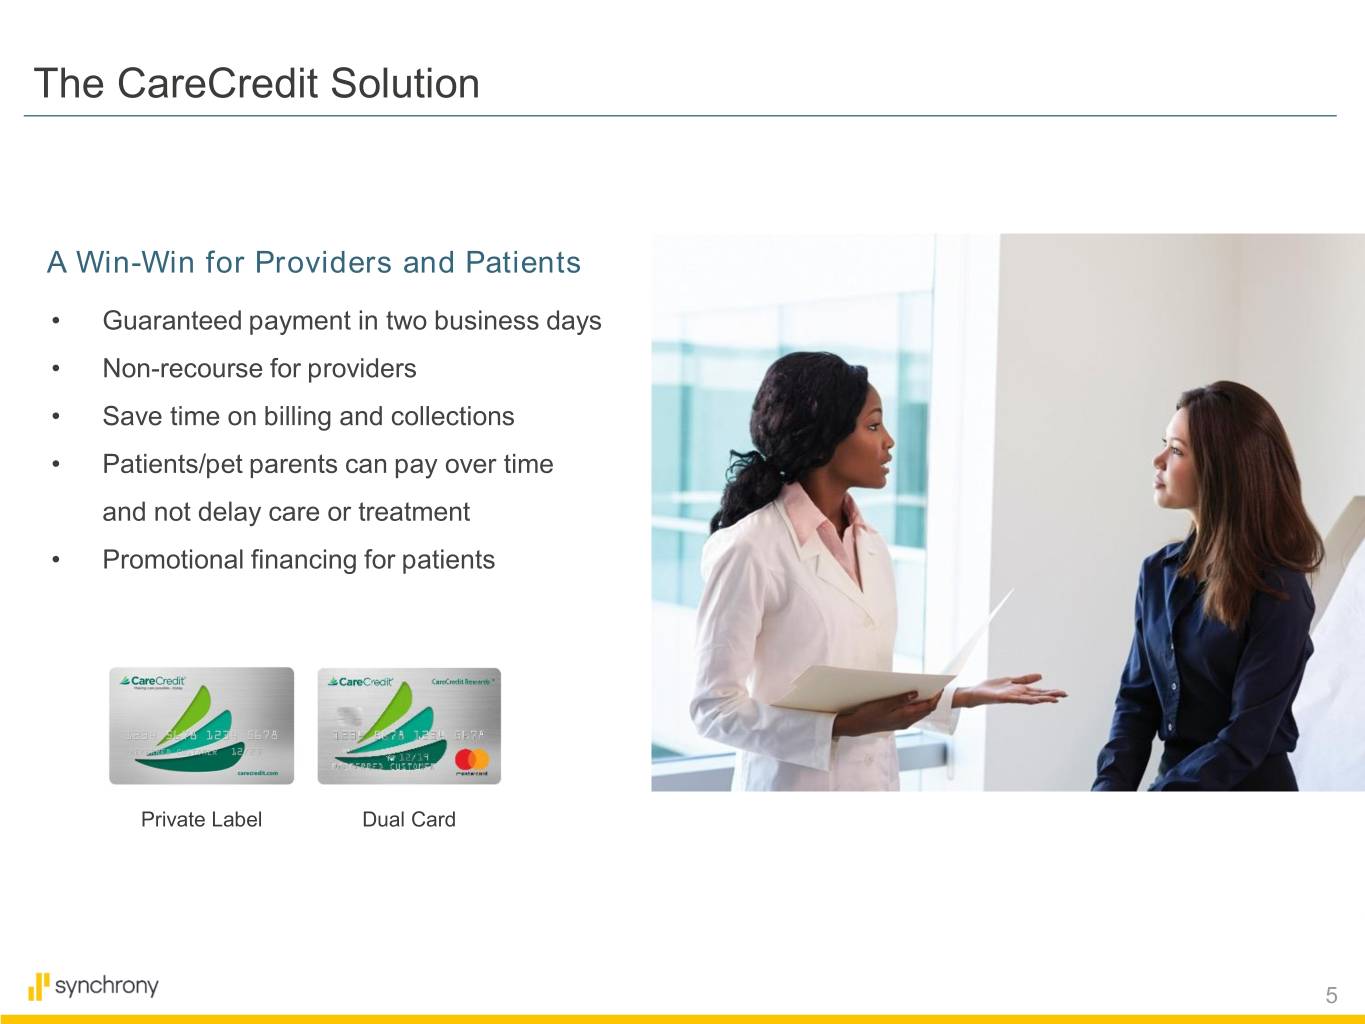
The CareCredit Solution A Win-Win for Providers and Patients • Guaranteed payment in two business days • Non-recourse for providers • Save time on billing and collections • Patients/pet parents can pay over time and not delay care or treatment • Promotional financing for patients Private Label Dual Card 5
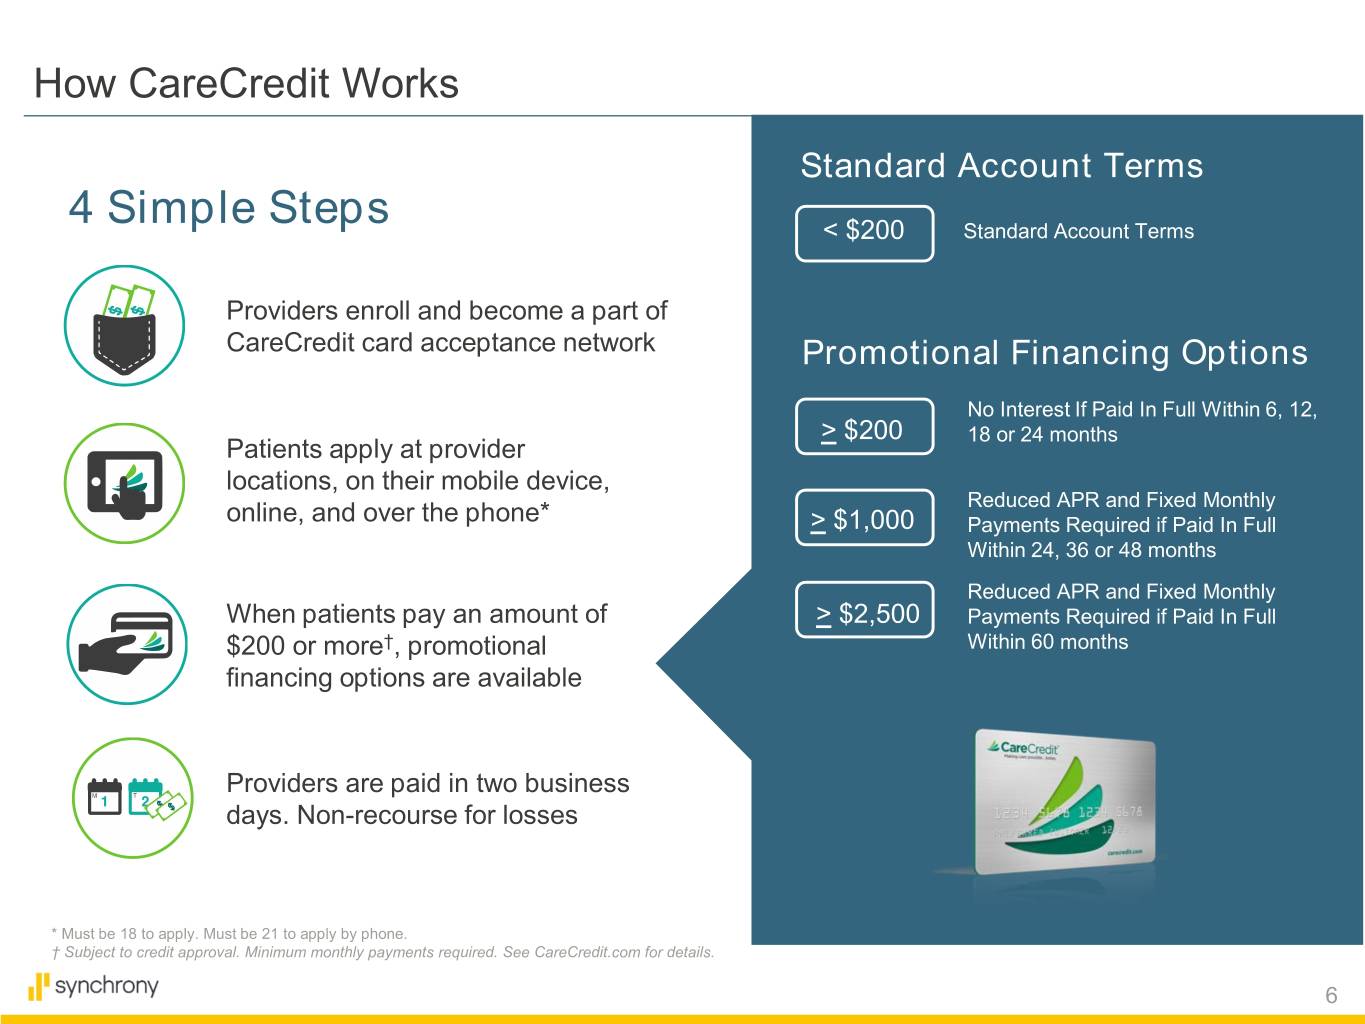
How CareCredit Works Standard Account Terms 4 Simple Steps < $200 Standard Account Terms Providers enroll and become a part of CareCredit card acceptance network Promotional Financing Options No Interest If Paid In Full Within 6, 12, > $200 18 or 24 months Patients apply at provider locations, on their mobile device, Reduced APR and Fixed Monthly online, and over the phone* > $1,000 Payments Required if Paid In Full Within 24, 36 or 48 months Reduced APR and Fixed Monthly When patients pay an amount of > $2,500 Payments Required if Paid In Full $200 or more†, promotional Within 60 months financing options are available Providers are paid in two business days. Non-recourse for losses * Must be 18 to apply. Must be 21 to apply by phone. † Subject to credit approval. Minimum monthly payments required. See CareCredit.com for details. 6
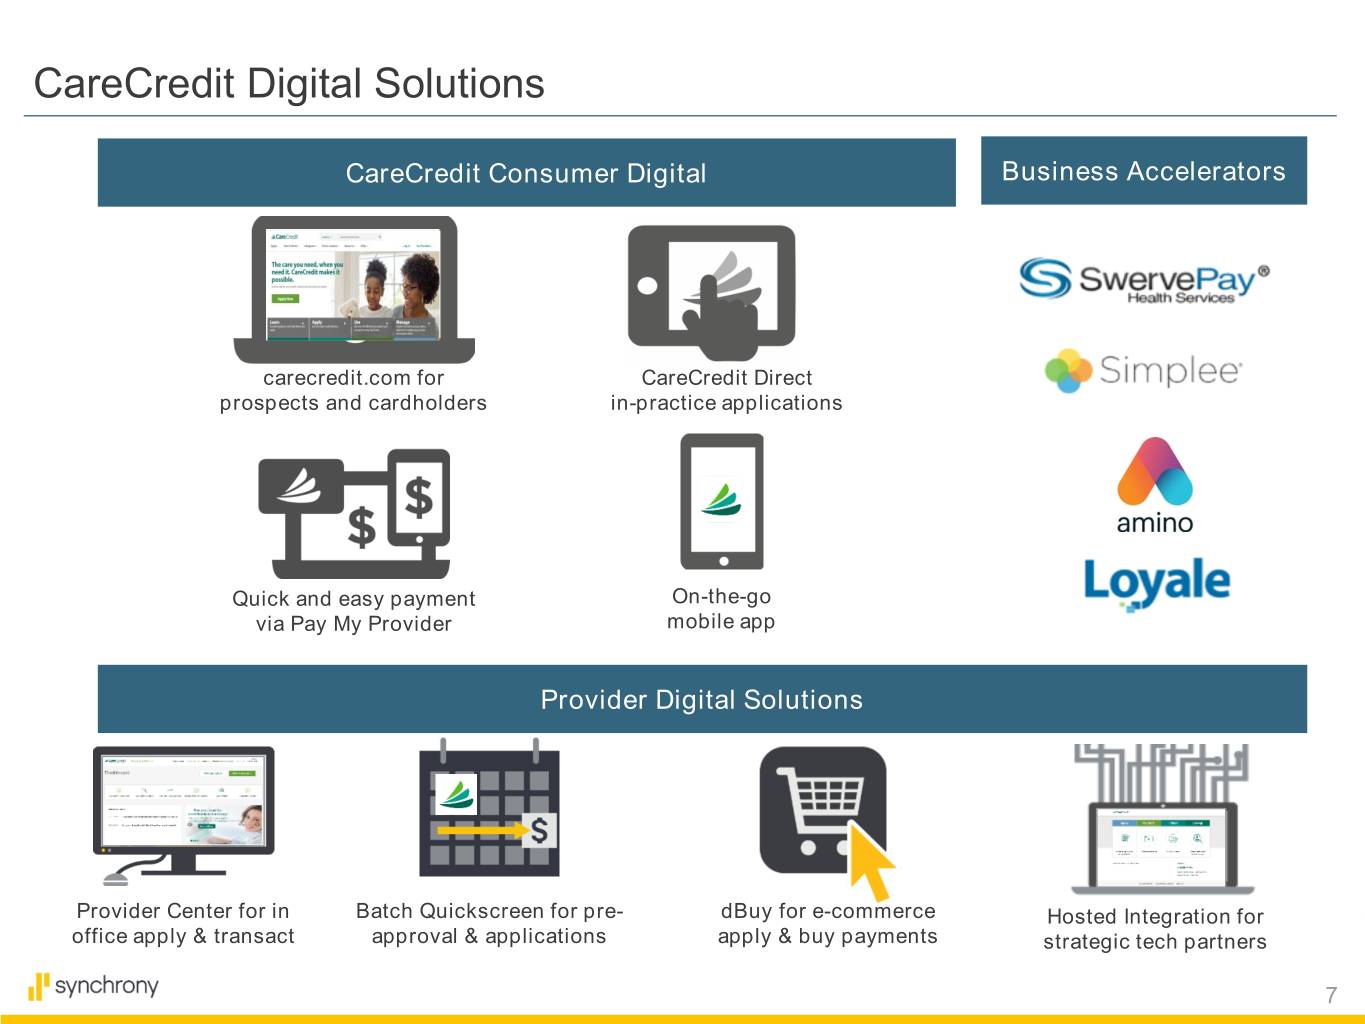
CareCredit Digital Solutions CareCredit Consumer Digital Business Accelerators carecredit.com for CareCredit Direct prospects and cardholders in-practice applications Quick and easy payment On-the-go via Pay My Provider mobile app Provider Digital Solutions Provider Center for in Batch Quickscreen for pre- dBuy for e-commerce Hosted Integration for office apply & transact approval & applications apply & buy payments strategic tech partners 7
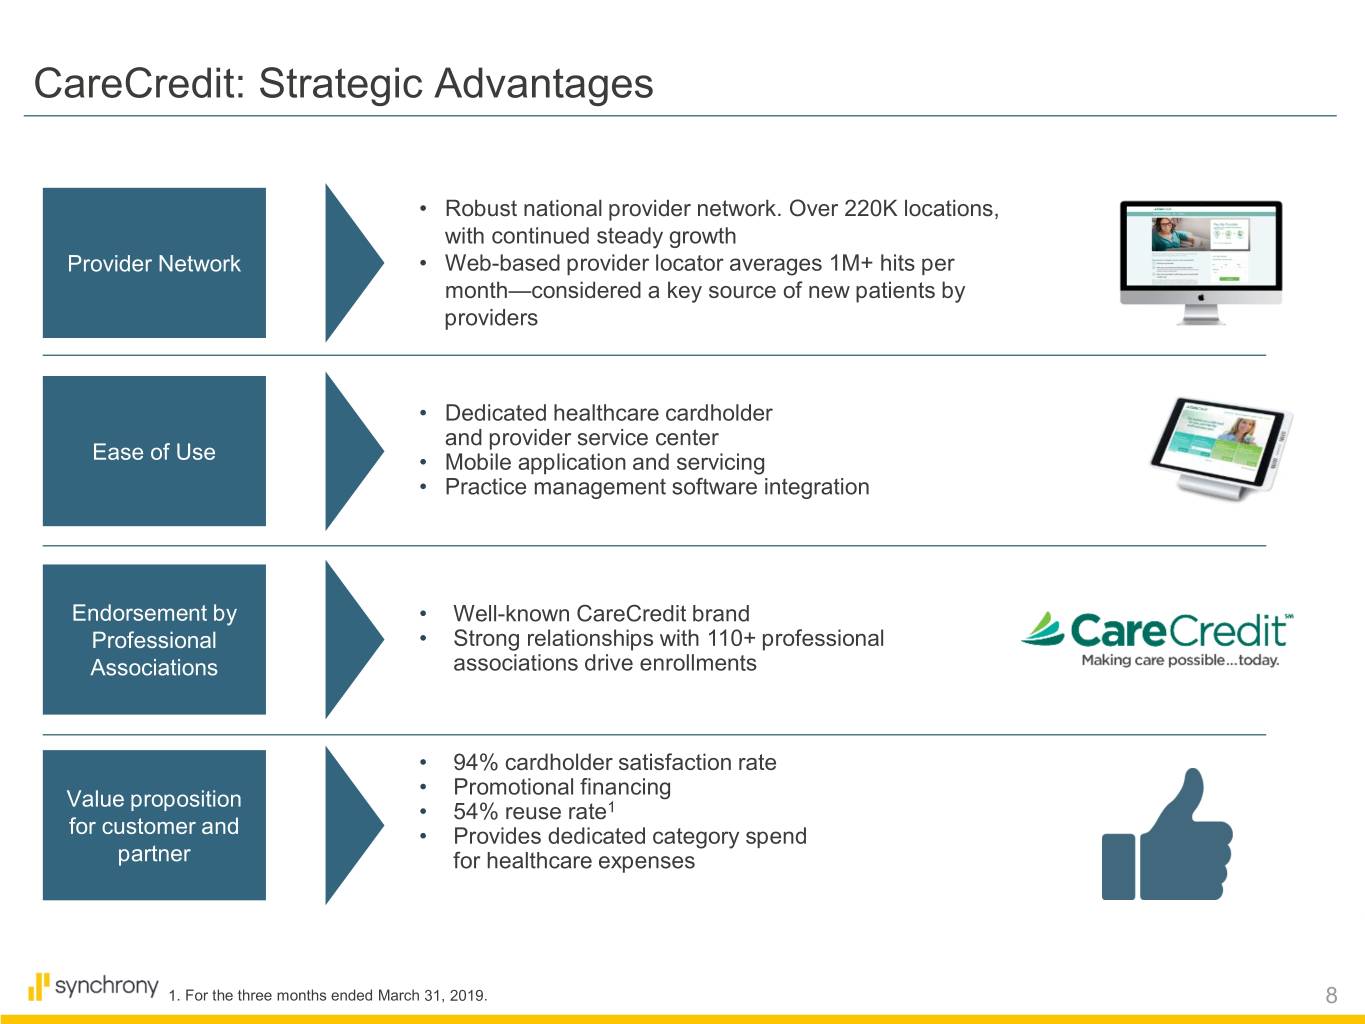
CareCredit: Strategic Advantages • Robust national provider network. Over 220K locations, with continued steady growth Provider Network • Web-based provider locator averages 1M+ hits per month—considered a key source of new patients by providers • Dedicated healthcare cardholder and provider service center Ease of Use • Mobile application and servicing • Practice management software integration Endorsement by • Well-known CareCredit brand Professional • Strong relationships with 110+ professional Associations associations drive enrollments • 94% cardholder satisfaction rate • Promotional financing Value proposition • 54% reuse rate1 for customer and • Provides dedicated category spend partner for healthcare expenses 1. For the three months ended March 31, 2019. 8
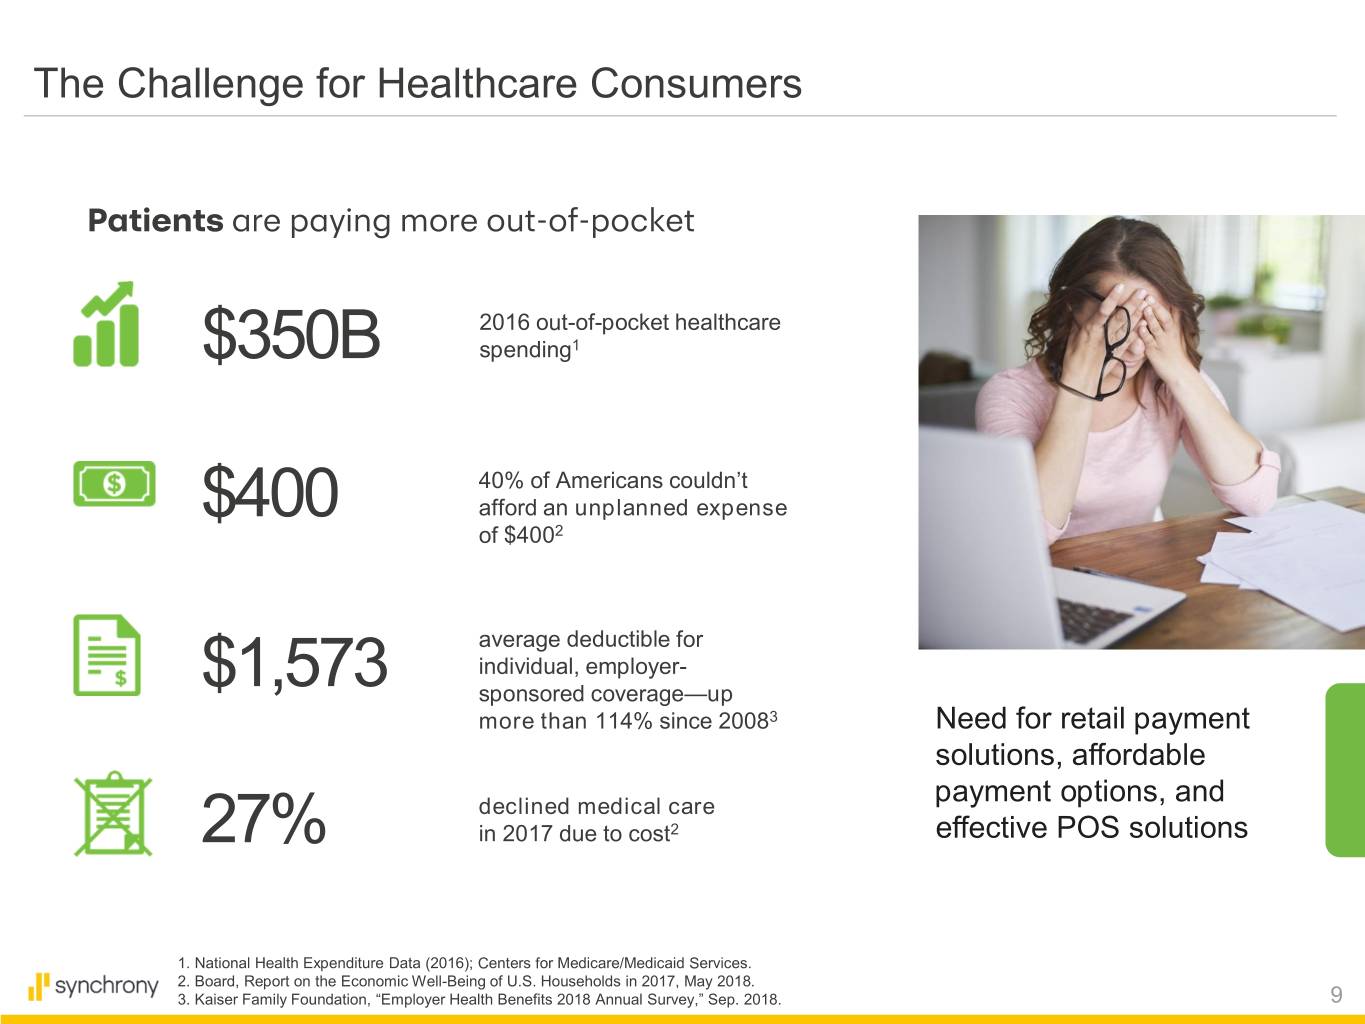
The Challenge for Healthcare Consumers Patients are paying more out-of-pocket 2016 out-of-pocket healthcare $350B spending1 40% of Americans couldn’t $400 afford an unplanned expense of $4002 average deductible for individual, employer- $1,573 sponsored coverage—up more than 114% since 20083 Need for retail payment solutions, affordable declined medical care payment options, and 27% in 2017 due to cost2 effective POS solutions 1. National Health Expenditure Data (2016); Centers for Medicare/Medicaid Services. 2. Board, Report on the Economic Well-Being of U.S. Households in 2017, May 2018. 3. Kaiser Family Foundation, “Employer Health Benefits 2018 Annual Survey,” Sep. 2018. 9
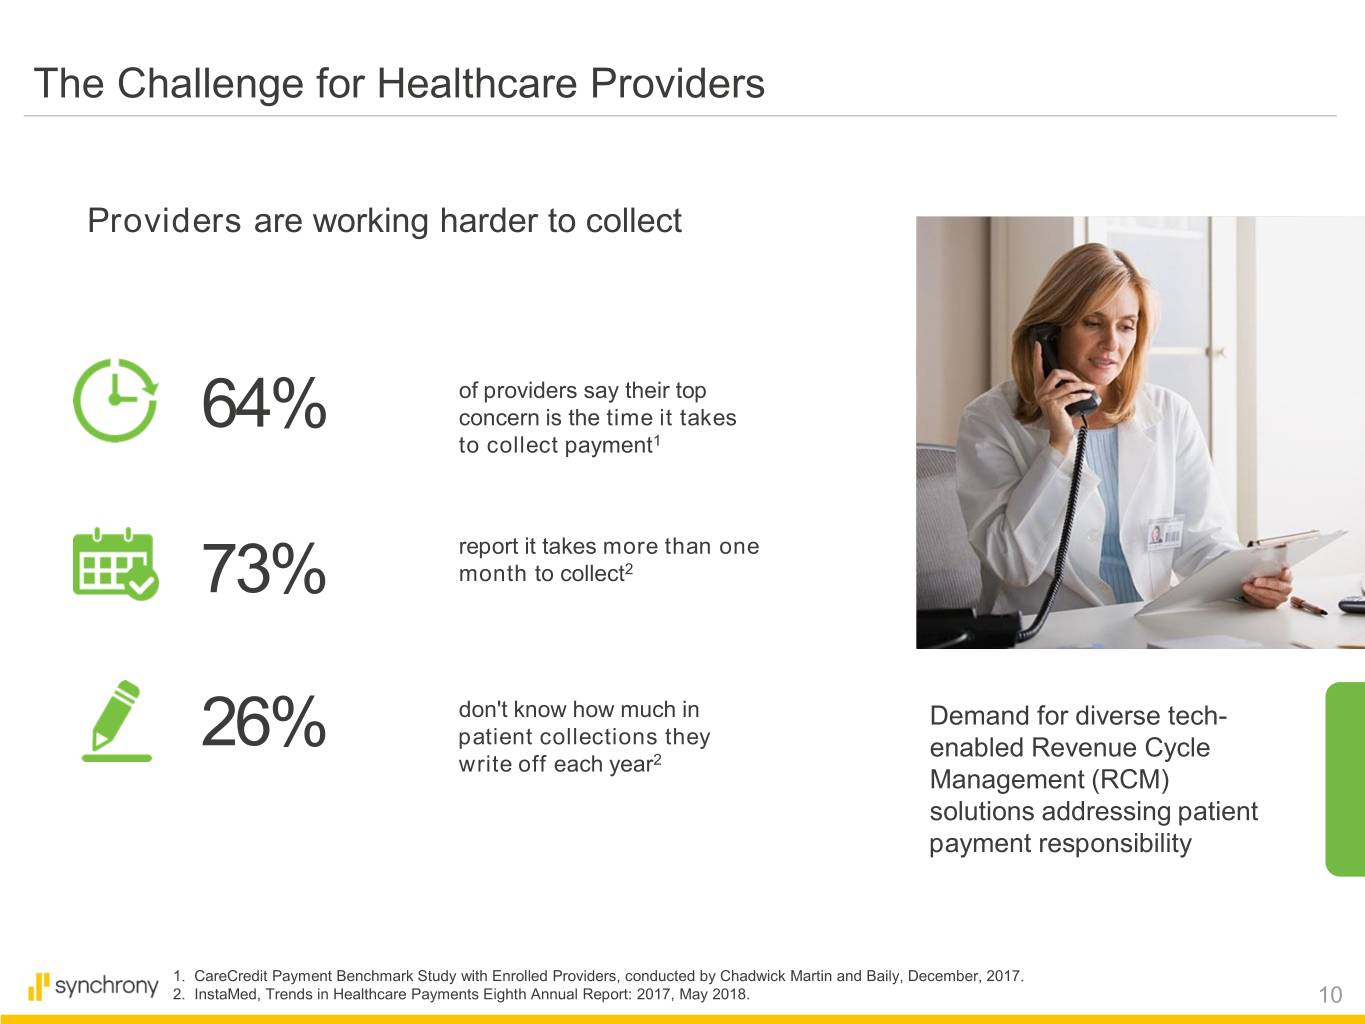
The Challenge for Healthcare Providers Providers are working harder to collect of providers say their top 64% concern is the time it takes to collect payment1 report it takes more than one 73% month to collect2 don't know how much in Demand for diverse tech- 26% patient collections they enabled Revenue Cycle write off each year2 Management (RCM) solutions addressing patient payment responsibility 1. CareCredit Payment Benchmark Study with Enrolled Providers, conducted by Chadwick Martin and Baily, December, 2017. 2. InstaMed, Trends in Healthcare Payments Eighth Annual Report: 2017, May 2018. 10
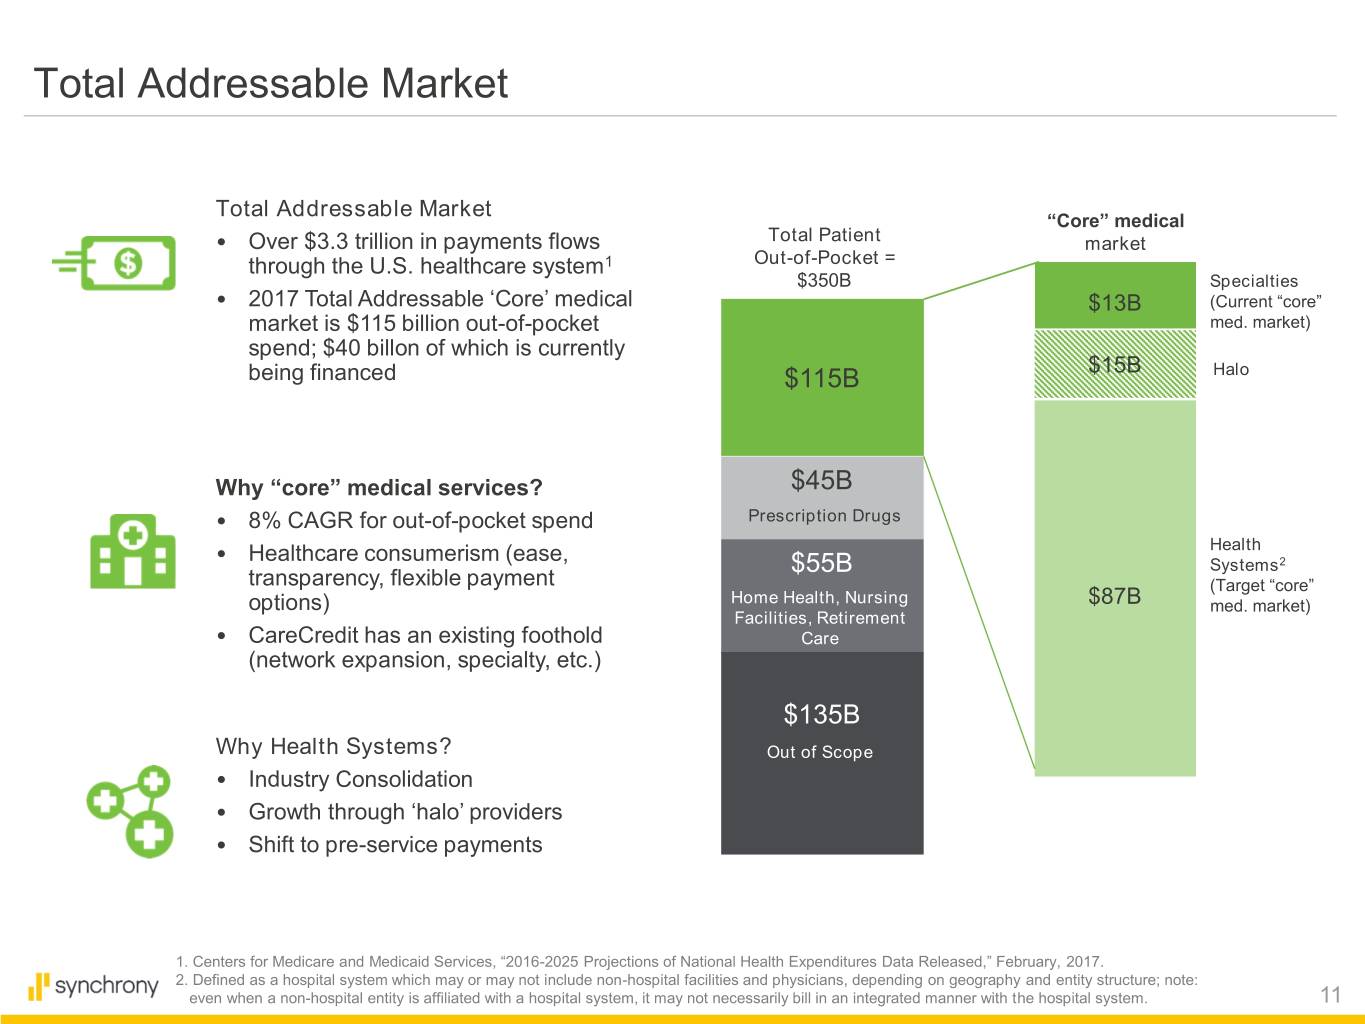
Total Addressable Market Total Addressable Market “Core” medical • Over $3.3 trillion in payments flows Total Patient market through the U.S. healthcare system1 Out-of-Pocket = $350B Specialties • 2017 Total Addressable ‘Core’ medical $13B (Current “core” market is $115 billion out-of-pocket med. market) spend; $40 billon of which is currently $15B being financed $115B Halo Why “core” medical services? $45B • 8% CAGR for out-of-pocket spend Prescription Drugs • Healthcare consumerism (ease, Health $55B Systems2 transparency, flexible payment (Target “core” options) Home Health, Nursing $87B med. market) Facilities, Retirement • CareCredit has an existing foothold Care (network expansion, specialty, etc.) $135B Why Health Systems? Out of Scope • Industry Consolidation • Growth through ‘halo’ providers • Shift to pre-service payments 1. Centers for Medicare and Medicaid Services, “2016-2025 Projections of National Health Expenditures Data Released,” February, 2017. 2. Defined as a hospital system which may or may not include non-hospital facilities and physicians, depending on geography and entity structure; note: even when a non-hospital entity is affiliated with a hospital system, it may not necessarily bill in an integrated manner with the hospital system. 11
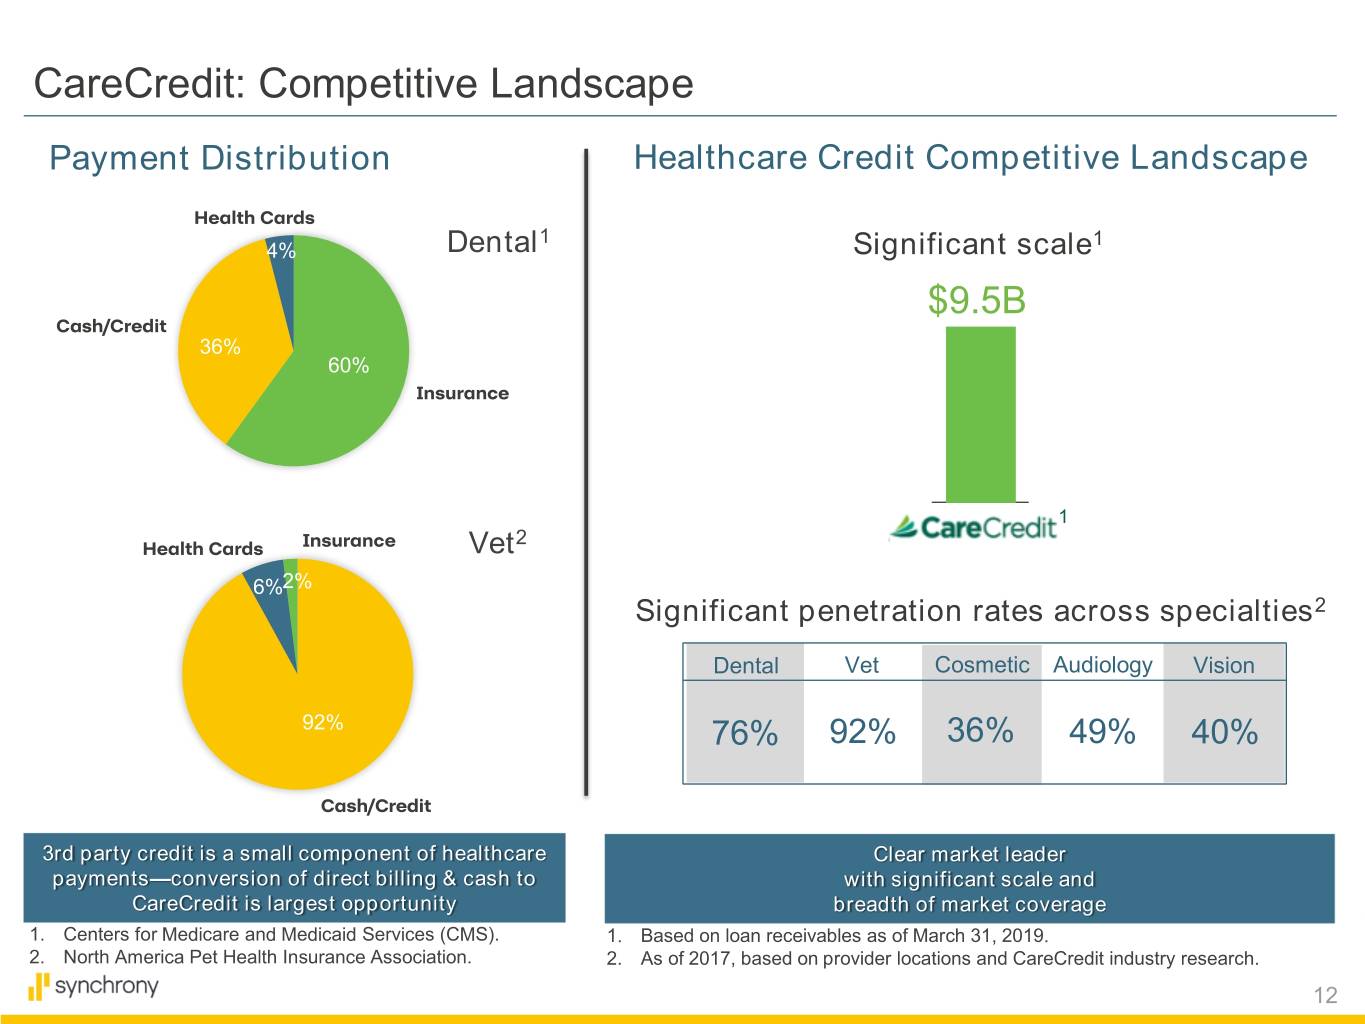
CareCredit: Competitive Landscape Payment Distribution Healthcare Credit Competitive Landscape Health Cards 1 1 4% Dental Significant scale $9.5B Cash/Credit 36% 60% Insurance 1 2 Health Cards Insurance Vet 6%2% Significant penetration rates across specialties2 Dental Vet Cosmetic Audiology Vision 92% 76% 92% 36% 49% 40% Cash/Credit 3rd party credit is a small component of healthcare Clear market leader payments—conversion of direct billing & cash to with significant scale and CareCredit is largest opportunity breadth of market coverage 1. Centers for Medicare and Medicaid Services (CMS). 1. Based on loan receivables as of March 31, 2019. 2. North America Pet Health Insurance Association. 2. As of 2017, based on provider locations and CareCredit industry research. 12
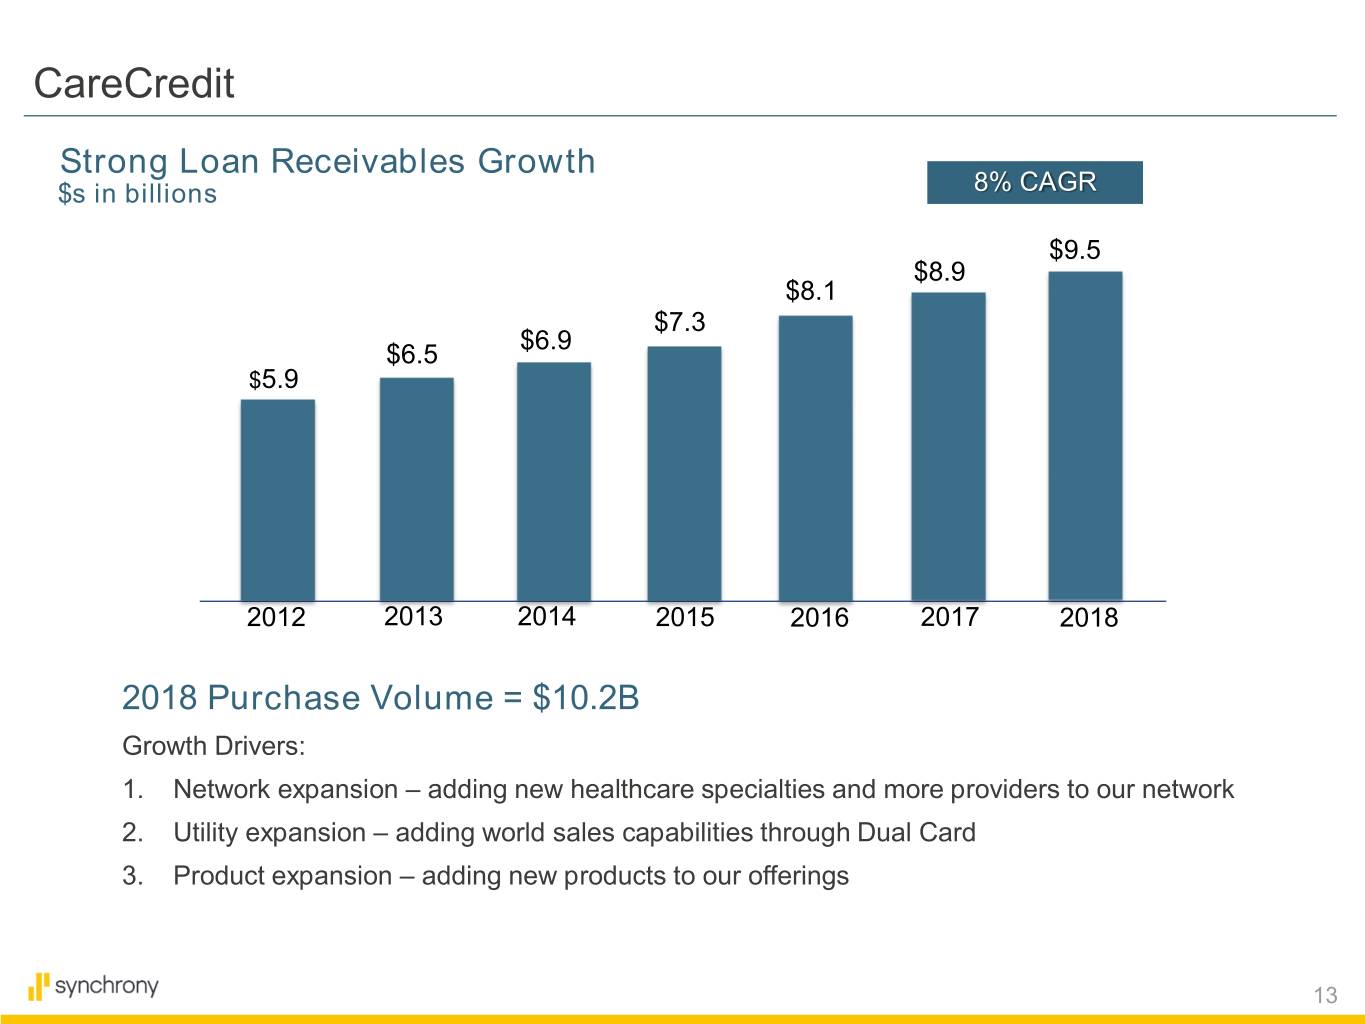
CareCredit Strong Loan Receivables Growth $s in billions 8% CAGR $9.5 $8.9 3% $8.1 $7.3 $6.9 $6.5 $5.9 2012 2013 2014 2015 2016 2017 2018 2018 Purchase Volume = $10.2B Growth Drivers: 1. Network expansion – adding new healthcare specialties and more providers to our network 2. Utility expansion – adding world sales capabilities through Dual Card 3. Product expansion – adding new products to our offerings 13
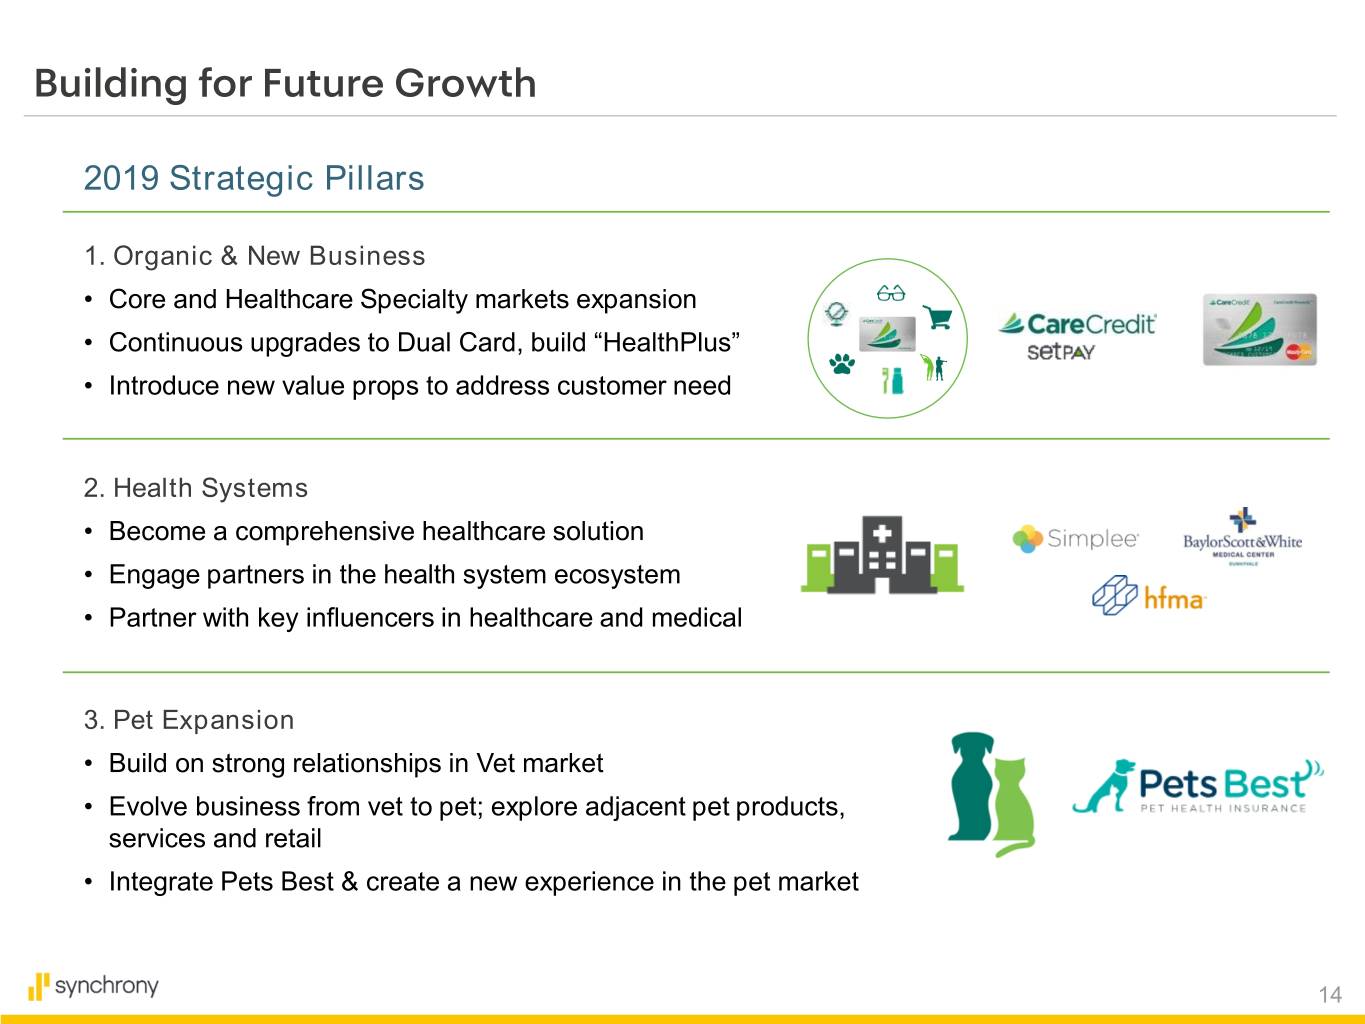
Building for Future Growth 2019 Strategic Pillars 1. Organic & New Business • Core and Healthcare Specialty markets expansion • Continuous upgrades to Dual Card, build “HealthPlus” • Introduce new value props to address customer need 2. Health Systems • Become a comprehensive healthcare solution • Engage partners in the health system ecosystem • Partner with key influencers in healthcare and medical 3. Pet Expansion • Build on strong relationships in Vet market • Evolve business from vet to pet; explore adjacent pet products, services and retail • Integrate Pets Best & create a new experience in the pet market 14

Engage with us.