Exhibit 99.1 2018 DFAST Annual Stress Test Disclosure For Synchrony Financial, a Savings and Loan Holding Company June 27, 2018
Disclaimers Cautionary Statement Regarding Forward-Looking Statements This presentation contains certain forward-looking statements as defined in Section 27A of the Securities Act of 1933, as amended, and Section 21E of the Securities Exchange Act of 1934, as amended, which are subject to the “safe harbor” created by those sections. Forward-looking statements may be identified by words such as “expects,” “intends,” “anticipates,” “plans,” “believes,” “seeks,” “targets,” “outlook,” “estimates,” “will,” “should,” “may” or words of similar meaning, but these words are not the exclusive means of identifying forward-looking statements. Forward-looking statements are based on management's current expectations and assumptions, and are subject to inherent uncertainties, risks and changes in circumstances that are difficult to predict. As a result, actual results could differ materially from those indicated in these forward-looking statements. Factors that could cause actual results to differ materially include global political, economic, business, competitive, market, regulatory and other factors and risks, such as: the impact of macroeconomic conditions and whether industry trends we have identified develop as anticipated; retaining existing partners and attracting new partners, concentration of our revenue in a small number of Retail Card partners, promotion and support of our products by our partners, and financial performance of our partners; cyber-attacks or other security breaches; higher borrowing costs and adverse financial market conditions impacting our funding and liquidity, and any reduction in our credit ratings; our ability to grow our deposits in the future; our ability to securitize our loan receivables, occurrence of an early amortization of our securitization facilities, loss of the right to service or subservice our securitized loan receivables, and lower payment rates on our securitized loan receivables; changes in market interest rates and the impact of any margin compression; effectiveness of our risk management processes and procedures, reliance on models which may be inaccurate or misinterpreted, our ability to manage our credit risk, the sufficiency of our allowance for loan losses and the accuracy of the assumptions or estimates used in preparing our financial statements; our ability to offset increases in our costs in retailer share arrangements; competition in the consumer finance industry; our concentration in the U.S. consumer credit market; our ability to successfully develop and commercialize new or enhanced products and services; our ability to realize the value of acquisitions and strategic investments; reductions in interchange fees; fraudulent activity; failure of third parties to provide various services that are important to our operations; disruptions in the operations of our computer systems and data centers; international risks and compliance and regulatory risks and costs associated with international operations; alleged infringement of intellectual property rights of others and our ability to protect our intellectual property; litigation and regulatory actions; damage to our reputation; our ability to attract, retain and motivate key officers and employees; tax legislation initiatives or challenges to our tax positions and/or interpretations, and state sales tax rules and regulations; a material indemnification obligation to GE under the Tax Sharing and Separation Agreement with GE if we cause the split-off from GE or certain preliminary transactions to fail to qualify for tax-free treatment or in the case of certain significant transfers of our stock following the split-off; regulation, supervision, examination and enforcement of our business by governmental authorities, the impact of the Dodd- Frank Wall Street Reform and Consumer Protection Act and the impact of the Consumer Financial Protection Bureau’s regulation of our business; impact of capital adequacy rules and liquidity requirements; restrictions that limit our ability to pay dividends and repurchase our common stock, and restrictions that limit the Synchrony Bank’s ability to pay dividends to us; regulations relating to privacy, information security and data protection; use of third-party vendors and ongoing third-party business relationships; and failure to comply with anti-money laundering and anti-terrorism financing laws. Forward-looking statements in this presentation include projections of Synchrony Financial’s and Synchrony Bank’s results of operations and financial condition, under hypothetical scenarios incorporating a set of assumed economic and financial conditions that are more adverse than Synchrony Financial and Synchrony Bank expect, as prescribed by the Federal Reserve Board and the Office of the Comptroller of the Currency, respectively. The projections do not represent forecasts of expected losses, revenue, net income, risk-weighted assets, capital or capital ratios, but rather reflect possible results under the prescribed hypothetical scenario. For the reasons described above, we caution you against relying on any forward-looking statements, which should also be read in conjunction with the other cautionary statements that are included elsewhere in this presentation and in Synchrony Financial’s public filings, including under the heading “Risk Factors” in the Synchrony Financial’s Annual Report on Form 10-K for the fiscal year ended December 31, 2017, as filed on February 22, 2018. You should not consider any list of such factors to be an exhaustive statement of all of the risks, uncertainties, or potentially inaccurate assumptions that could cause our current expectations or beliefs to change. Further, any forward-looking statement speaks only as of the date on which it is made, and we undertake no obligation to update or revise any forward-looking statement to reflect events or circumstances after the date on which the statement is made or to reflect the occurrence of unanticipated events, except as otherwise may be required by law. 2
Overview • The 2018 Annual Stress Test Disclosure presents the results of the annual stress tests conducted by Synchrony Financial (“Synchrony”) and Synchrony Bank (the “Bank”), a wholly-owned subsidiary of Synchrony, in accordance with the Dodd-Frank Act Company-Run Stress Test requirements. • The stress tests reflect the potential impact of hypothetical macroeconomic scenarios on certain financial measures of Synchrony and the Bank over a nine-quarter planning horizon from 1Q 2018 through 1Q 2020. Synchrony is required to publicly disclose a summary of the results for the Supervisory Severely Adverse scenario for both Synchrony and the Bank. • The results represent hypothetical estimates consistent with the requirements prescribed by the Board of Governors of the Federal Reserve System (the “FRB”) and the Office of the Comptroller of the Currency (the “OCC”) and do not represent Synchrony’s and the Bank’s forecast of expected losses, revenue, net income, risk-weighted assets, capital, or capital ratios. • The results presented are based on capital action assumptions that would be consistent with the Supervisory Severely Adverse scenario and required methodologies and internal practices: Synchrony Financial: • Actual dividend payments and share repurchases executed in 1Q18. • Dividend payments in 2Q18 through 1Q20 equal the quarterly average dollar amount of the prior four quarters (2Q17 – 1Q18) of dividends. • No additional share repurchases and no additional capital issuances or redemptions are contemplated except for issuances related to employee compensation. • These capital actions are consistent with the general DFAST assumptions and may not represent Synchrony’s internal capital needs and projections. Synchrony Bank: • Dividend payments from the Bank to Synchrony Financial are limited to no more than the prior quarter’s earnings. As a federal savings association, the Bank is not required to include an average of the prior four quarters of dividends. • No additional capital issuances or redemptions are contemplated. 3
Supervisory Severely Adverse Scenario Description • The Supervisory Severely Adverse scenario is not a forecast, but rather a hypothetical sequence of events designed to assess the strength of banking organizations and their resilience to a severely adverse economic environment. • The Supervisory Severely Adverse scenario features the following macroeconomic assumptions: • A severe global recession that is accompanied by a global aversion to long-term fixed-income assets. As a result, long-term rates do not fall and yield curves steepen in the U.S.; • A broad-based and deep correction in asset prices occur including the corporate bond and real estate markets; • The unemployment rate increases almost 6 percentage points, to 10%, by the third quarter of 2019. Consumer price inflation falls below 1% at an annual rate in the second quarter of 2018 and rises to 1.8% at an annual rate by the end of the scenario; and • As a result of the severe decline in real activity, short-term Treasury rates fall and remain near 0% through the end of the scenario period. However, investor aversion to long-term fixed- income assets keeps 10-year Treasury yields unchanged through the scenario period. 4
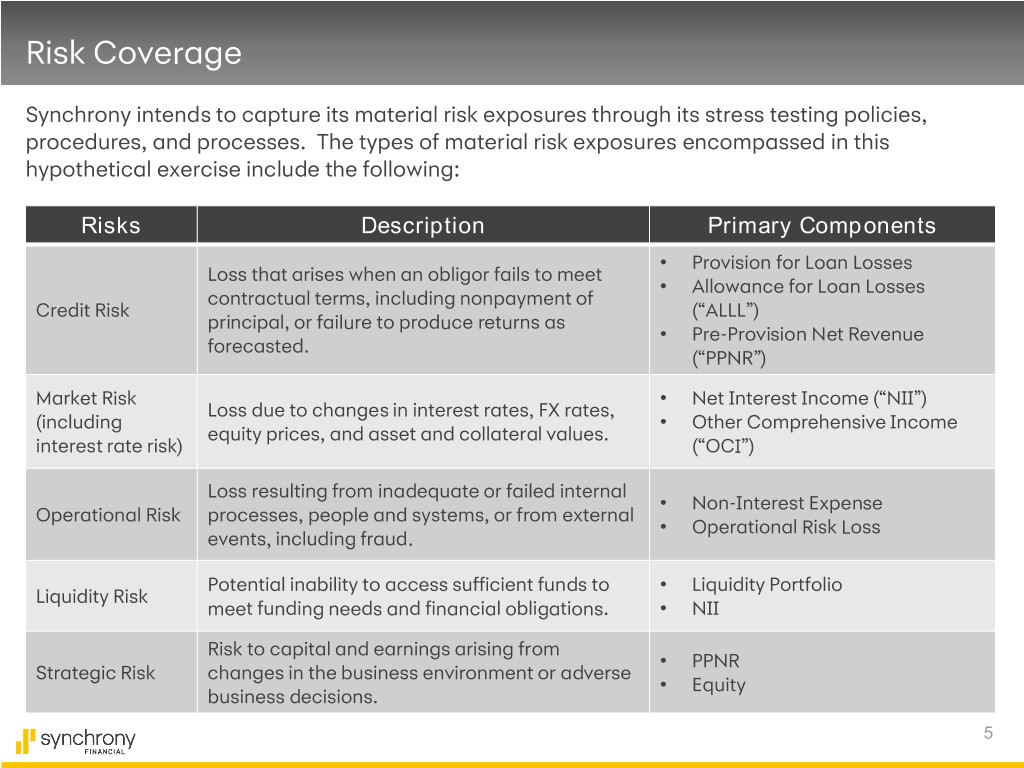
Risk Coverage Synchrony intends to capture its material risk exposures through its stress testing policies, procedures, and processes. The types of material risk exposures encompassed in this hypothetical exercise include the following: Risks Description Primary Components • Provision for Loan Losses Loss that arises when an obligor fails to meet • Allowance for Loan Losses contractual terms, including nonpayment of Credit Risk (“ALLL”) principal, or failure to produce returns as • Pre-Provision Net Revenue forecasted. (“PPNR”) Market Risk • Net Interest Income (“NII”) Loss due to changes in interest rates, FX rates, (including • Other Comprehensive Income equity prices, and asset and collateral values. interest rate risk) (“OCI”) Loss resulting from inadequate or failed internal • Non-Interest Expense Operational Risk processes, people and systems, or from external • Operational Risk Loss events, including fraud. Potential inability to access sufficient funds to • Liquidity Portfolio Liquidity Risk meet funding needs and financial obligations. • NII Risk to capital and earnings arising from • PPNR Strategic Risk changes in the business environment or adverse • Equity business decisions. 5
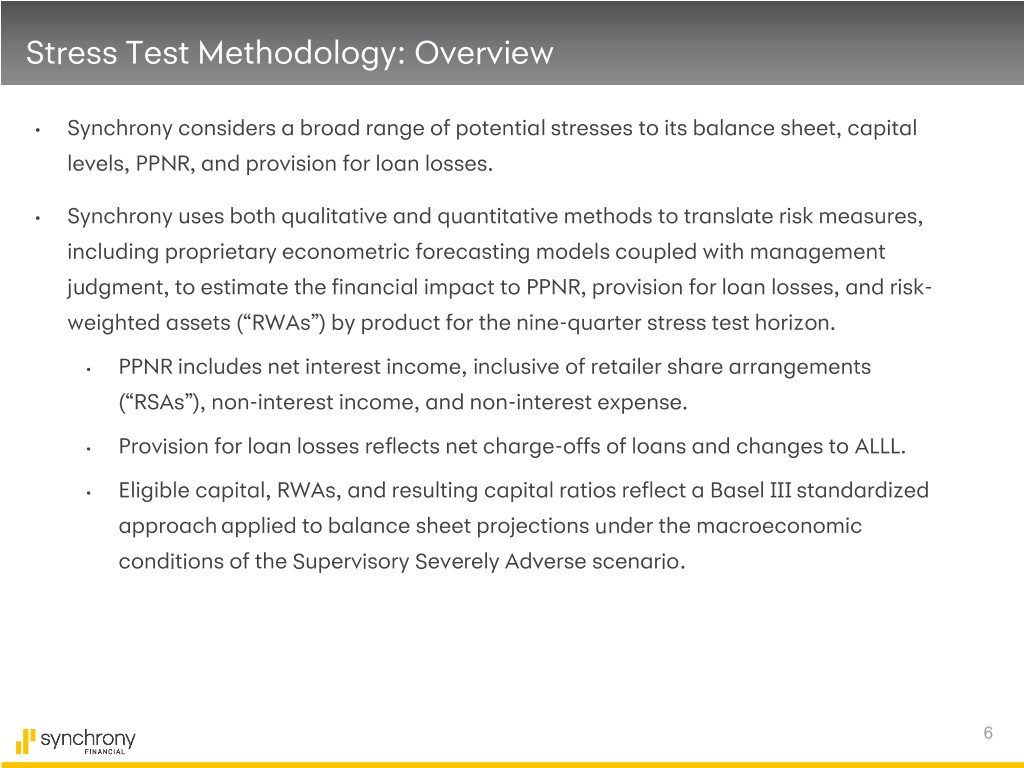
Stress Test Methodology: Overview • Synchrony considers a broad range of potential stresses to its balance sheet, capital levels, PPNR, and provision for loan losses. • Synchrony uses both qualitative and quantitative methods to translate risk measures, including proprietary econometric forecasting models coupled with management judgment, to estimate the financial impact to PPNR, provision for loan losses, and risk- weighted assets (“RWAs”) by product for the nine-quarter stress test horizon. • PPNR includes net interest income, inclusive of retailer share arrangements (“RSAs”), non-interest income, and non-interest expense. • Provision for loan losses reflects net charge-offs of loans and changes to ALLL. • Eligible capital, RWAs, and resulting capital ratios reflect a Basel III standardized approach applied to balance sheet projections under the macroeconomic conditions of the Supervisory Severely Adverse scenario. 6
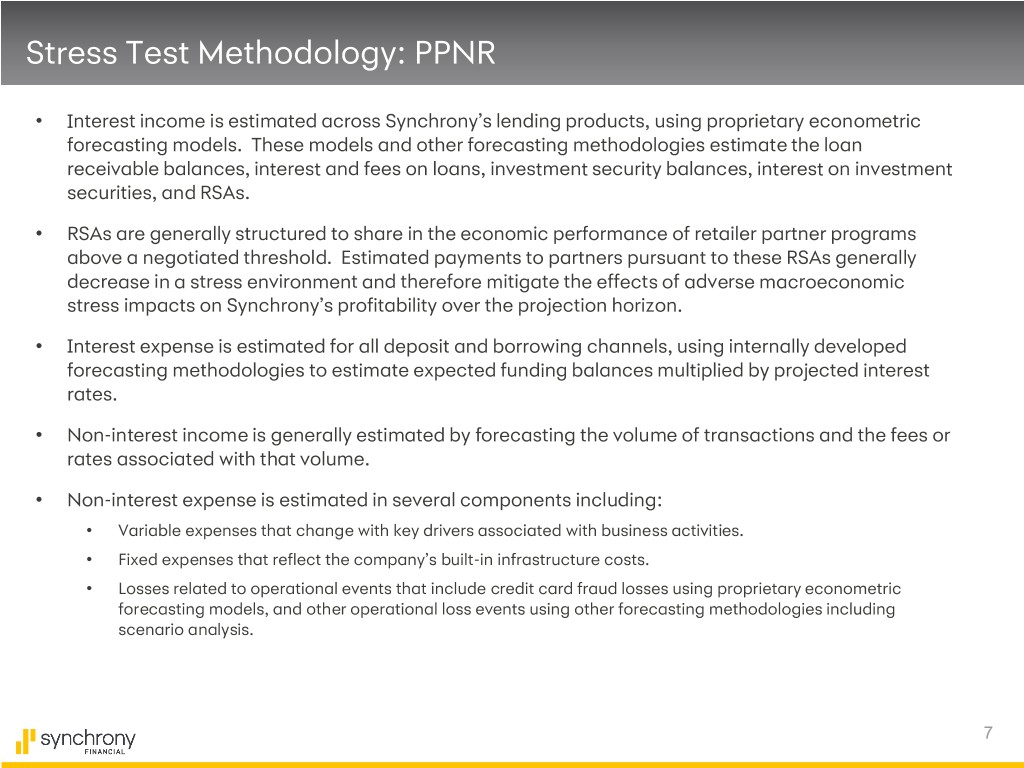
Stress Test Methodology: PPNR • Interest income is estimated across Synchrony’s lending products, using proprietary econometric forecasting models. These models and other forecasting methodologies estimate the loan receivable balances, interest and fees on loans, investment security balances, interest on investment securities, and RSAs. • RSAs are generally structured to share in the economic performance of retailer partner programs above a negotiated threshold. Estimated payments to partners pursuant to these RSAs generally decrease in a stress environment and therefore mitigate the effects of adverse macroeconomic stress impacts on Synchrony’s profitability over the projection horizon. • Interest expense is estimated for all deposit and borrowing channels, using internally developed forecasting methodologies to estimate expected funding balances multiplied by projected interest rates. • Non-interest income is generally estimated by forecasting the volume of transactions and the fees or rates associated with that volume. • Non-interest expense is estimated in several components including: • Variable expenses that change with key drivers associated with business activities. • Fixed expenses that reflect the company’s built-in infrastructure costs. • Losses related to operational events that include credit card fraud losses using proprietary econometric forecasting models, and other operational loss events using other forecasting methodologies including scenario analysis. 7
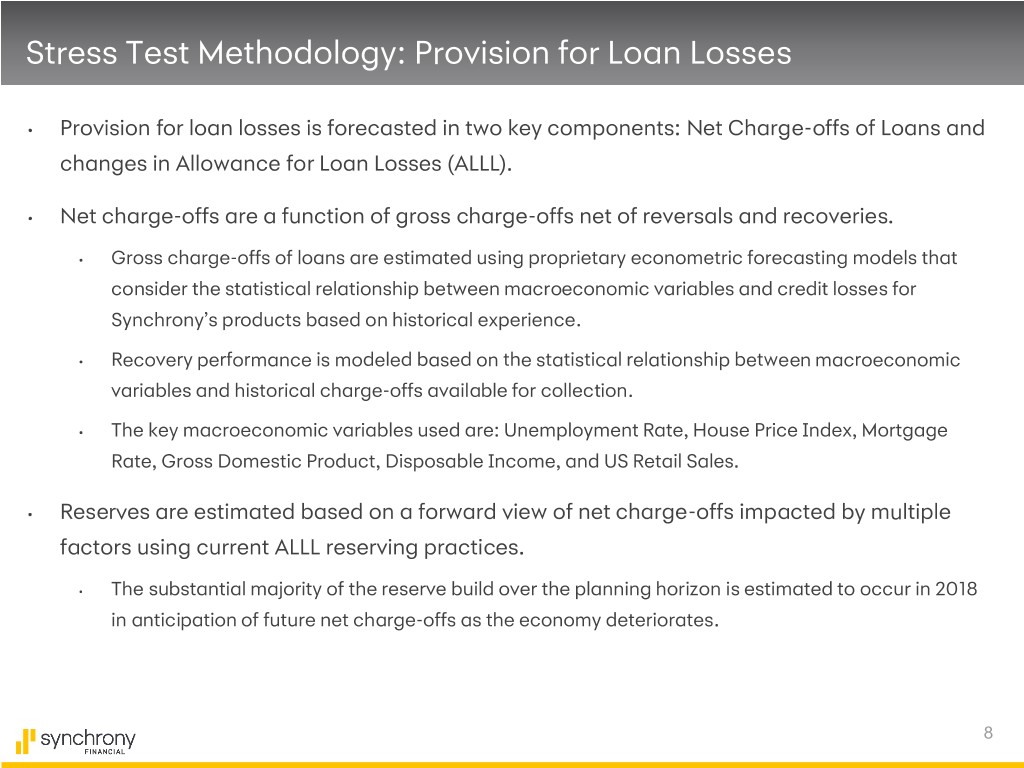
Stress Test Methodology: Provision for Loan Losses • Provision for loan losses is forecasted in two key components: Net Charge-offs of Loans and changes in Allowance for Loan Losses (ALLL). • Net charge-offs are a function of gross charge-offs net of reversals and recoveries. • Gross charge-offs of loans are estimated using proprietary econometric forecasting models that consider the statistical relationship between macroeconomic variables and credit losses for Synchrony’s products based on historical experience. • Recovery performance is modeled based on the statistical relationship between macroeconomic variables and historical charge-offs available for collection. • The key macroeconomic variables used are: Unemployment Rate, House Price Index, Mortgage Rate, Gross Domestic Product, Disposable Income, and US Retail Sales. • Reserves are estimated based on a forward view of net charge-offs impacted by multiple factors using current ALLL reserving practices. • The substantial majority of the reserve build over the planning horizon is estimated to occur in 2018 in anticipation of future net charge-offs as the economy deteriorates. 8
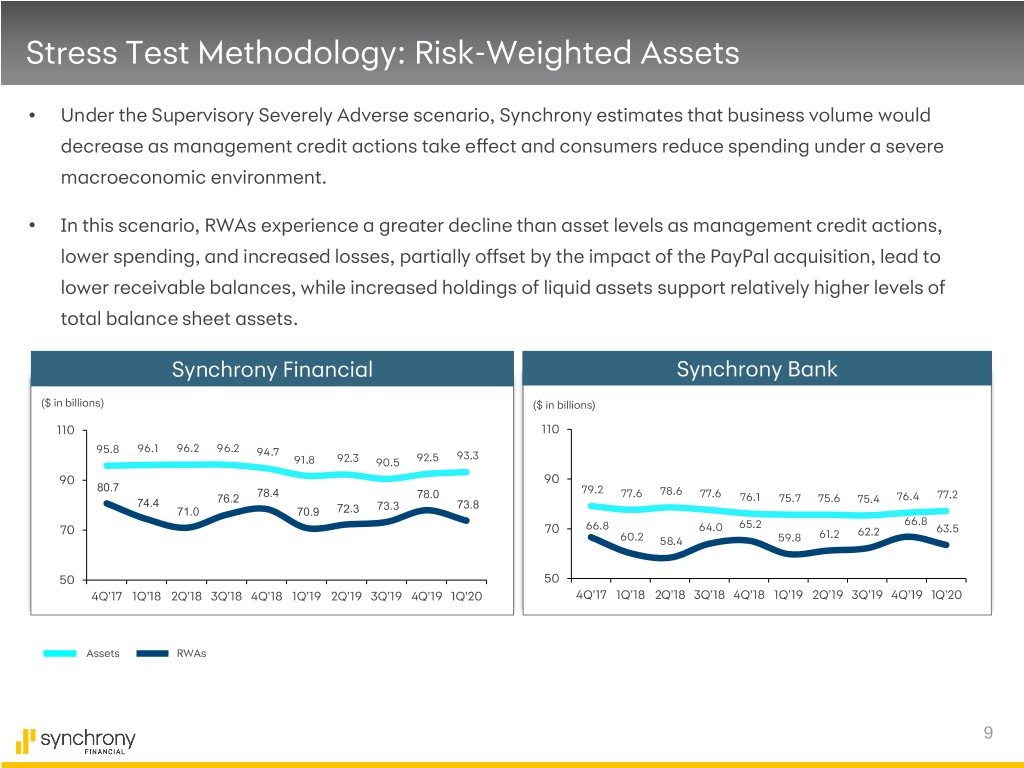
Stress Test Methodology: Risk-Weighted Assets • Under the Supervisory Severely Adverse scenario, Synchrony estimates that business volume would decrease as management credit actions take effect and consumers reduce spending under a severe macroeconomic environment. • In this scenario, RWAs experience a greater decline than asset levels as management credit actions, lower spending, and increased losses, partially offset by the impact of the PayPal acquisition, lead to lower receivable balances, while increased holdings of liquid assets support relatively higher levels of total balance sheet assets. Synchrony Financial Synchrony Bank ($ in billions) ($ in billions) 110 110 95.8 96.1 96.2 96.2 94.7 93.3 91.8 92.3 90.5 92.5 90 90 80.7 78.4 79.2 78.6 76.2 78.0 77.6 77.6 76.1 75.7 75.6 75.4 76.4 77.2 74.4 73.3 73.8 71.0 70.9 72.3 66.8 66.8 64.0 65.2 70 70 61.2 62.2 63.5 60.2 58.4 59.8 50 50 4Q'17 1Q'18 2Q'18 3Q'18 4Q'18 1Q'19 2Q'19 3Q'19 4Q'19 1Q'20 4Q'17 1Q'18 2Q'18 3Q'18 4Q'18 1Q'19 2Q'19 3Q'19 4Q'19 1Q'20 Assets RWAs 9
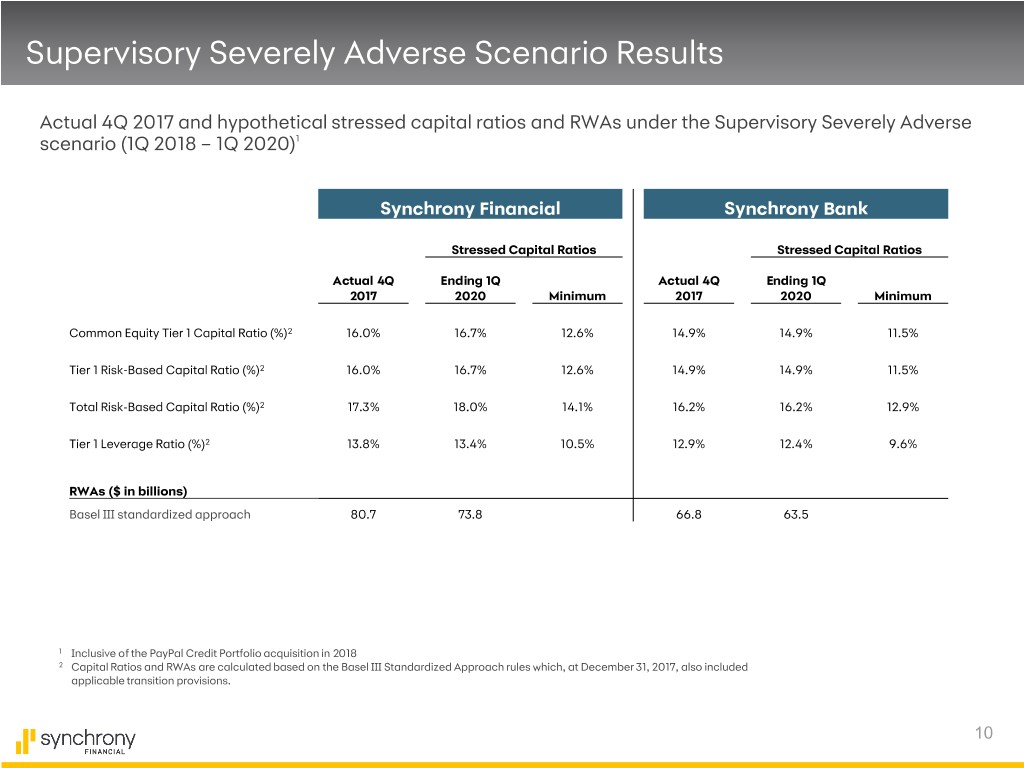
Supervisory Severely Adverse Scenario Results Actual 4Q 2017 and hypothetical stressed capital ratios and RWAs under the Supervisory Severely Adverse scenario (1Q 2018 – 1Q 2020)1 Synchrony Financial Synchrony Bank Stressed Capital Ratios Stressed Capital Ratios Actual 4Q Ending 1Q Actual 4Q Ending 1Q 2017 2020 Minimum 2017 2020 Minimum Common Equity Tier 1 Capital Ratio (%)2 16.0% 16.7% 12.6% 14.9% 14.9% 11.5% Tier 1 Risk-Based Capital Ratio (%)2 16.0% 16.7% 12.6% 14.9% 14.9% 11.5% Total Risk-Based Capital Ratio (%)2 17.3% 18.0% 14.1% 16.2% 16.2% 12.9% Tier 1 Leverage Ratio (%)2 13.8% 13.4% 10.5% 12.9% 12.4% 9.6% RWAs ($ in billions) Basel III standardized approach 80.7 73.8 66.8 63.5 1 Inclusive of the PayPal Credit Portfolio acquisition in 2018 2 Capital Ratios and RWAs are calculated based on the Basel III Standardized Approach rules which, at December 31, 2017, also included applicable transition provisions. 10
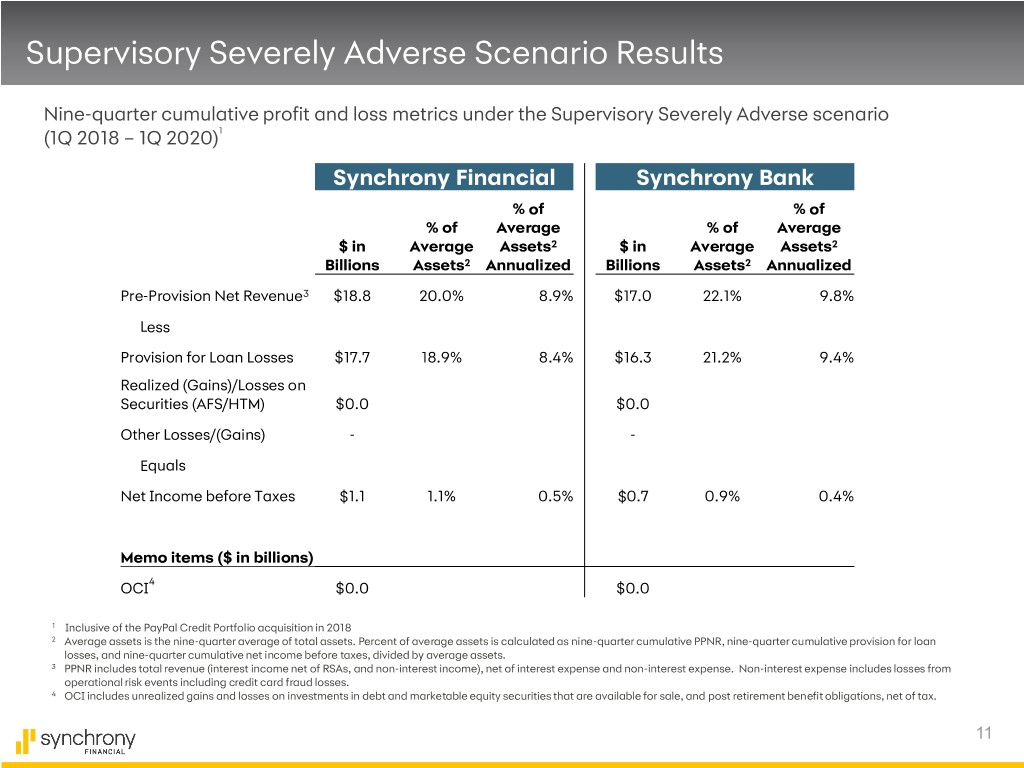
Supervisory Severely Adverse Scenario Results Nine-quarter cumulative profit and loss metrics under the Supervisory Severely Adverse scenario (1Q 2018 – 1Q 2020)1 Synchrony Financial Synchrony Bank % of % of % of Average % of Average $ in Average Assets2 $ in Average Assets2 Billions Assets2 Annualized Billions Assets2 Annualized Pre-Provision Net Revenue3 $18.8 20.0% 8.9% $17.0 22.1% 9.8% Less Provision for Loan Losses $17.7 18.9% 8.4% $16.3 21.2% 9.4% Realized (Gains)/Losses on Securities (AFS/HTM) $0.0 $0.0 Other Losses/(Gains) - - Equals Net Income before Taxes $1.1 1.1% 0.5% $0.7 0.9% 0.4% Memo items ($ in billions) OCI4 $0.0 $0.0 1 Inclusive of the PayPal Credit Portfolio acquisition in 2018 2 Average assets is the nine-quarter average of total assets. Percent of average assets is calculated as nine-quarter cumulative PPNR, nine-quarter cumulative provision for loan losses, and nine-quarter cumulative net income before taxes, divided by average assets. 3 PPNR includes total revenue (interest income net of RSAs, and non-interest income), net of interest expense and non-interest expense. Non-interest expense includes losses from operational risk events including credit card fraud losses. 4 OCI includes unrealized gains and losses on investments in debt and marketable equity securities that are available for sale, and post retirement benefit obligations, net of tax. 11
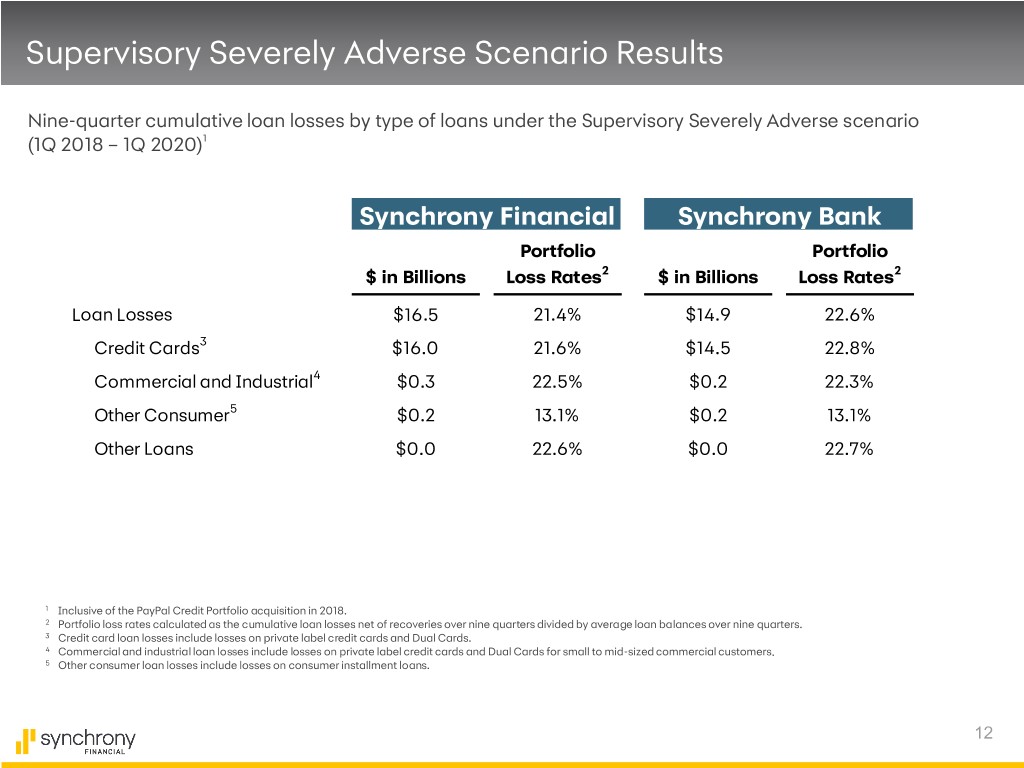
Supervisory Severely Adverse Scenario Results Nine-quarter cumulative loan losses by type of loans under the Supervisory Severely Adverse scenario (1Q 2018 – 1Q 2020)1 Synchrony Financial Synchrony Bank Portfolio Portfolio $ in Billions Loss Rates2 $ in Billions Loss Rates2 Loan Losses $16.5 21.4% $14.9 22.6% Credit Cards3 $16.0 21.6% $14.5 22.8% Commercial and Industrial4 $0.3 22.5% $0.2 22.3% Other Consumer5 $0.2 13.1% $0.2 13.1% Other Loans $0.0 22.6% $0.0 22.7% 1 Inclusive of the PayPal Credit Portfolio acquisition in 2018. 2 Portfolio loss rates calculated as the cumulative loan losses net of recoveries over nine quarters divided by average loan balances over nine quarters. 3 Credit card loan losses include losses on private label credit cards and Dual Cards. 4 Commercial and industrial loan losses include losses on private label credit cards and Dual Cards for small to mid-sized commercial customers. 5 Other consumer loan losses include losses on consumer installment loans. 12
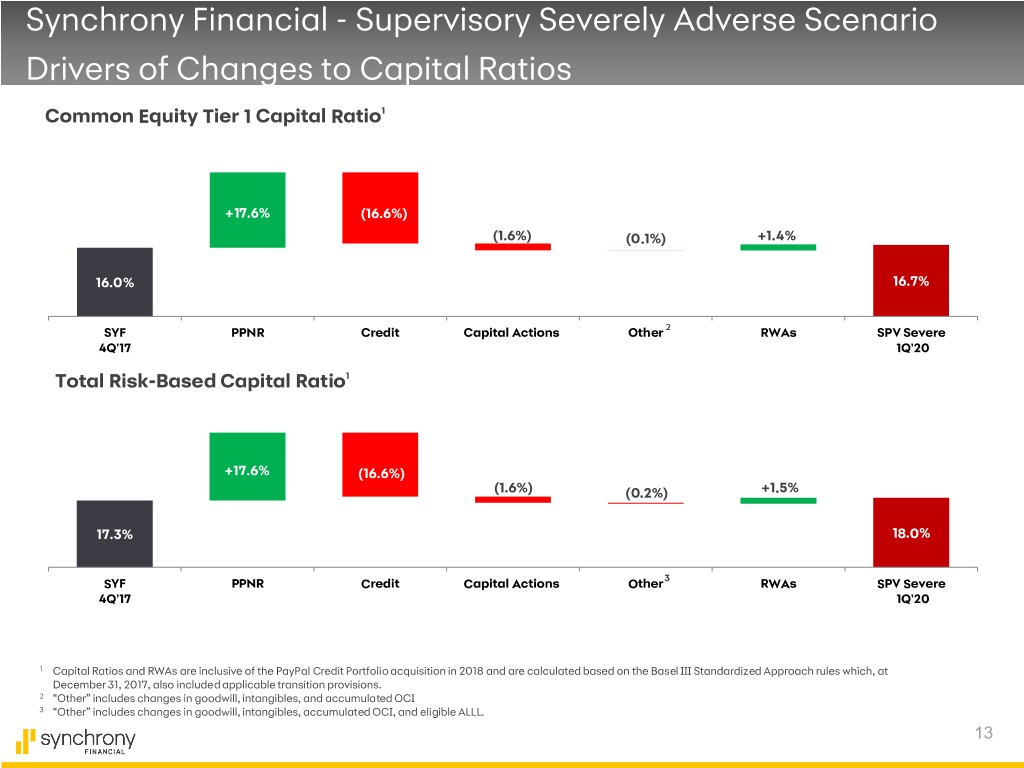
Synchrony Financial - Supervisory Severely Adverse Scenario Drivers of Changes to Capital Ratios Common Equity Tier 1 Capital Ratio1 +17.6% (16.6%) (1.6%) (0.1%) +1.4% 16.0% 16.7% SYF PPNR Credit Capital Actions Other RWAs SPV Severe 4Q'17 1Q'20 Total Risk-Based Capital Ratio1 +17.6% (16.6%) (1.6%) (0.2%) +1.5% 17.3% 18.0% SYF PPNR Credit Capital Actions Other3 RWAs SPV Severe 4Q'17 1Q'20 1 Capital Ratios and RWAs are inclusive of the PayPal Credit Portfolio acquisition in 2018 and are calculated based on the Basel III Standardized Approach rules which, at December 31, 2017, also included applicable transition provisions. 2 “Other” includes changes in goodwill, intangibles, and accumulated OCI 3 “Other” includes changes in goodwill, intangibles, accumulated OCI, and eligible ALLL. 13
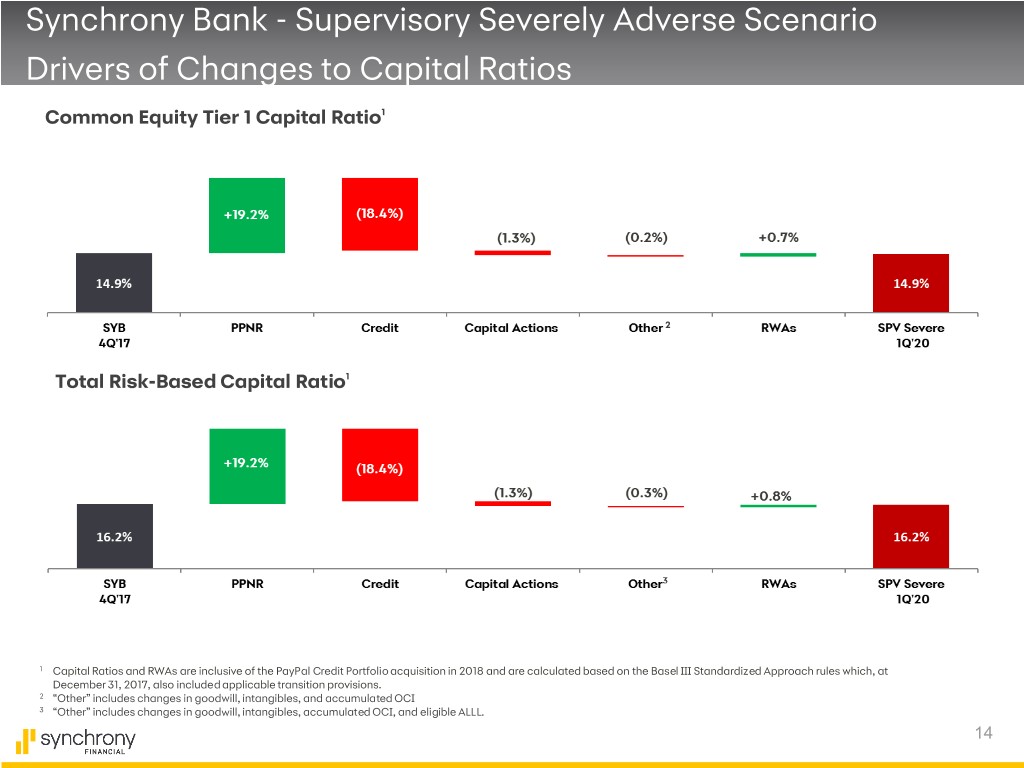
Synchrony Bank - Supervisory Severely Adverse Scenario Drivers of Changes to Capital Ratios Common Equity Tier 1 Capital Ratio1 2 Total Risk-Based Capital Ratio1 1 Capital Ratios and RWAs are inclusive of the PayPal Credit Portfolio acquisition in 2018 and are calculated based on the Basel III Standardized Approach rules which, at December 31, 2017, also included applicable transition provisions. 2 “Other” includes changes in goodwill, intangibles, and accumulated OCI 3 “Other” includes changes in goodwill, intangibles, accumulated OCI, and eligible ALLL. 14

Engage with us.