UNITED STATES
SECURITIES AND EXCHANGE COMMISSION
Washington, D.C. 20549
FORM 10-Q
(Mark One)
|
| |
x | QUARTERLY REPORT PURSUANT TO SECTION 13 OR 15(d) OF THE SECURITIES EXCHANGE ACT OF 1934 |
For the quarterly period ended June 30, 2015
OR
|
| |
o | TRANSITION REPORT PURSUANT TO SECTION 13 OR 15(d) OF THE SECURITIES EXCHANGE ACT OF 1934 |
For the transition period from to
001-36560
(Commission File Number)
SYNCHRONY FINANCIAL
(Exact name of registrant as specified in its charter)
|
| | |
Delaware | | 51-0483352 |
(State or other jurisdiction of incorporation or organization) | | (I.R.S. Employer Identification No.) |
|
| | |
777 Long Ridge Road | | |
Stamford, Connecticut | | 06902 |
(Address of principal executive offices) | | (Zip Code) |
(Registrant’s telephone number, including area code) (203) 585-2400
Indicate by check mark whether the registrant (1) has filed all reports required to be filed by Section 13 or 15(d) of the Securities Exchange Act of 1934 during the preceding 12 months (or for such shorter period that the registrant was required to file such reports), and (2) has been subject to such filing requirements for the past 90 days. Yes ý No ¨
Indicate by check mark whether the registrant has submitted electronically and posted on its corporate Web site, if any, every Interactive Data File required to be submitted and posted pursuant to Rule 405 of Regulation S-T (§232.405 of this chapter) during the preceding 12 months (or for such shorter period that the registrant was required to submit and post such files). Yes ý No ¨
Indicate by check mark whether the registrant is a large accelerated filer, an accelerated filer, a non-accelerated filer, or a smaller reporting company. See the definitions of “large accelerated filer,” “accelerated filer” and “smaller reporting company” in Rule 12b-2 of the Exchange Act. (Check one):
|
| | | |
Large accelerated filer | o | Accelerated filer | o |
| | | |
Non-accelerated filer | ý (Do not check if a smaller reporting company) | Smaller reporting company | o |
Indicate by check mark whether the registrant is a shell company (as defined in Rule 12b-2 of the Exchange Act). Yes ¨ No ý
The number of shares of the registrant’s common stock, par value $0.001 per share, outstanding as of July 29, 2015 was 833,764,963.
Synchrony Financial
|
| |
PART I - FINANCIAL INFORMATION | Page |
| |
| |
Item 1. Financial Statements: | |
| |
| |
| |
| |
| |
| |
| |
| |
| |
| |
| |
| |
| |
| |
| |
| |
| |
PART II - OTHER INFORMATION | |
| |
| |
| |
| |
| |
| |
| |
| |
| |
Cautionary Note Regarding Forward-Looking Statements:
Various statements in this Quarterly Report on Form 10-Q may contain “forward-looking statements” as defined in Section 27A of the Securities Act of 1933, as amended, and Section 21E of the Securities Exchange Act of 1934, as amended (the “Exchange Act”), which are subject to the “safe harbor” created by those sections. Forward-looking statements may be identified by words such as “expects,” “intends,” “anticipates,” “plans,” “believes,” “seeks,” “targets,” “outlook,” “estimates,” “will,” “should,” “may” or words of similar meaning, but these words are not the exclusive means of identifying forward-looking statements.
Forward-looking statements are based on management’s current expectations and assumptions, and are subject to inherent uncertainties, risks and changes in circumstances that are difficult to predict. As a result, actual results could differ materially from those indicated in these forward-looking statements. Factors that could cause actual results to differ materially include global political, economic, business, competitive, market, regulatory and other factors and risks, such as: the impact of macroeconomic conditions and whether industry trends we have identified develop as anticipated; retaining existing partners and attracting new partners, concentration of our platform revenue in a small number of Retail Card partners, promotion and support of our products by our partners, and financial performance of our partners; our need for additional financing, higher borrowing costs and adverse financial market conditions impacting our funding and liquidity, and any reduction in our credit ratings; our ability to securitize our loans, occurrence of an early amortization of our securitization facilities, loss of the right to service or subservice our securitized loans, and lower payment rates on our securitized loans; our reliance on dividends, distributions and other payments from Synchrony Bank (the “Bank”); our ability to grow our deposits in the future; changes in market interest rates and the impact of any margin compression; effectiveness of our risk management processes and procedures, reliance on models which may be inaccurate or misinterpreted, our ability to manage our credit risk, the sufficiency of our allowance for loan losses and the accuracy of the assumptions or estimates used in preparing our financial statements; our ability to offset increases in our costs in retailer share arrangements; competition in the consumer finance industry; our concentration in the U.S. consumer credit market; our ability to successfully develop and commercialize new or enhanced products and services; our ability to realize the value of strategic investments; reductions in interchange fees; fraudulent activity; cyber-attacks or other security breaches; failure of third parties to provide various services that are important to our operations; disruptions in the operations of our computer systems and data centers; international risks and compliance and regulatory risks and costs associated with international operations; alleged infringement of intellectual property rights of others and our ability to protect our intellectual property; litigation and regulatory actions; damage to our reputation; our ability to attract, retain and motivate key officers and employees; tax legislation initiatives or challenges to our tax positions and state sales tax rules and regulations; significant regulation, supervision, examination and enforcement of our business by governmental authorities, the impact of the Dodd-Frank Wall Street Reform and Consumer Protection Act (the “Dodd-Frank Act”) and the impact of the Consumer Financial Protection Bureau's (the “CFPB”) regulation of our business; changes to our methods of offering our CareCredit products; impact of capital adequacy rules; restrictions that limit the Bank’s ability to pay dividends; regulations relating to privacy, information security and data protection; use of third-party vendors and ongoing third-party business relationships; failure to comply with anti-money laundering and anti-terrorism financing laws; effect of GECC being subject to regulation by the Federal Reserve Board both as a savings and loan holding company and as a systemically important financial institution; GE not completing the separation from us as planned or at all, GE’s inability to obtain savings and loan holding company deregistration (the “GE SLHC Deregistration”) and GE continuing to have significant control over us; completion by the Federal Reserve Board of a review (with satisfactory results) of our preparedness to operate on a standalone basis, independently of GE, and Federal Reserve Board approval required for us to continue to be a savings and loan holding company, including the timing of the approval and the imposition of any significant additional capital or liquidity requirements; our need to establish and significantly expand many aspects of our operations and infrastructure; delays in receiving or failure to receive Federal Reserve Board agreement required for us to be treated as a financial holding company after the GE SLHC Deregistration; loss of association with GE’s strong brand and reputation; limited right to use the GE brand name and logo and need to establish a new brand; GE has significant control over us; terms of our arrangements with GE may be more favorable than what we will be able to obtain from unaffiliated third parties; obligations associated with being a public company; our incremental cost of operating as a standalone public company could be substantially more than anticipated; GE could engage in businesses that compete with us, and conflicts of interest may arise between us and GE; and failure caused by us of GE’s distribution of our common stock to its stockholders in exchange for its common stock to qualify for tax-free treatment, which may result in significant tax liabilities to GE for which we may be required to indemnify GE.
For the reasons described above, we caution you against relying on any forward-looking statements, which should also be read in conjunction with the other cautionary statements that are included elsewhere in this report and in our public filings, including under the heading “Risk Factors” in our Annual Report on Form 10-K for the year ended December 31, 2014 (our “2014 Form 10-K”). You should not consider any list of such factors to be an exhaustive statement of all of the risks, uncertainties, or potentially inaccurate assumptions that could cause our current expectations or beliefs to change. Further, any forward-looking statement speaks only as of the date on which it is made, and we undertake no obligation to update or revise any forward-looking statement to reflect events or circumstances after the date on which the statement is made or to reflect the occurrence of unanticipated events, except as otherwise may be required by the federal securities laws.
PART I. FINANCIAL INFORMATION
ITEM 2. MANAGEMENT’S DISCUSSION AND ANALYSIS OF FINANCIAL CONDITION AND RESULTS OF OPERATIONS
The following discussion and analysis of our financial condition and results of operations should be read in conjunction with our condensed consolidated and combined financial statements and related notes included elsewhere in this quarterly report and in our 2014 Form 10-K. The discussion below contains forward-looking statements that are based upon current expectations and are subject to uncertainty and changes in circumstances. Actual results may differ materially from these expectations. See “Cautionary Note Regarding Forward-Looking Statements.” References in this Form 10-Q to the “Company”, “we”, “us” and “our” are to Synchrony Financial and its combined and consolidated subsidiaries unless the context otherwise requires; references to “GE” are to General Electric Company and its subsidiaries; references to “GECC” are to General Electric Capital Corporation (a subsidiary of GE) and its subsidiaries; and references to the “Bank” are to our wholly-owned subsidiary, Synchrony Bank.
Introduction and Business Overview
____________________________________________________________________________________________
We are one of the premier consumer financial services companies in the United States. We provide a range of credit products through programs we have established with a diverse group of national and regional retailers, local merchants, manufacturers, buying groups, industry associations and healthcare service providers, which we refer to as our “partners.” For the three and six months ended June 30, 2015, we financed $28.8 billion and $51.9 billion of purchase volume and had 60.9 million and 61.5 million average active accounts, respectively, and at June 30, 2015, we had $61.4 billion of loan receivables. For the three and six months ended June 30, 2015, we had net earnings of $541 million and $1,093 million, respectively, representing a return on assets of 2.9% and 3.0%, respectively.
We offer our credit products primarily through our wholly-owned subsidiary, Synchrony Bank. Through the Bank, we offer a range of deposit products insured by the Federal Deposit Insurance Corporation (“FDIC”). We are continuing to expand our direct banking operations to increase our deposit base as a source of stable and diversified low cost funding for our credit activities. We had $37.8 billion in deposits at June 30, 2015.
In 2014, we closed the initial public offering (the "IPO") of 128.5 million shares of our common stock. Following the IPO, GE owned, and currently owns, approximately 84.6% of our common stock.
Our Sales Platforms
_________________________________________________________________
We conduct our operations through a single business segment. Profitability and expenses, including funding costs, loan losses and operating expenses, are managed for the business as a whole. Substantially all of our operations are within the United States. We offer our products through three sales platforms (Retail Card, Payment Solutions and CareCredit). Those platforms are organized by the types of products we offer and the partners we work with, and are measured on platform revenues, loan receivables, new accounts and other sales metrics.
 ______________________
 | |
(1) | For a definition of platform revenue, which is a non-GAAP measure, and its reconciliation to interest and fees on loans, see “Results of Operations—Platform Analysis—Non-GAAP Measure”. |
Retail Card
Retail Card is a leading provider of private label credit cards, and also provides Dual Cards and small and medium-sized business credit products. Our patented Dual Cards are credit cards that function as private label credit cards when used to purchase goods and services from our partners and as general purpose credit cards when used elsewhere. We offer one or more of these products primarily through 20 national and regional retailers with which we have ongoing program agreements. The average length of our relationship with these Retail Card partners is 16 years. Retail Card’s platform revenue consists of interest and fees on our loan receivables, plus other income, less retailer share arrangements. Other income primarily consists of interchange fees earned on Dual Card transactions (when the card is used outside of our partners' sales channels) and fees paid to us by customers who purchase our debt cancellation products, less loyalty program payments. Substantially all of the credit extended in this platform is on standard terms.
Payment Solutions
Payment Solutions is a leading provider of promotional financing for major consumer purchases, offering primarily private label credit cards and installment loans. Payment Solutions offers these products through participating partners consisting of national and regional retailers, local merchants, manufacturers, buying groups and industry associations. Substantially all of the credit extended in this platform is promotional financing. Payment Solutions’ platform revenue primarily consists of interest and fees on our loan receivables, including “merchant discounts,” which are fees paid to us by our partners in almost all cases to compensate us for all or part of foregone interest revenue associated with promotional financing.
CareCredit
CareCredit is a leading provider of promotional financing to consumers for elective healthcare procedures or services, such as dental, veterinary, cosmetic, vision and audiology. CareCredit offers financing through a CareCredit branded private label credit card that may be used across a network of providers in which the vast majority are individual or small groups of independent healthcare providers. Substantially all of the credit extended in this platform is promotional financing. CareCredit’s platform revenue primarily consists of interest and fees on our loan receivables, including merchant discounts.
Our Credit Products
____________________________________________________________________________________________
Through our platforms, we offer three principal types of credit products: credit cards, commercial credit products and consumer installment loans.
The following table sets forth each credit product by type and indicates the percentage of our total loan receivables that are under standard terms only or pursuant to a promotional financing offer at June 30, 2015.
|
| | | | | | | | |
Credit Product | Standard Terms | | Promotional Offer | | Total |
Credit cards | 67.8 | % | | 28.0 | % | | 95.8 | % |
Commercial credit products | 2.3 |
| | — |
| | 2.3 |
|
Consumer installment loans | — |
| | 1.9 |
| | 1.9 |
|
Total | 70.1 | % | | 29.9 | % | | 100.0 | % |
Credit Cards
We offer two principal types of credit cards: private label credit cards and Dual Cards:
| |
• | Private label credit cards. Private label credit cards are partner-branded credit cards (e.g., Lowe’s or Amazon) or program-branded credit cards (e.g., CarCareONE or CareCredit) that are used primarily for the purchase of goods and services from the partner or within the program network. In Retail Card, credit under our private label credit cards typically is extended on standard terms only, and in Payment Solutions and CareCredit, credit under our private label credit cards typically is extended pursuant to a promotional financing offer. |
| |
• | Dual Cards. Our patented Dual Cards are credit cards that function as private label credit cards when used to purchase goods and services from our partners and as general purpose credit cards when used elsewhere. Credit extended under our Dual Cards typically is extended under standard terms only. Currently, only Retail Card offers Dual Cards. At June 30, 2015, we offered Dual Cards through 14 of our 20 ongoing Retail Card programs. |
Commercial Credit Products
We offer private label cards and co-branded cards for commercial customers that are similar to our consumer offerings. We also offer a commercial pay-in-full accounts receivable product to a wide range of business customers. We offer commercial credit products primarily through our Retail Card platform to the commercial customers of our Retail Card partners.
Installment Loans
In Payment Solutions, we originate installment loans to consumers (and a limited number of commercial customers) in the United States, primarily in the power product market (motorcycles, ATVs and lawn and garden). Installment loans are closed-end credit accounts where the customer pays down the outstanding balance in installments. Installment loans are assessed periodic finance charges using fixed interest rates.
Business Trends and Conditions
____________________________________________________________________________________________
We believe our business and results of operations will be impacted in the future by various trends and conditions, including the following:
| |
• | Growth in loan receivables and interest income |
| |
• | Changing funding mix and increased funding costs, including: |
| |
◦ | continued growth in our direct deposits as a source of stable and low cost funding |
| |
◦ | the changing mix in our funding sources, as our historical related party debt was replaced during 2014 by higher cost funding primarily provided by third-party debt |
| |
◦ | a rising interest rate environment |
| |
• | Extended duration of program agreements |
| |
• | Increases in retailer share arrangement payments and other expense under extended program agreements |
| |
• | Stable asset quality and enhancements to allowance for loan loss methodology |
| |
• | Increases in other expense to operate as a fully independent company |
| |
• | Impact of regulatory developments |
| |
• | Increased capital and liquidity levels |
For a discussion of these trends and conditions, see “Management's Discussion and Analysis of Financial Condition and Results of Operations—Business Trends and Conditions” in our 2014 Form 10-K. For a discussion of how these trends and conditions impacted the three and six months ended June 30, 2015, see “Results of Operations.”
Seasonality
____________________________________________________________________________________________
In our Retail Card and Payment Solutions platforms, we experience fluctuations in transaction volumes and the level of loan receivables as a result of higher seasonal consumer spending and payment patterns that typically result in an increase of loan receivables from August through a peak in late December, with reductions in loan receivables occurring over the first and second quarters of the following year as customers pay down their balances.
The seasonal impact to transaction volumes and the loan receivables balance typically results in fluctuations in our results of operations, delinquency metrics and the allowance for loan losses as a percentage of total loan receivables between quarterly periods.
In addition to the seasonal variance in loan receivables discussed above, we also experience a seasonal increase in delinquency rates and delinquent loan receivables balances during the third and fourth quarters of each year due to lower customer payment rates. Our delinquency rates and delinquent loan receivables balances typically decrease during the subsequent first and second quarters as customers begin to pay down their loan balances and return to current status. Because customers who were delinquent during the fourth quarter of a calendar year have a higher probability of returning to current status when compared to customers who are delinquent at the end of each of our interim reporting periods, we expect that a higher proportion of delinquent accounts outstanding at an interim period end will result in charge-offs, as compared to delinquent accounts outstanding at a year end. Consistent with this historical experience, we generally experience a higher allowance for loan losses as a percentage of total loan receivables at the end of an interim period, as compared to the end of a calendar year. In addition, despite improving credit metrics such as declining past due amounts, we may experience an increase in our allowance for loan losses at an interim period end compared to the prior year end, reflecting these same seasonal trends.
Results of Operations
____________________________________________________________________________________________
Highlights for the Three and Six Months Ended June 30, 2015
Below are highlights of our performance for the three and six months ended June 30, 2015 compared to the three and six months ended June 30, 2014, as applicable, except as otherwise noted.
| |
• | Net earnings increased 14.6% to $541 million for the three months ended June 30, 2015, driven by higher net interest income, partially offset by increases in provision for loan losses and retailer share arrangements. Net earnings increased 6.1% to $1,093 million for the six months ended June 30, 2015, driven by higher net interest income, partially offset by increases in retailer share arrangements and other expenses. |
| |
• | Loan receivables increased 12.0% to $61,431 million at June 30, 2015 compared to June 30, 2014, primarily driven by higher purchase volume and average active account growth, and also included the acquisition of the BP portfolio. |
| |
• | Net interest income increased 6.9% to $2,907 million and 5.8% to $5,782 million for the three and six months ended June 30, 2015, respectively, primarily due to higher average loan receivables, partially offset by higher funding costs. |
| |
• | Retailer share arrangements increased 5.3% to $621 million and 8.2% to $1,281 million for the three and six months ended June 30, 2015, respectively, primarily as a result of the growth and improved performance of the programs in which we have retailer share arrangements. |
| |
• | Loan delinquencies as a percentage of receivables decreased with the over-30 day delinquency rate decreasing to 3.53% at June 30, 2015 from 3.82% at June 30, 2014, primarily driven by improving asset quality trends and general improvement in the U.S. economy. Net charge-off rates decreased 25 basis points to 4.63% and 29 basis points to 4.56% for the three and six months ended June 30, 2015, respectively, reflecting these same trends. |
| |
• | Provision for loan losses increased by $59 million, or 8.7%, for the three months ended June 30, 2015 primarily due to portfolio growth. Provision for loan losses decreased by $18 million, or 1.2%, for the six months ended June 30, 2015. The decrease was driven primarily due to improving asset quality trends, partially offset by portfolio growth. Our allowance coverage ratio (allowance for loan losses as a percent of end of period loan receivables) decreased slightly to 5.38% at June 30, 2015, as compared to 5.48% at June 30, 2014, reflecting a stable credit outlook. |
| |
• | Other expense increased by $8 million, or 1.0%, and by $144 million, or 10.2%, for the three and six months ended June 30, 2015, respectively, driven by incremental costs associated with building a standalone infrastructure and business growth. The increase in costs associated with infrastructure and business growth for the three months ended June 30, 2015 was largely offset by the impact of a $42 million increase in reserves for consumer remediations in the second quarter of 2014. |
| |
• | We have invested in our direct banking activities to grow our deposit base. Total deposits increased 8.1% to $37.8 billion at June 30, 2015, compared to December 31, 2014, driven primarily by growth in our direct deposits of 23.9% to $24.4 billion, partially offset by a reduction in our brokered deposits. |
| |
• | During the six months ended June 30, 2015 and to date; |
| |
◦ | We extended our Retail Card program agreements with Amazon and Chevron and announced our new partnership with Stash Hotel Rewards. |
| |
◦ | We entered into new program agreements in our Payment Solutions sales platform with Guitar Center, Mattress Firm and Newegg and extended our program agreement with MEGA Group USA, a national home furnishings buying group of independent retailers. |
| |
◦ | In our CareCredit sales platform, we added a new endorsement with VSP, the nation’s largest vision insurance provider, and renewed our endorsement with the American Society of Plastic Surgeons. |
Summary Earnings
The following table sets forth our results of operations for the periods indicated.
|
| | | | | | | | | | | | | | | |
| Three months ended June 30, | | Six months ended June 30, |
($ in millions) | 2015 | | 2014 | | 2015 | | 2014 |
Interest income | $ | 3,177 |
| | $ | 2,926 |
| | $ | 6,327 |
| | $ | 5,859 |
|
Interest expense | 270 |
| | 206 |
| | 545 |
| | 396 |
|
Net interest income | 2,907 |
| | 2,720 |
| | 5,782 |
| | 5,463 |
|
Retailer share arrangements | (621 | ) | | (590 | ) | | (1,281 | ) | | (1,184 | ) |
Net interest income, after retailer share arrangements | 2,286 |
| | 2,130 |
| | 4,501 |
| | 4,279 |
|
Provision for loan losses | 740 |
| | 681 |
| | 1,427 |
| | 1,445 |
|
Net interest income, after retailer share arrangements and provision for loan losses | 1,546 |
| | 1,449 |
| | 3,074 |
| | 2,834 |
|
Other income | 120 |
| | 112 |
| | 221 |
| | 227 |
|
Other expense | 805 |
| | 797 |
| | 1,551 |
| | 1,407 |
|
Earnings before provision for income taxes | 861 |
| | 764 |
| | 1,744 |
| | 1,654 |
|
Provision for income taxes | 320 |
| | 292 |
| | 651 |
| | 624 |
|
Net earnings | $ | 541 |
| | $ | 472 |
| | $ | 1,093 |
| | $ | 1,030 |
|
Other Financial and Statistical Data
The following table sets forth certain other financial and statistical data for the periods indicated. |
| | | | | | | | | | | | | | | |
| At and for the | | At and for the |
| Three months ended June 30, | | Six months ended June 30, |
($ in millions) | 2015 | | 2014 | | 2015 | | 2014 |
Financial Position Data (Average): | | | | | | | |
Loan receivables, including held for sale | $ | 60,094 |
| | $ | 55,363 |
| | $ | 60,124 |
| | $ | 55,593 |
|
Total assets | $ | 74,143 |
| | $ | 61,215 |
| | $ | 74,183 |
| | $ | 60,471 |
|
Deposits | $ | 36,074 |
| | $ | 28,789 |
| | $ | 35,691 |
| | $ | 27,770 |
|
Borrowings | $ | 24,019 |
| | $ | 22,686 |
| | $ | 24,649 |
| | $ | 22,930 |
|
Total equity | $ | 11,300 |
| | $ | 6,328 |
| | $ | 11,023 |
| | $ | 6,452 |
|
Selected Performance Metrics: | | | | | | | |
Purchase volume(1) | $ | 28,810 |
| | $ | 25,978 |
| | $ | 51,949 |
| | $ | 47,064 |
|
Retail Card | $ | 23,452 |
| | $ | 21,032 |
| | $ | 41,862 |
| | $ | 37,745 |
|
Payment Solutions | $ | 3,371 |
| | $ | 3,115 |
| | $ | 6,319 |
| | $ | 5,802 |
|
CareCredit | $ | 1,987 |
| | $ | 1,831 |
| | $ | 3,768 |
| | $ | 3,517 |
|
Average active accounts (in thousands)(2) | 60,923 |
| | 58,386 |
| | 61,478 |
| | 59,080 |
|
Net interest margin(3) | 15.77 | % | | 17.84 | % | | 15.75 | % | | 18.29 | % |
Net charge-offs | $ | 693 |
| | $ | 673 |
| | $ | 1,361 |
| | $ | 1,331 |
|
Net charge-offs as a % of average loan receivables, including held for sale | 4.63 | % | | 4.88 | % | | 4.56 | % | | 4.85 | % |
Allowance coverage ratio(4) | 5.38 | % | | 5.48 | % | | 5.38 | % | | 5.48 | % |
Return on assets(5) | 2.9 | % | | 3.1 | % | | 3.0 | % | | 3.5 | % |
Return on equity(6) | 19.2 | % | | 29.9 | % | | 20.0 | % | | 32.4 | % |
Equity to assets(7) | 15.24 | % | | 10.34 | % | | 14.86 | % | | 10.67 | % |
Other expense as a % of average loan receivables, including held for sale | 5.37 | % | | 5.77 | % | | 5.20 | % | | 5.13 | % |
Efficiency ratio(8) | 33.5 | % | | 35.5 | % | | 32.8 | % | | 31.2 | % |
Effective income tax rate | 37.2 | % | | 38.2 | % | | 37.3 | % | | 37.7 | % |
Selected Period End Data: | | | | | | | |
Loan receivables | $ | 61,431 |
| | $ | 54,873 |
| | $ | 61,431 |
| | $ | 54,873 |
|
Allowance for loan losses | $ | 3,302 |
| | $ | 3,006 |
| | $ | 3,302 |
| | $ | 3,006 |
|
30+ days past due as a % of period-end loan receivables | 3.53 | % | | 3.82 | % | | 3.53 | % | | 3.82 | % |
90+ days past due as a % of period-end loan receivables | 1.52 | % | | 1.65 | % | | 1.52 | % | | 1.65 | % |
Total active accounts (in thousands)(2) | 61,718 |
| | 59,248 |
| | 61,718 |
| | 59,248 |
|
| |
(1) | Purchase volume, or net credit sales, represents the aggregate amount of charges incurred on credit cards or other credit product accounts less returns during the period. Purchase volume includes activity related to our portfolios classified as held for sale. |
| |
(2) | Active accounts represent credit card or installment loan accounts on which there has been a purchase, payment or outstanding balance in the current month. |
| |
(3) | Net interest margin represents net interest income divided by average interest-earning assets. |
| |
(4) | Allowance coverage ratio represents allowance for loan losses divided by total period-end loan receivables. |
| |
(5) | Return on assets represents net earnings as a percentage of average total assets. |
| |
(6) | Return on equity represents net earnings as a percentage of average total equity. |
| |
(7) | Equity to assets represents average equity as a percentage of average total assets. |
| |
(8) | Efficiency ratio represents (i) other expense, divided by (ii) net interest income, after retailer share arrangements, plus other income. |
Average Balance Sheet
The following tables set forth information for the periods indicated regarding average balance sheet data, which are used in the discussion of interest income, interest expense and net interest income that follows.
|
| | | | | | | | | | | | | | | | | | | | | |
| 2015 | | 2014 |
Three months ended June 30 ($ in millions) | Average Balance(1) | | Interest Income / Expense | | Average Yield / Rate(2) | | Average Balance(1) | | Interest Income/ Expense | | Average Yield / Rate(2) |
Assets | | | | | | | | | | | |
Interest-earning assets: | | | | | | | | | | | |
Interest-earning cash and equivalents(3) | $ | 10,728 |
| | $ | 6 |
| | 0.22 | % | | $ | 5,489 |
| | $ | 3 |
| | 0.22 | % |
Securities available for sale | 3,107 |
| | 5 |
| | 0.65 | % | | 285 |
| | 3 |
| | 4.22 | % |
Loan receivables(4): | | | | | | | | | | | |
Credit cards, including held for sale(5) | 57,588 |
| | 3,106 |
| | 21.63 | % | | 52,957 |
| | 2,860 |
| | 21.66 | % |
Consumer installment loans | 1,101 |
| | 26 |
| | 9.47 | % | | 1,004 |
| | 24 |
| | 9.59 | % |
Commercial credit products | 1,372 |
| | 34 |
| | 9.94 | % | | 1,387 |
| | 36 |
| | 10.41 | % |
Other | 33 |
| | — |
| | — | % | | 15 |
| | — |
| | — | % |
Total loan receivables | 60,094 |
| | 3,166 |
| | 21.13 | % | | 55,363 |
| | 2,920 |
| | 21.16 | % |
Total interest-earning assets | 73,929 |
| | 3,177 |
| | 17.24 | % | | 61,137 |
| | 2,926 |
| | 19.20 | % |
Non-interest-earning assets: | | | | | | | | | | | |
Cash and due from banks | 583 |
| | | | | | 637 |
| | | | |
Allowance for loan losses | (3,285 | ) | | | | | | (3,005 | ) | | | | |
Other assets | 2,916 |
| | | | | | 2,446 |
| | | | |
Total non-interest-earning assets | 214 |
| | | | | | 78 |
| | | | |
Total assets | $ | 74,143 |
| | | | | | $ | 61,215 |
| | | | |
Liabilities | | | | | | | | | | | |
Interest-bearing liabilities: | | | | | | | | | | | |
Interest-bearing deposit accounts | $ | 35,908 |
| | $ | 146 |
| | 1.63 | % | | $ | 28,568 |
| | $ | 109 |
| | 1.53 | % |
Borrowings of consolidated securitization entities | 14,026 |
| | 53 |
| | 1.52 | % | | 14,727 |
| | 54 |
| | 1.47 | % |
Bank term loan | 5,401 |
| | 32 |
| | 2.38 | % | | — |
| | — |
| | — | % |
Senior unsecured notes | 4,592 |
| | 39 |
| | 3.41 | % | | — |
| | — |
| | — | % |
Related party debt | — |
| | — |
| | — | % | | 7,959 |
| | 43 |
| | 2.17 | % |
Total interest-bearing liabilities | 59,927 |
| | 270 |
| | 1.81 | % | | 51,254 |
| | 206 |
| | 1.61 | % |
Non-interest-bearing liabilities: | | | | | | | | | | | |
Non-interest-bearing deposit accounts | 166 |
| | | | | | 221 |
| | | | |
Other liabilities | 2,750 |
| | | | | | 3,412 |
| | | | |
Total non-interest-bearing liabilities | 2,916 |
| | | | | | 3,633 |
| | | | |
Total liabilities | 62,843 |
| | | | | | 54,887 |
| | | | |
Equity | | | | | | | | | | | |
Total equity | 11,300 |
| | | | | | 6,328 |
| | | | |
Total liabilities and equity | $ | 74,143 |
| | | | | | $ | 61,215 |
| | | | |
Interest rate spread(6) | | | | | 15.43 | % | | | | | | 17.59 | % |
Net interest income | | | $ | 2,907 |
| | | | | | $ | 2,720 |
| | |
Net interest margin(7) | | | | | 15.77 | % | | | | | | 17.84 | % |
|
| | | | | | | | | | | | | | | | | | | | | |
| 2015 | | 2014 |
Six months ended June 30 ($ in millions) | Average Balance(1) | | Interest Income / Expense | | Average Yield / Rate(2) | | Average Balance(1) | | Interest Income/ Expense | | Average Yield / Rate(2) |
Assets | | | | | | | | | | | |
Interest-earning assets: | | | | | | | | | | | |
Interest-earning cash and equivalents(3) | $ | 11,006 |
| | $ | 12 |
| | 0.22 | % | | $ | 4,710 |
| | $ | 5 |
| | 0.22 | % |
Securities available for sale | 2,887 |
| | 9 |
| | 0.63 | % | | 268 |
| | 6 |
| | 4.54 | % |
Loan receivables(4): | | | | | | | | | | | |
Credit cards, including held for sale(5) | 57,670 |
| | 6,185 |
| | 21.63 | % | | 53,238 |
| | 5,727 |
| | 21.81 | % |
Consumer installment loans | 1,081 |
| | 51 |
| | 9.51 | % | | 984 |
| | 47 |
| | 9.69 | % |
Commercial credit products | 1,345 |
| | 70 |
| | 10.50 | % | | 1,356 |
| | 74 |
| | 11.07 | % |
Other | 28 |
| | — |
| | — | % | | 15 |
| | — |
| | — | % |
Total loan receivables | 60,124 |
| | 6,306 |
| | 21.15 | % | | 55,593 |
| | 5,848 |
| | 21.33 | % |
Total interest-earning assets | 74,017 |
| | 6,327 |
| | 17.24 | % | | 60,571 |
| | 5,859 |
| | 19.61 | % |
Non-interest-earning assets: | | | | | | | | | | | |
Cash and due from banks | 578 |
| | | | | | 611 |
| | | | |
Allowance for loan losses | (3,282 | ) | | | | | | (2,964 | ) | | | | |
Other assets | 2,870 |
| | | | | | 2,253 |
| | | | |
Total non-interest-earning assets | 166 |
| | | | | | (100 | ) | | | | |
Total assets | $ | 74,183 |
| | | | | | $ | 60,471 |
| | | | |
Liabilities | | | | | | | | | | | |
Interest-bearing liabilities: | | | | | | | | | | | |
Interest-bearing deposit accounts | $ | 35,538 |
| | $ | 283 |
| | 1.61 | % | | $ | 27,488 |
| | $ | 205 |
| | 1.51 | % |
Borrowings of consolidated securitization entities | 14,099 |
| | 105 |
| | 1.50 | % | | 14,799 |
| | 101 |
| | 1.38 | % |
Bank term loan | 6,011 |
| | 79 |
| | 2.65 | % | | — |
| | — |
| | — | % |
Senior unsecured notes | 4,307 |
| | 74 |
| | 3.46 | % | | — |
| | — |
| | — | % |
Related party debt | 232 |
| | 4 |
| | 3.48 | % | | 8,131 |
| | 90 |
| | 2.24 | % |
Total interest-bearing liabilities | 60,187 |
| | 545 |
| | 1.83 | % | | 50,418 |
| | 396 |
| | 1.59 | % |
Non-interest-bearing liabilities: | | | | | | | | | | | |
Non-interest-bearing deposit accounts | 153 |
| | | | | | 282 |
| | | | |
Other liabilities | 2,820 |
| | | | | | 3,319 |
| | | | |
Total non-interest-bearing liabilities | 2,973 |
| | | | | | 3,601 |
| | | | |
Total liabilities | 63,160 |
| | | | | | 54,019 |
| | | | |
Equity | | | | | | | | | | | |
Total equity | 11,023 |
| | | | | | 6,452 |
| | | | |
Total liabilities and equity | $ | 74,183 |
| | | | | | $ | 60,471 |
| | | | |
Interest rate spread(6) | | | | | 15.41 | % | | | | | | 18.02 | % |
Net interest income | | | $ | 5,782 |
| | | | | | $ | 5,463 |
| | |
Net interest margin(7) | | | | | 15.75 | % | | | | | | 18.29 | % |
| |
(1) | Average balances are based on monthly balances, including beginning of period balances, except where monthly balances are unavailable and quarterly balances are used. Collection of daily averages currently involves undue burden and expense. We believe our average balance sheet data appropriately incorporates the seasonality in the level of our loan receivables and is representative of our operations. |
| |
(2) | Average yields/rates are based on total interest income/expense over average monthly balances. |
| |
(3) | Includes average restricted cash and equivalents balances of $692 million and $156 million for the three months ended June 30, 2015 and 2014, respectively, and $775 million and $118 million for the six months ended June 30, 2015 and 2014, respectively. |
| |
(4) | Non-accrual loans are included in the average loan receivables balances. |
| |
(5) | Interest income on credit cards includes fees on loans of $526 million and $498 million for the three months ended June 30, 2015 and 2014, respectively, and $1,060 million and $1,026 million for the six months ended June 30, 2015 and 2014, respectively. |
| |
(6) | Interest rate spread represents the difference between the yield on total interest-earning assets and the rate on total interest-bearing liabilities. |
| |
(7) | Net interest margin represents net interest income divided by average total interest-earning assets. |
For a summary description of the composition of our key line items included in our Statements of Earnings, see Management's Discussion and Analysis of Financial Condition and Results of Operations in our 2014 Form 10-K.
Interest Income
Interest income increased by $251 million, or 8.6%, and by $468 million, or 8.0%, for the three and six months ended June 30, 2015, respectively, driven primarily by growth in average loan receivables.
Average interest-earning assets
|
| | | | | | | | | | | | | | | |
| Three months ended June 30, | | Six months ended June 30, |
($ in millions) | 2015 | | 2014 | | 2015 | | 2014 |
Loan receivables, including held for sale | $ | 60,094 |
| | $ | 55,363 |
| | $ | 60,124 |
| | $ | 55,593 |
|
Liquidity portfolio | 13,835 |
| | 5,774 |
| | 13,893 |
| | 4,978 |
|
Total average interest-earning assets | $ | 73,929 |
| | $ | 61,137 |
| | $ | 74,017 |
| | $ | 60,571 |
|
The increases in average loan receivables were driven primarily by higher purchase volume of 10.9% and 10.4% for the three and six months ended June 30, 2015, respectively, as a result of average active account growth and higher purchase volume per account. Average active credit card accounts increased 4.3% to 60.9 million and 4.1% to 61.5 million for the three and six months ended June 30, 2015, respectively.
We have continued to grow our liquidity portfolio since our IPO in the third quarter of 2014, and our liquidity portfolio is comprised primarily of cash and equivalents and obligations of the U.S. Treasury maturing in less than 12 months, which results in a significantly lower yield than our loan receivables.
Yield on average interest-earning assets
|
| | | | | |
| Three months ended June 30 | | Six months ended June 30 |
| | | |
Yield on average interest-earning assets for periods ended June 30, 2014 | 19.20 | % | | 19.61 | % |
Increase in liquidity portfolio invested in cash and short-term U.S. Treasuries | (1.93 | )% | | (2.19 | )% |
Decrease in yield on loan receivables | (0.03 | )% | | (0.18 | )% |
Yield on average interest-earning assets for the periods ended June 30, 2015 | 17.24 | % | | 17.24 | % |
| | | |
The decreases in yield on interest-earning assets for the three and six months ended June 30, 2015 were driven primarily by the growth in our liquidity portfolio, which earns a lower yield than our loan receivables. The yield on our average loan receivables, including loans held for sale, remained relatively flat for the three months ended June 30, 2015 at 21.13%, and decreased slightly to 21.15% for the six months ended June 30, 2015 reflecting the impact of slightly higher payment rates from our customers and growth in promotional balances.
Interest Expense
Interest expense increased by $64 million, or 31.1%, and by $149 million, or 37.6%, for the three and six months ended June 30, 2015, respectively, driven primarily by an increase in average interest-bearing liabilities of $8,673 million, or 16.9%, and $9,769 million, or 19.4%, respectively, as well as a change in our funding mix resulting in higher interest expense.
Average interest-bearing liabilities
|
| | | | | | | | | | | | | | | |
| Three months ended June 30, | | Six months ended June 30, |
($ in millions) | 2015 | | 2014 | | 2015 | | 2014 |
Interest-bearing deposit accounts | $ | 35,908 |
| | $ | 28,568 |
| | $ | 35,538 |
| | $ | 27,488 |
|
Borrowings of consolidated securitization entities | 14,026 |
| | 14,727 |
| | 14,099 |
| | 14,799 |
|
Third-party debt | 9,993 |
| | — |
| | 10,318 |
| | — |
|
Related party debt | — |
| | 7,959 |
| | 232 |
| | 8,131 |
|
Total average interest-bearing liabilities | $ | 59,927 |
| | $ | 51,254 |
| | $ | 60,187 |
| | $ | 50,418 |
|
The increases in average interest-bearing liabilities for the three and six months ended June 30, 2015 were driven primarily by growth in our direct deposits and the issuance of third-party debt to replace our related party funding from GECC.
Our cost of funds increased to 1.81% for the three months ended June 30, 2015 from 1.61% for the three months ended June 30, 2014 reflecting the higher cost of our third-party debt. Our cost of funds increased to 1.83% for the six months ended June 30, 2015 from 1.59% for the six months ended June 30, 2014. See “Funding, Liquidity and Capital Resources—Funding Sources” for more information.
Net Interest Income
Net interest income increased by $187 million, or 6.9%, and by $319 million, or 5.8%, for the three and six months ended June 30, 2015, respectively, driven by growth in loan receivables, partially offset by higher interest expense and a decrease in our yield on interest-earning assets due to higher average assets associated with our liquidity portfolio.
Retailer Share Arrangements
Retailer share arrangements increased by $31 million, or 5.3%, and by $97 million, or 8.2%, for the three and six months ended June 30, 2015, respectively, driven primarily by the growth and improved performance of the programs in which we have retailer share arrangements.
Provision for Loan Losses
Provision for loan losses increased by $59 million, or 8.7%, for the three months ended June 30, 2015, primarily due to portfolio growth.
Provision for loan losses decreased by $18 million, or 1.2%, for the six months ended June 30, 2015. This decrease was driven primarily due to improving asset quality trends, partially offset by receivables growth. Our allowance coverage ratio decreased to 5.38% at June 30, 2015, as compared to 5.48% at June 30, 2014, as our credit outlook remains fairly stable despite the recent improvements in our asset quality trends.
Other Income
|
| | | | | | | | | | | | | | | |
| Three months ended June 30, | | Six months ended June 30, |
($ in millions) | 2015 | | 2014 | | 2015 | | 2014 |
Interchange revenue | $ | 123 |
| | $ | 92 |
| | $ | 223 |
| | $ | 168 |
|
Debt cancellation fees | 61 |
| | 70 |
| | 126 |
| | 140 |
|
Loyalty programs | (94 | ) | | (63 | ) | | (172 | ) | | (106 | ) |
Other | 30 |
| | 13 |
| | 44 |
| | 25 |
|
Total other income | $ | 120 |
| | $ | 112 |
| | $ | 221 |
| | $ | 227 |
|
Other income increased by $8 million, or 7.1%, for the three months ended June 30, 2015. This increase was primarily due to increased interchange revenue driven by increased purchase volume outside of our retail partners' sales channels, and a pre-tax gain of $20 million associated with the sale of certain loan portfolios. These increases were partially offset by higher loyalty costs arising from the launch of new rewards programs with our partners. Other income decreased by $6 million, or 2.6%, for the six months ended June 30, 2015, as higher loyalty costs exceeded the increase in interchange revenue.
Other Expense
|
| | | | | | | | | | | | | | | |
| Three months ended June 30, | | Six months ended June 30, |
($ in millions) | 2015 | | 2014 | | 2015 | | 2014 |
Employee costs | $ | 250 |
| | $ | 207 |
| | $ | 489 |
| | $ | 400 |
|
Professional fees | 156 |
| | 145 |
| | 318 |
| | 275 |
|
Marketing and business development | 108 |
| | 97 |
| | 190 |
| | 180 |
|
Information processing | 74 |
| | 53 |
| | 137 |
| | 105 |
|
Other | 217 |
| | 295 |
| | 417 |
| | 447 |
|
Total other expense | $ | 805 |
| | $ | 797 |
| | $ | 1,551 |
| | $ | 1,407 |
|
Other expense increased by $8 million, or 1.0%, and by $144 million, or 10.2%, for the three and six months ended June 30, 2015, respectively, primarily due to increases in employee costs, professional fees and information processing. These increases were partially offset by a reduction in the "other" component of other expense.
Employee costs increased primarily due to additional compensation expenses for new employees related to the building of our standalone infrastructure and to support business growth. Professional fees increased due to higher professional and other consulting fees related to our planned separation from GE and business growth. Information processing costs increased primarily due to higher information technology investment and higher transaction volume.
The “other” component decreased for the three and six months ended June 30, 2015 primarily due to corporate overhead cost allocations no longer being billed to us by GE. These costs have been replaced by costs within the other expense categories as we have built out our own infrastructure. The "other" component also decreased in the three months ended June 30, 2015 due to a $42 million increase in reserves for a self-identified consumer remediation in the second quarter of 2014.
Provision for Income Taxes
|
| | | | | | | | | | | | | | | |
| Three months ended June 30, | | Six months ended June 30, |
($ in millions) | 2015 | | 2014 | | 2015 | | 2014 |
Effective tax rate | 37.2 | % | | 38.2 | % | | 37.3 | % | | 37.7 | % |
Provision for income taxes | $ | 320 |
| | $ | 292 |
| | $ | 651 |
| | $ | 624 |
|
The effective tax rates for the three and six months ended June 30, 2015 decreased compared to the same periods in the previous year primarily due to a decrease in certain non-deductible expenses and tax expense incurred in the prior year periods related to an internal corporate reorganization. In each period, the effective tax rate differs from the U.S. federal statutory tax rate of 35.0%, primarily due to state income taxes.
Platform Analysis
As discussed above under “Our Sales Platforms,” we offer our products through three sales platforms (Retail Card, Payment Solutions and CareCredit), which management measures based on their revenue-generating activities. The following is a discussion of the platform revenue for each of our platforms.
Non-GAAP Measure
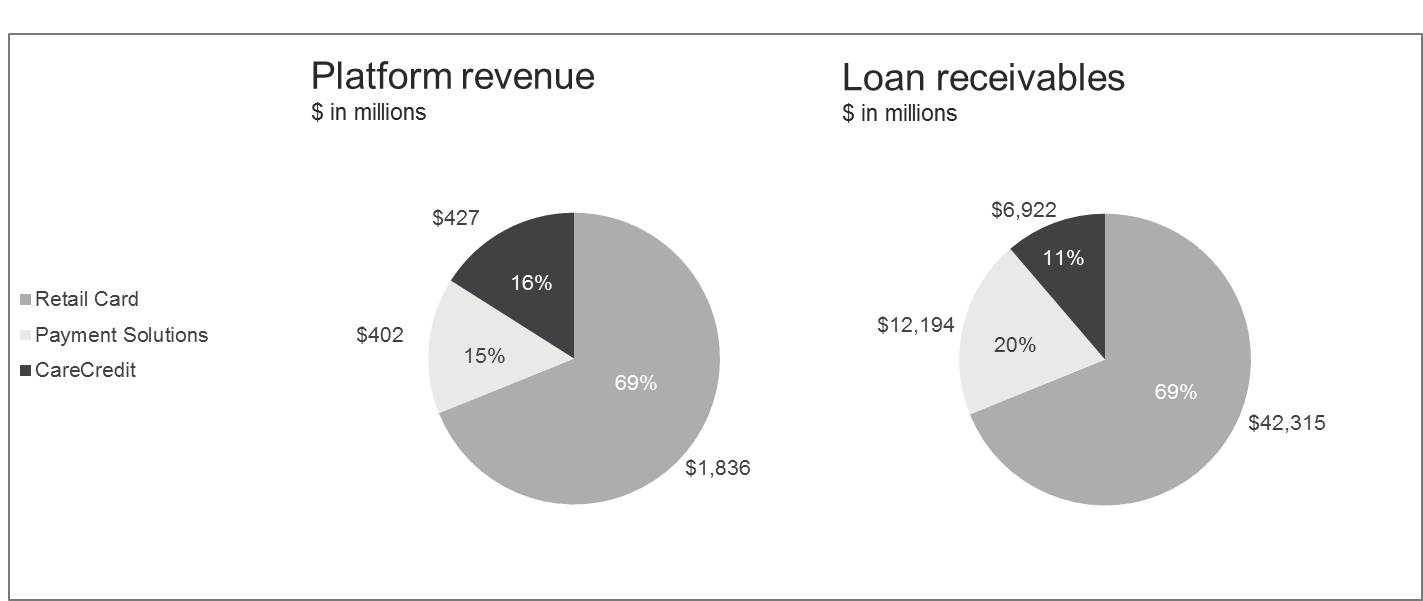
In order to assess and internally report the revenue performance of our three sales platforms, we use a measure we refer to as “platform revenue.” Platform revenue is the sum of three line items in our Condensed Consolidated and Combined Statements of Earnings prepared in accordance with GAAP: “interest and fees on loans,” plus “other income,” less “retailer share arrangements.” Platform revenue itself is not a measure presented in accordance with GAAP. We deduct retailer share arrangements but do not deduct other line item expenses, such as interest expense, provision for loan losses and other expense, because those items are managed for the business as a whole. We believe that platform revenue is a useful measure to investors because it represents management’s view of the net revenue contribution of each of our platforms. This measure should not be considered a substitute for interest and fees on loans or other measures of performance we have reported in accordance with GAAP. The reconciliation of platform revenue to interest and fees on loans for each platform is set forth in the table included in the discussion of each of our three platforms below. The following table sets forth the reconciliation of total platform revenue to total interest and fees on loans for the periods indicated.
|
| | | | | | | | | | | | | | | |
| Three months ended June 30, | | Six months ended June 30, |
($ in millions) | 2015 | | 2014 | | 2015 | | 2014 |
Interest and fees on loans | $ | 3,166 |
| | $ | 2,920 |
| | $ | 6,306 |
| | $ | 5,848 |
|
Other income | 120 |
| | 112 |
| | 221 |
| | 227 |
|
Retailer share arrangements | (621 | ) | | (590 | ) | | (1,281 | ) | | (1,184 | ) |
Platform revenue | $ | 2,665 |
| | $ | 2,442 |
| | $ | 5,246 |
| | $ | 4,891 |
|
Retail Card
The following table sets forth supplemental information related to our Retail Card platform for the periods indicated.
|
| | | | | | | | | | | | | | | |
| Three months ended June 30, | | Six months ended June 30, |
($ in millions) | 2015 | | 2014 | | 2015 | | 2014 |
Purchase volume | $ | 23,452 |
| | $ | 21,032 |
| | $ | 41,862 |
| | $ | 37,745 |
|
Period-end loan receivables | $ | 42,315 |
| | $ | 37,238 |
| | $ | 42,315 |
| | $ | 37,238 |
|
Average loan receivables, including held for sale | $ | 41,303 |
| | $ | 38,047 |
| | $ | 41,302 |
| | $ | 38,273 |
|
Average active accounts (in thousands) | 48,981 |
| | 47,248 |
| | 49,513 |
| | 47,918 |
|
| | | | | | | |
Platform revenue: | | | | | | | |
Interest and fees on loans | $ | 2,335 |
| | $ | 2,158 |
| | $ | 4,672 |
| | $ | 4,336 |
|
Other income | 107 |
| | 92 |
| | 193 |
| | 188 |
|
Retailer share arrangements | (606 | ) | | (577 | ) | | (1,257 | ) | | (1,161 | ) |
Platform revenue | $ | 1,836 |
| | $ | 1,673 |
| | $ | 3,608 |
| | $ | 3,363 |
|
Retail Card platform revenue increased by $163 million, or 9.7%, and by $245 million, or 7.3%, for the three and six months ended June 30, 2015, respectively. The increase in each case was primarily the result of an increase in interest and fees on loans driven by an increase in average loan receivables, partially offset by increases in retailer share arrangement payments. The increases in these payments were as a result of the factors discussed under the heading “Retailer Share Arrangements” above.
Payment Solutions
The following table sets forth supplemental information relating to our Payment Solutions platform for the periods indicated.
|
| | | | | | | | | | | | | | | |
| Three months ended June 30, | | Six months ended June 30, |
($ in millions) | 2015 | | 2014 | | 2015 | | 2014 |
Purchase volume | $ | 3,371 |
| | $ | 3,115 |
| | $ | 6,319 |
| | $ | 5,802 |
|
Period-end loan receivables | $ | 12,194 |
| | $ | 11,014 |
| | $ | 12,194 |
| | $ | 11,014 |
|
Average loan receivables | $ | 11,971 |
| | $ | 10,785 |
| | $ | 11,990 |
| | $ | 10,799 |
|
Average active accounts (in thousands) | 7,231 |
| | 6,692 |
| | 7,251 |
| | 6,718 |
|
| | | | | | | |
Platform revenue: | | | | | | | |
Interest and fees on loans | $ | 412 |
| | $ | 379 |
| | $ | 815 |
| | $ | 751 |
|
Other income | 4 |
| | 8 |
| | 9 |
| | 16 |
|
Retailer share arrangements | (14 | ) | | (12 | ) | | (22 | ) | | (21 | ) |
Platform revenue | $ | 402 |
| | $ | 375 |
| | $ | 802 |
| | $ | 746 |
|
Payment Solutions platform revenue increased by $27 million, or 7.2%, and by $56 million, or 7.5%, for the three and six months ended June 30, 2015, respectively. The increase in each case was primarily the result of higher interest and fees on loans driven primarily by an increase in average loan receivables.
CareCredit
The following table sets forth supplemental information relating to our CareCredit platform for the periods indicated.
|
| | | | | | | | | | | | | | | |
| Three months ended June 30, | | Six months ended June 30, |
($ in millions) | 2015 | | 2014 | | 2015 | | 2014 |
Purchase volume | $ | 1,987 |
| | $ | 1,831 |
| | $ | 3,768 |
| | $ | 3,517 |
|
Period-end loan receivables | $ | 6,922 |
| | $ | 6,621 |
| | $ | 6,922 |
| | $ | 6,621 |
|
Average loan receivables | $ | 6,820 |
| | $ | 6,531 |
| | $ | 6,832 |
| | $ | 6,521 |
|
Average active accounts (in thousands) | 4,711 |
| | 4,446 |
| | 4,714 |
| | 4,444 |
|
| | | | | | | |
Platform revenue: | | | | | | | |
Interest and fees on loans | $ | 419 |
| | $ | 383 |
| | $ | 819 |
| | $ | 761 |
|
Other income | 9 |
| | 12 |
| | 19 |
| | 23 |
|
Retailer share arrangements | (1 | ) | | (1 | ) | | (2 | ) | | (2 | ) |
Platform revenue | $ | 427 |
| | $ | 394 |
| | $ | 836 |
| | $ | 782 |
|
CareCredit platform revenue increased by $33 million, or 8.4%, and by $54 million, or 6.9%, for the three and six months ended June 30, 2015, respectively. The increase in each case was primarily the result of an increase in interest and fees on loans driven primarily by an increase in average loan receivables.
Services and Funding Provided by GE and GECC
____________________________________________________________________________________________
Services provided by GE
GE owns approximately 84.6% of our common stock and continues to provide a variety of services to us, which are governed by the Transitional Services Agreement ("TSA") and various other agreements with GE and GECC that we entered into in connection with the IPO. The services provided include, among other things, employee benefits and benefit administration, information technology, telecommunication services and leases for vehicles, equipment and facilities. Under the TSA, all of the costs billed to us by GE subsequent to the IPO are at GE’s cost in accordance with historic billing methodologies. We expect the majority of the services provided by GE will be replaced within two years from the closing date of the IPO.
For periods prior to the IPO, we were an indirect wholly-owned subsidiary of GE and GECC, and in addition to the services discussed above, we also received a corporate overhead allocation and assessment from GE and GECC for corporate activities that either directly or indirectly benefited our business. We no longer receive such corporate overhead cost allocations and assessments.
Funding provided by GECC
GECC no longer provides funding to our business. In connection with the IPO, in August 2014, all of the historical related party debt outstanding was repaid, and GECC provided transitional funding pursuant to the $1.5 billion GECC Term Loan Facility ("GECC Term Loan"). In March 2015, we prepaid all of the remaining outstanding indebtedness provided by the GECC Term Loan. Prior to the IPO, GECC was a key source of funding for our business pursuant to various intercompany funding arrangements.
See Note 13. Related Party Transactions to our condensed consolidated and combined financial statements for additional information on our transactions with GE and GECC, and see “Funding, Liquidity and Capital Resources—Funding Sources—Related Party Debt” for additional information on the funding that has been provided by GECC to us and the related interest expense.
Investment Securities
____________________________________________________________________________________________
The following discussion provides supplemental information regarding our investment securities portfolio. All of our investment securities were classified as available-for-sale at June 30, 2015 and December 31, 2014, and were primarily obligations of the U.S. Treasury or investments held to comply with the Community Reinvestment Act. Investment securities classified as available-for-sale are reported in our Condensed Consolidated Statements of Financial Position at fair value.
The following table sets forth the amortized cost and fair value of our investment securities at the dates indicated:
|
| | | | | | | | | | | | | | | |
| At June 30, 2015 | | At December 31, 2014 |
($ in millions) | Amortized Cost | | Estimated Fair Value | | Amortized Cost | | Estimated Fair Value |
Debt: | | | | | | | |
U.S. government and federal agency | $ | 3,273 |
| | $ | 3,274 |
| | $ | 1,252 |
| | $ | 1,252 |
|
State and municipal | 55 |
| | 54 |
| | 57 |
| | 57 |
|
Residential mortgage-backed | 344 |
| | 339 |
| | 271 |
| | 271 |
|
U.S. corporate debt | — |
| | — |
| | 3 |
| | 3 |
|
Equity | 15 |
| | 15 |
| | 15 |
| | 15 |
|
Total | $ | 3,687 |
| | $ | 3,682 |
| | $ | 1,598 |
| | $ | 1,598 |
|
Unrealized gains and losses, net of the related tax effect, on available-for-sale securities that are not other-than-temporarily impaired are excluded from earnings and are reported as a separate component of comprehensive income (loss) until realized. At June 30, 2015, our investment securities had gross unrealized gains of $4 million and gross unrealized losses of $9 million. At December 31, 2014, our investment securities had gross unrealized gains of $4 million and gross unrealized losses of $4 million.
Our investment securities portfolio had the following maturity distribution at June 30, 2015. Equity securities have been excluded from the table because they do not have a maturity.
|
| | | | | | | | | | | | | | | | | | | |
($ in millions) | Due in 1 Year or Less | | Due After 1 through 5 Years | | Due After 5 through 10 Years | | Due After 10 years | | Total |
Debt: | | | | | | | | | |
U.S. government and federal agency | $ | 1,875 |
| | $ | 1,399 |
| | $ | — |
| | $ | — |
| | $ | 3,274 |
|
State and municipal | — |
| | — |
| | 1 |
| | 53 |
| | 54 |
|
Residential mortgage-backed | — |
| | — |
| | — |
| | 339 |
| | 339 |
|
Total(1) | $ | 1,875 |
| | $ | 1,399 |
| | $ | 1 |
| | $ | 392 |
| | $ | 3,667 |
|
Weighted average yield(2) | 0.1 | % | | 0.5 | % | | 3.9 | % | | 3.5 | % | | 0.6 | % |
______________________
| |
(1) | Amounts stated represent estimated fair value. |
| |
(2) | Weighted average yield is calculated based on the amortized cost of each security. In calculating yield, no adjustment has been made with respect to any tax exempt obligations. |
At June 30, 2015, we did not hold investments in any single issuer, other than investments in U.S. government and federal agencies, with an aggregate book value that exceeded 10% of equity.
Loan Receivables
____________________________________________________________________________________________
The following discussion provides supplemental information regarding our loan receivables portfolio.
Loan receivables are our largest category of assets and represent our primary source of revenues. The following table sets forth the composition of our loan receivables portfolio by product type at the dates indicated.
|
| | | | | | | | | | | | | |
($ in millions) | At June 30, 2015 | | (%) | | At December 31, 2014 | | (%) |
Loans | | | | | |
Credit cards | $ | 58,827 |
| | 95.8 | % | | $ | 58,880 |
| | 96.1 | % |
Consumer installment loans | 1,138 |
| | 1.9 |
| | 1,063 |
| | 1.7 |
|
Commercial credit products | 1,410 |
| | 2.3 |
| | 1,320 |
| | 2.2 |
|
Other | 56 |
| | — |
| | 23 |
| | — |
|
Total loans | $ | 61,431 |
| | 100.0 | % | | $ | 61,286 |
| | 100.0 | % |
Loan receivables increased by $145 million, or 0.2%, at June 30, 2015 compared to December 31, 2014 primarily driven by higher purchase volume, average active account growth, and the acquisition of the BP portfolio. These increases were largely offset by the impact from the seasonality of our business.
Loan receivables increased by $6,558 million, or 12.0%, at June 30, 2015 compared to June 30, 2014, primarily driven by higher purchase volume and average active account growth, and also included the acquisition of the BP portfolio.
Our loan receivables portfolio had the following maturity distribution at June 30, 2015.
|
| | | | | | | | | | | | | | | |
($ in millions) | Within 1 Year(1) | | 1-5 Years | | After 5 Years | | Total |
Loans | | | | | | | |
Credit cards | $ | 58,827 |
| | $ | — |
| | $ | — |
| | $ | 58,827 |
|
Consumer installment loans | 20 |
| | 607 |
| | 511 |
| | 1,138 |
|
Commercial credit products | 1,410 |
| | — |
| | — |
| | 1,410 |
|
Other | 39 |
| | 13 |
| | 4 |
| | 56 |
|
Total loans | $ | 60,296 |
| | $ | 620 |
| | $ | 515 |
| | $ | 61,431 |
|
Loans due after one year at fixed interest rates | N/A |
| | $ | 620 |
| | $ | 545 |
| | $ | 1,165 |
|
Loans due after one year at variable interest rates | N/A |
| | — |
| | — |
| | — |
|
Total loans due after one year | N/A |
| | $ | 620 |
| | $ | 545 |
| | $ | 1,165 |
|
| |
(1) | Credit card loans have minimum payment requirements but no stated maturity and therefore are included in the due within one year category. However, many of our credit card holders will revolve their balances, which may extend their repayment period beyond one year for balances at June 30, 2015. |
Our loan receivables portfolio had the following geographic concentration at June 30, 2015.
|
| | | | | | | |
($ in millions) | | Loan Receivables Outstanding(1) | | % of Total Loan Receivables Outstanding |
State | |
Texas | | $ | 6,000 |
| | 9.8 | % |
California | | $ | 5,866 |
| | 9.5 | % |
Florida | | $ | 4,740 |
| | 7.7 | % |
New York | | $ | 3,471 |
| | 5.7 | % |
Pennsylvania | | $ | 2,731 |
| | 4.4 | % |
| |
(1) | Based on June 2015 customer statement-end balances extrapolated to June 30, 2015. Individual customer balances at June 30, 2015 are not available without undue burden and expense. |
Impaired Loans and Troubled Debt Restructurings
Our loss mitigation strategy is intended to minimize economic loss and at times can result in rate reductions, principal forgiveness, extensions or other actions, which may cause the related loan to be classified as a Troubled Debt Restructuring (“TDR”) and also be impaired. We use short-term (3 to 12 months) or long-term (12 to 60 months) modification programs for borrowers experiencing financial difficulty as a loss mitigation strategy to improve long-term collectability of the loans that are classified as TDRs. For our credit card customers, the short-term program primarily consists of a reduced minimum payment and an interest rate reduction, both lasting for a period no longer than 12 months. The long-term program involves changing the structure of the loan to a fixed payment loan with a maturity no longer than 60 months and reducing the interest rate on the loan. The long-term program does not normally provide for the forgiveness of unpaid principal, but may allow for the reversal of certain unpaid interest or fee assessments. We also make loan modifications for some customers who request financial assistance through external sources, such as a consumer credit counseling agency program. The loans that are modified typically receive a reduced interest rate but continue to be subject to the original minimum payment terms and do not normally include waiver of unpaid principal, interest or fees. The determination of whether these changes to the terms and conditions meet the TDR criteria includes our consideration of all relevant facts and circumstances.
Loans classified as TDRs are recorded at their present value with impairment measured as the difference between the loan balance and the discounted present value of cash flows expected to be collected, discounted at the original effective interest rate of the loan. Our allowance for loan losses on TDRs is generally measured based on the difference between the recorded loan receivable and the present value of the expected future cash flows.
Interest income from loans accounted for as TDRs is accounted for in the same manner as other accruing loans. We accrue interest on credit card balances until the accounts are charged-off in the period the accounts become 180 days past due. The following table presents the amount of loan receivables that are not accruing interest, loans that are 90 days or more past-due and still accruing interest, and earning TDRs for the periods presented.
|
| | | | | | | |
($ in millions) | At June 30, 2015 | | At December 31, 2014 |
Non-accrual loan receivables | $ | 2 |
| | $ | 2 |
|
Loans contractually 90 days past-due and still accruing interest | 931 |
| | 1,160 |
|
Earning TDRs(1) | 675 |
| | 670 |
|
Non-accrual, past-due and restructured loan receivables | $ | 1,608 |
| | $ | 1,832 |
|
______________________
| |
(1) | At June 30, 2015 and December 31, 2014, balances exclude $44 million and $54 million, respectively, of TDRs which are included in loans contractually 90 days past-due and still accruing interest on the balance. See Note 4. Loan Receivables and Allowance for Loan Losses to our condensed consolidated and combined financial statements for additional information on the financial effects of TDRs for the three and six months ended June 30, 2015 and 2014. |
Delinquencies
Loan delinquencies as a percentage of period-end loan receivables decreased with the over-30 day delinquency rate decreasing to 3.53% at June 30, 2015, as compared to 3.82% at June 30, 2014 and 4.14% at December 31, 2014. The 29 basis point decrease compared to the same period in prior year was primarily driven by improvement in the U.S. economy. The decrease as compared to December 31, 2014 was primarily driven by the seasonality of our business, as well as improvement in the U.S. economy.
Net Charge-Offs
Net charge-offs consist of the unpaid principal balance of loans held for investment that we determine are uncollectible, net of recovered amounts. We exclude accrued and unpaid finance charges and fees and third-party fraud losses from charge-offs. Charged-off and recovered finance charges and fees are included in interest and fees on loans while third party fraud losses are included in other expense. Charge-offs are recorded as a reduction to the allowance for loan losses and subsequent recoveries of previously charged-off amounts are credited to the allowance for loan losses. Costs incurred to recover charged-off loans are recorded as collection expense and included in other expense in our Condensed Consolidated and Combined Statements of Earnings.
The table below sets forth the ratio of net charge-offs to average loan receivables, including held for sale, for the periods indicated. |
| | | | | | | | | | | |
| Three months ended June 30, | | Six months ended June 30, |
| 2015 | | 2014 | | 2015 | | 2014 |
Ratio of net charge-offs to average loan receivables, including held for sale | 4.63 | % | | 4.88 | % | | 4.56 | % | | 4.85 | % |
Allowance for Loan Losses
The allowance for loan losses totaled $3,302 million at June 30, 2015 compared with $3,236 million at December 31, 2014, representing our best estimate of probable losses inherent in the portfolio. Our allowance for loan losses as a percentage of total loan receivables increased to 5.38% at June 30, 2015, from 5.28% at December 31, 2014 primarily due to the seasonality of our business.
The following tables provide changes in our allowance for loan losses for the periods presented: |
| | | | | | | | | | | | | | | | | | | |
($ in millions) | Balance at April 1, 2015 |
| | Provision charged to operations |
| | Gross charge-offs |
| | Recoveries |
| | Balance at June 30, 2015 |
|
| | | | | | | | | |
Credit cards | $ | 3,184 |
| | $ | 723 |
| | $ | (814 | ) | | $ | 136 |
| | $ | 3,229 |
|
Consumer installment loans | 24 |
| | 2 |
| | (7 | ) | | 4 |
| | 23 |
|
Commercial credit products | 47 |
| | 14 |
| | (13 | ) | | 1 |
| | 49 |
|
Other | — |
| | 1 |
| | — |
| | — |
| | $ | 1 |
|
Total | $ | 3,255 |
| | $ | 740 |
| | $ | (834 | ) | | $ | 141 |
| | $ | 3,302 |
|
|
| | | | | | | | | | | | | | | | | | | |
($ in millions) | Balance at April 1, 2014 |
| | Provision charged to operations |
| | Gross charge-offs |
| | Recoveries |
| | Balance at June 30, 2014 |
|
| | | | | | | | | |
Credit cards | $ | 2,935 |
| | $ | 662 |
| (a) | $ | (792 | ) | | $ | 134 |
| | $ | 2,939 |
|
Consumer installment loans | 17 |
| | 7 |
| | (7 | ) | | 3 |
| | 20 |
|
Commercial credit products | 46 |
| | 12 |
| | (13 | ) | | 2 |
| | 47 |
|
Total | $ | 2,998 |
| | $ | 681 |
| | $ | (812 | ) | | $ | 139 |
| | $ | 3,006 |
|
|
| | | | | | | | | | | | | | | | | | | |
| Balance at January 1, 2015 |
| | Provision Charged to Operations |
| | Gross Charge- Offs |
| | Recoveries |
| | Balance at June 30, 2015 |
|
($ in millions) | |
Credit cards | $ | 3,169 |
| | $ | 1,392 |
| | $ | (1,648 | ) | | $ | 316 |
| | $ | 3,229 |
|
Consumer installment loans | 22 |
| | 9 |
| | (16 | ) | | 8 |
| | 23 |
|
Commercial credit products | 45 |
| | 25 |
| | (24 | ) | | 3 |
| | 49 |
|
Other | — |
| | 1 |
| | — |
| | — |
| | 1 |
|
Total | $ | 3,236 |
| | $ | 1,427 |
| | $ | (1,688 | ) | | $ | 327 |
| | $ | 3,302 |
|
|
| | | | | | | | | | | | | | | | | | | |
| Balance at January 1, 2014 |
| | Provision Charged to Operations |
| | Gross Charge- Offs |
| | Recoveries |
| | Balance at June 30, 2014 |
|
($ in millions) | |
Credit cards | $ | 2,827 |
| | $ | 1,414 |
| (a) | $ | (1,573 | ) | | $ | 271 |
| | $ | 2,939 |
|
Consumer installment loans | 19 |
| | 9 |
| | (14 | ) | | 6 |
| | 20 |
|
Commercial credit products | 46 |
| | 22 |
| | (25 | ) | | 4 |
| | 47 |
|
Total | $ | 2,892 |
| | $ | 1,445 |
| | $ | (1,612 | ) | | $ | 281 |
| | $ | 3,006 |
|
| |
(a) | Includes a $57 million reduction in provision for loan losses associated with the classification of certain loan receivables as held for sale. |
Funding, Liquidity and Capital Resources
____________________________________________________________________________________________
We maintain a strong focus on liquidity and capital. Our funding, liquidity and capital policies are designed to ensure that our business has the liquidity and capital resources to support our daily operations, our business growth, our credit ratings and our regulatory and policy requirements, in a cost effective and prudent manner through expected and unexpected market environments.
Funding Sources
Our primary funding sources include cash from operations, deposits (direct and brokered deposits), third-party debt and securitized financings.
The following table summarizes information concerning our funding sources during the periods indicated:
|
| | | | | | | | | | | | | | | | | | | |
| 2015 | | 2014 |
Three months ended June 30 ($ in millions) | Average Balance | | % | | Average Rate | | Average Balance | | % | | Average Rate |
Deposits(1) | $ | 35,908 |
| | 59.9 | % | | 1.6 | % | | $ | 28,568 |
| | 55.7 | % | | 1.5 | % |
Securitized financings | 14,026 |
| | 23.4 |
| | 1.5 |
| | 14,727 |
| | 28.7 |
| | 1.5 |
|
Bank term loan | 5,401 |
| | 9.0 |
| | 2.4 |
| | — |
| | — |
| | — |
|
Senior unsecured notes | 4,592 |
| | 7.7 |
| | 3.4 |
| | — |
| | — |
| | — |
|
Related party debt | — |
| | — |
| | — |
| | 7,959 |
| | 15.6 |
| | 2.2 |
|
Total | $ | 59,927 |
| | 100.0 | % | | 1.8 | % | | $ | 51,254 |
| | 100.0 | % | | 1.6 | % |
| |
(1) | Excludes $166 million and $221 million average balance of non-interest-bearing deposits for the three months ended June 30, 2015 and June 30, 2014, respectively. Non-interest-bearing deposits comprise less than 10% of total deposits for the three months ended June 30, 2015 and 2014. |
|
| | | | | | | | | | | | | | | | | | | |
| 2015 | | 2014 |
Six months ended June 30 ($ in millions) | Average Balance | | % | | Average Rate | | Average Balance | | % | | Average Rate |
Deposits(1) | $ | 35,538 |
| | 59.0 | % | | 1.6 | % | | $ | 27,488 |
| | 54.5 | % | | 1.5 | % |
Securitized financings | 14,099 |
| | 23.4 |
| | 1.5 |
| | 14,799 |
| | 29.4 |
| | 1.4 |
|
Bank term loan | 6,011 |
| | 10.0 |
| | 2.7 |
| | — |
| | — |
| | — |
|
Senior unsecured notes | 4,307 |
| | 7.2 |
| | 3.5 |
| | — |
| | — |
| | — |
|
Related party debt | 232 |
| | 0.4 |
| | 3.5 |
| | 8,131 |
| | 16.1 |
| | 2.2 |
|
Total | $ | 60,187 |
| | 100.0 | % | | 1.8 | % | | $ | 50,418 |
| | 100.0 | % | | 1.6 | % |
______________________
| |
(1) | Excludes $153 million and $282 million average balance of non-interest-bearing deposits for the six months ended June 30, 2015 and June 30, 2014, respectively. Non-interest-bearing deposits comprise less than 10% of total deposits for the six months ended June 30, 2015 and 2014. |
Deposits
We obtain deposits directly from retail and commercial customers (“direct deposits”) or through third-party brokerage firms that offer our deposits to their customers (“brokered deposits”). At June 30, 2015, we had $24.4 billion in direct deposits (which includes deposits from banks and financial institutions) and $13.4 billion in deposits originated through brokerage firms (including network deposit sweeps procured through a program arranger that channels brokerage account deposits to us). A key part of our liquidity plan and funding strategy is to significantly expand our direct deposits base as a source of stable and diversified low cost funding.
Our direct deposits include a range of FDIC-insured deposit products, including certificates of deposit, IRAs, money market accounts and savings accounts, which we offer under our Optimizer+plus brand.
Brokered deposits are primarily from retail customers of large brokerage firms. We have relationships with eight brokers that offer our deposits through their networks. Our brokered deposits consist primarily of certificates of deposit that bear interest at a fixed rate and at June 30, 2015, had a weighted average remaining life of 3.4 years. These deposits generally are not subject to early withdrawal.
Our ability to attract deposits is sensitive to, among other things, the interest rates we pay, and therefore, we bear funding and interest rate risk if we fail, or are required to pay higher rates, to attract new deposits or retain existing deposits. To mitigate these risks, we pursue a funding strategy that seeks to match our assets and liabilities by interest rate and expected maturity characteristics, and we seek to maintain access to multiple other funding sources, including securitized financings (including our undrawn committed capacity) and unsecured debt.
Over the next several years, we are seeking to continue to increase our direct deposits through further investing in our direct deposit programs and capabilities. The growth of direct deposits will be supported by a significant investment in marketing and brand awareness.
The following table summarizes certain information regarding our interest-bearing deposits by type (all of which constitute U.S. deposits) for the periods indicated:
|
| | | | | | | | | | | | | | | | | | | |
Three months ended June 30 ($ in millions) | 2015 | | 2014 |
Average Balance(1) | | % of Total | | Average Rate | | Average Balance(1) | | % of Total | | Average Rate |
Direct deposits: | | | | | | | | | | | |
Certificates of deposit (including IRA certificates of deposit) | $ | 14,966 |
| | 41.7 | % | | 1.4 | % | | $ | 10,335 |
| | 36.2 | % | | 1.2 | % |
Savings accounts (including money market accounts) | 7,438 |
| | 20.7 |
| | 1.0 |
| | 3,796 |
| | 13.3 |
| | 0.9 |
|
Brokered deposits | 13,504 |
| | 37.6 |
| | 2.3 |
| | 14,437 |
| | 50.5 |
| | 1.9 |
|
Total interest-bearing deposits | $ | 35,908 |
| | 100.0 | % | | 1.6 | % | | $ | 28,568 |
| | 100.0 | % | | 1.5 | % |
|
| | | | | | | | | | | | | | | | | | | |
Six months ended June 30 ($ in millions) | 2015 | | 2014 |
Average Balance(1) | | % of Total | | Average Rate | | Average Balance(1) | | % of Total | | Average Rate |
Direct deposits: | | | | | | | | | | | |
Certificates of deposit (including IRA certificates of deposit) | $ | 14,414 |
| | 40.6 | % | | 1.4 | % | | $ | 9,567 |
| | 34.8 | % | | 1.2 | % |
Savings accounts (including money market accounts) | 6,981 |
| | 19.6 |
| | 1.0 |
| | 3,333 |
| | 12.1 |
| | 0.9 |
|
Brokered deposits | 14,143 |
| | 39.8 |
| | 2.2 |
| | 14,588 |
| | 53.1 |
| | 1.9 |
|
Total interest-bearing deposits | $ | 35,538 |
| | 100.0 | % | | 1.6 | % | | $ | 27,488 |
| | 100.0 | % | | 1.5 | % |
______________________
| |
(1) | Average balances are based on monthly balances. Calculation of daily averages at this time involves undue burden and expense. We believe our average balance data is representative of our operations. |
Our deposit liabilities provide funding with maturities ranging from one day to ten years. At June 30, 2015, the weighted average maturity of our interest-bearing time deposits was 2.3 years. See Note 7. Deposits to our condensed consolidated and combined financial statements for more information on their maturities.
The following table summarizes deposits by contractual maturity at June 30, 2015.
|
| | | | | | | | | | | | | | | | | | | |
($ in millions) | 3 Months or Less | | Over 3 Months but within 6 Months | | Over 6 Months but within 12 Months | | Over 12 Months | | Total |
U.S. deposits (less than $100,000)(1) | $ | 4,532 |
| | $ | 1,534 |
| | $ | 2,326 |
| | $ | 11,768 |
| | $ | 20,160 |
|
U.S. deposits ($100,000 or more) | | | | | | | | | |
Direct deposits: | | | | | | | | | |
Certificates of deposit (including IRA certificates of deposit) | 1,474 |
| | 1,604 |
| | 3,908 |
| | 3,819 |
| | 10,805 |
|
Savings accounts (including money market accounts) | 6,580 |
| | — |
| | — |
| | — |
| | 6,580 |
|
Brokered deposits: | | | | | | | | | |
Sweep accounts | 227 |
| | — |
| | — |
| | — |
| | 227 |
|
Total | $ | 12,813 |
| | $ | 3,138 |
| | $ | 6,234 |
| | $ | 15,587 |
| | $ | 37,772 |
|
______________________
| |
(1) | Includes brokered certificates of deposit for which underlying individual deposit balances are assumed to be less than $100,000. |
Securitized Financings
We have been engaged in the securitization of our credit card receivables since 1997. We access the asset-backed securitization market using the Synchrony Credit Card Master Note Trust (“MNT”) through which we issue asset-backed securities through both public transactions and private transactions funded by financial institutions and commercial paper conduits. In addition, we issue asset-backed securities in private transactions through the Synchrony Sales Finance Master Trust (“SFT”) and the Synchrony Receivables Trust ("SRT").
The following table summarizes expected contractual maturities of the investors’ interests in securitized financings at June 30, 2015.
|
| | | | | | | | | | | | | | | | | | | |
($ in millions) | Less Than One Year | | One Year Through Three Years | | Four Years Through Five Years | | After Five Years | | Total |
Scheduled maturities of long-term borrowings—owed to securitization investors: | | | | | | | | | |
MNT(1) | $ | 1,243 |
| | $ | 8,335 |
| | $ | 1,913 |
| | $ | — |
| | $ | 11,491 |
|
SFT | 375 |
| | 1,875 |
| | — |
| | — |
| | 2,250 |
|
SRT | 51 |
| | 156 |
| | — |
| | — |
| | 207 |
|
Total long-term borrowings—owed to securitization investors | $ | 1,669 |
| | $ | 10,366 |
| | $ | 1,913 |
| | $ | — |
| | $ | 13,948 |
|
| |
(1) | Excludes subordinated classes of MNT notes that we own. |
We retain exposure to the performance of trust assets through: (i) in the case of MNT, SFT and SRT, subordinated retained interests in the receivables transferred to the trust in excess of the principal amount of the notes for a given series to provide credit enhancement for a particular series, as well as a pari passu seller’s interest in each trust and (ii) subordinated classes of MNT notes that we own.
All of our securitized financings include early repayment triggers, referred to as early amortization events, including events related to material breaches of representations, warranties or covenants, inability or failure of the Bank to transfer loans to the trusts as required under the securitization documents, failure to make required payments or deposits pursuant to the securitization documents, and certain insolvency-related events with respect to the related securitization depositor, GECC (solely with respect to MNT) or the Bank. In addition, an early amortization event will occur with respect to a series if the excess spread as it relates to a particular series falls below zero. Following an early amortization event, principal collections on the loans in our trusts are applied to repay principal of the asset-backed securities rather than being available on a revolving basis to fund the origination activities of our business. The occurrence of an early amortization event also would limit or terminate our ability to issue future series out of the trust in which the early amortization event occurred. No early amortization event has occurred with respect to any of the securitized financings in MNT, SFT or SRT.
The following table summarizes for each of our trusts the three-month rolling average excess spread at June 30, 2015.
|
| | | | | | | | | |
| Note Principal Balance ($ in millions) | | # of Series Outstanding | | Three-Month Rolling Average Excess Spread(1) |
MNT(2) | $ | 12,854 |
| | 20 |
| | 13.8% to 17.3% |
|
SFT | $ | 2,250 |
| | 9 |
| | 13.4 | % |
SRT | $ | 207 |
| | 1 |
| | 38.5 | % |
______________________
| |
(1) | Represents the excess spread (generally calculated as interest income collected from the applicable pool of loan receivables less applicable net charge-offs, interest expense and servicing costs, divided by the aggregate principal amount of loan receivables in the applicable pool) for each trust (or, in the case of MNT, represents a range of the excess spreads relating to the particular series outstanding as of June 30, 2015 issued within the trust, omitting any series that have not been outstanding for at least three monthly periods), in each case calculated in accordance with the applicable trust or series documentation, for the three securitization monthly periods ending prior to June 30, 2015. |
| |
(2) | Includes subordinated classes of MNT notes that we own. |
Third-Party Debt
Bank Term Loan
During the six months ended June 30, 2015, we prepaid $3.1 billion in the aggregate of the Bank Term Loan, which included the use of a portion of the net proceeds from the issuance of senior unsecured notes in February 2015. At June 30, 2015, the total indebtedness outstanding under the Bank Term Loan following prepayments was $5.2 billion and the weighted average interest rate was 2.09%.
Senior Unsecured Notes
On February 2, 2015, we issued a total of $1.0 billion principal amount of senior unsecured notes, comprising $750 million aggregate principal amount of 2.700% senior notes due 2020, and $250 million aggregate principal amount of floating rate (three-month LIBOR plus 1.23%) senior notes due 2020. All of the net proceeds from this issuance were used to prepay the Bank Term Loan and GECC Term Loan on a pro rata basis.
At June 30, 2015, the aggregate principal amount of outstanding senior unsecured notes was $4.6 billion and the weighted average interest rate was 3.21%.
On July 23, 2015, we issued a total of $1.0 billion principal amount of 4.500% senior unsecured notes due 2025.
Related Party Debt
During the first quarter of 2015, we prepaid $655 million of the GECC Term Loan, which represented all of the remaining outstanding indebtedness under that agreement, and GECC no longer provides funding to our business.
During the six months ended June 30, 2014, GECC was a key source of our debt funding pursuant to various intercompany funding arrangements.
The aggregate interest and fees incurred with respect to funding provided by GECC to us was $4 million for the six months ended June 30, 2015 and $43 million and $90 million for the three and six months ended June 30, 2014, respectively.
Short-Term Borrowings
Except as described above, there were no material short-term borrowings for the periods presented.
Undrawn securitized financings
At June 30, 2015, we had an aggregate of $6.1 billion of undrawn committed capacity on our securitized financings, subject to customary borrowing conditions, from private lenders under two of our existing securitization programs.
Other
At June 30, 2015, we had more than $25.0 billion of unencumbered assets in the Bank available to be used to generate additional liquidity through secured borrowings or asset sales or to be pledged to the Federal Reserve Board for credit at the discount window.
Off-Balance Sheet Items—Guarantees
We do not have any significant off-balance sheet items, including guarantees of third-party obligations. Guarantees are contracts or indemnification agreements that contingently require us to make a guaranteed payment or perform an obligation to a third-party based on certain trigger events. At June 30, 2015, we had not recorded any contingent liabilities in our Condensed Consolidated Statement of Financial Position related to any guarantees.
Covenants
The Bank Term Loan includes: (a) affirmative covenants which, among other things, require the Bank to remain a wholly-owned subsidiary of ours and (b) negative covenants which, among other things, restrict our and certain of our subsidiaries’ ability (subject to various exceptions) to incur liens, incur indebtedness, engage in transactions with affiliates, amend or prepay the other term loan facility (except under the limited circumstances and in the manner specified in the term loan facilities), amend the Master Agreement and enter into certain restrictive agreements. The negative covenants also restrict our ability (subject to certain exceptions) to undergo various fundamental changes (including mergers, liquidations, sale-leaseback transactions and transfers of all or substantially all of our assets).
The Bank Term Loan also contains financial covenants (to be tested on a quarterly basis) that require (i) the Company and, until the Company is subject to or elects to report under Basel III, the Bank, to maintain a minimum Tier 1 common ratio of not less than 10% (calculated in accordance with Basel I or Basel III, as applicable), (ii) the Company to maintain minimum liquidity of not less than $4.0 billion and (iii) the Bank to maintain minimum liquidity of not less than $2.0 billion. The Bank Term Loan includes customary events of default, including the occurrence of a change of control (which will not be triggered by our separation from GE) and the occurrence of certain material adverse regulatory events.
The indenture pursuant to which our senior unsecured notes have been issued includes various covenants, including covenants that restrict (subject to certain exceptions) the Company’s ability to dispose of, or incur liens on, any of the voting stock of the Bank or otherwise permit the Bank to be merged, consolidated, leased or sold in a manner that results in the Bank being less than 80% controlled by us.
If we do not satisfy any of the covenants discussed above, the maturity of amounts outstanding thereunder may be accelerated and become payable. We were in compliance with all of these covenants at June 30, 2015.
Our real estate leases also include various covenants, but typically do not include financial covenants. If we do not satisfy the covenants in the real estate leases, the leases may be terminated and we may be liable for damage claims. At June 30, 2015, we were not in default under any of our credit facilities and had not received any notices of default under any of our real estate leases.
Credit Ratings
Our borrowing costs and capacity in certain funding markets, including securitizations and senior and subordinated debt, may be affected by the credit ratings of the Company, the Bank and the ratings of our asset-backed securities.
Our senior unsecured debt is rated BBB- (stable outlook) by Fitch and BBB- (stable outlook) by S&P. In addition, certain of the asset-backed securities issued by MNT are rated by Fitch, S&P and/or Moody’s. A credit rating is not a recommendation to buy, sell or hold securities, may be subject to revision or withdrawal at any time by the assigning rating organization, and each rating should be evaluated independently of any other rating. Downgrades in these credit ratings could materially increase the cost of our funding from, and restrict our access to, the capital markets.
Liquidity
____________________________________________________________________________________________
We seek to ensure that we have adequate liquidity to sustain business operations, fund asset growth and satisfy debt obligations under normal and stress conditions.
We maintain policies outlining the overall framework and general principles for managing liquidity risk across our business, which is the responsibility of our Asset and Liability Management Committee, a subcommittee of our Enterprise Risk Management Committee. We employ a variety of metrics to monitor and manage liquidity. We perform regular liquidity stress testing and contingency planning as part of our liquidity management process. We evaluate a range of stress scenarios including Company specific and systemic events that could impact funding sources and our ability to meet liquidity needs.
We maintain a liquidity portfolio, which consists of cash and equivalents primarily in the form of deposits with the Federal Reserve Bank and short-term obligations of the U.S. Treasury. At June 30, 2015 we had $13.7 billion of liquid assets, compared to $12.9 billion of liquid assets at December 31, 2014. The increase in liquid assets was primarily due to the seasonal paydown of cardholder debt, partially offset by prepayments of long-term debt.
As a general matter, investments included in our liquidity portfolio are expected to be highly liquid, giving us the ability to readily convert them to cash. The level and composition of our liquidity portfolio may fluctuate based upon the level of expected maturities of our funding sources as well as operational requirements and market conditions.
As additional sources of liquidity, at June 30, 2015, we had an aggregate of $6.1 billion of undrawn committed capacity, subject to customary borrowing conditions, from private lenders under two of our existing securitization programs, and we had more than $25.0 billion of unencumbered assets in the Bank available to be used to generate additional liquidity through secured borrowings or asset sales or to be pledged to the Federal Reserve Board for credit at the discount window.
We will rely significantly on dividends and other distributions and payments from the Bank for liquidity; however, bank regulations, contractual restrictions and other factors limit the amount of dividends and other distributions and payments that the Bank may pay to us. For a discussion of regulatory restrictions on the Bank’s ability to pay dividends, see “Risk Factors—Risks Relating to Regulation—We may pay dividends or repurchase our common stock, which may reduce the amount of funds available to satisfy our indebtedness; the Bank is subject to restrictions that limit its ability to pay dividends to us, which could limit our ability to pay dividends or make payments on our indebtedness” and “Regulation—Savings Association Regulation—Dividends and Stock Repurchases” in our 2014 Form 10-K.
Capital
____________________________________________________________________________________________
Our primary sources of capital have been earnings generated by our businesses and existing equity capital. The proceeds from the IPO in 2014 increased our equity capital significantly. We seek to manage capital to a level and composition sufficient to support the risks of our businesses, meet regulatory requirements, adhere to rating agency targets and support future business growth. The level, composition and utilization of capital are influenced by changes in the economic environment, strategic initiatives and legislative and regulatory developments. Within these constraints, we are focused on deploying capital in a manner that will provide attractive returns to our stockholders.
In connection with our separation from GE, we filed the related application to the Federal Reserve Board on April 30, 2015. We expect to continue to increase our capital levels by, among other things, retaining net earnings and by not paying a dividend or returning capital through stock repurchases until our application to the Federal Reserve Board is approved. For a further discussion of our separation from GE, see “Item 1 Business—GE Ownership and Our Separation from GE” in our 2014 Form 10-K. As part of our capital plan, thereafter, our board of directors intends to consider our policy for paying dividends and may consider stock repurchases. We are targeting common equity Tier 1 ratios well in excess of regulatory “well-capitalized” levels.
The declaration and payment of future dividends to holders of our common stock will be at the discretion of our board of directors and will depend on many factors, including the financial condition, earnings, capital and liquidity requirements of us and the Bank, regulatory restrictions (including any restrictions that may be imposed in connection with our separation from GE), corporate law and contractual restrictions and other factors that our board of directors deems relevant. In addition, banking laws and regulations and our banking regulators may limit our ability to pay dividends and make repurchases of our stock. For a discussion of regulatory restrictions on our and the Bank’s ability to pay dividends and repurchase stock, see “Risk Factors—Risks Relating to Regulation—We may pay dividends or repurchase our common stock, which may reduce the amount of funds available to satisfy our indebtedness; the Bank is subject to restrictions that limit its ability to pay dividends to us, which could limit our ability to pay dividends or make payments on our indebtedness” in our 2014 Form 10-K. There can be no assurance that we will declare and pay any dividends or repurchase any stock in the future.
Regulatory Capital Requirements - Synchrony Financial
As a savings and loan holding company, we historically have not been required to maintain any specific amount of minimum capital. In connection with our separation from GE and the related application to the Federal Reserve Board, we expect that we will be subject to capital requirements under the applicable U.S. Basel III capital rules. For more information, see “Regulation—Savings and Loan Holding Company Regulation” in our 2014 Form 10-K.
The following table sets forth at June 30, 2015 and December 31, 2014 the composition of our capital ratios for the Company calculated under the Basel III and Basel I regulatory capital standards, respectively.
|
| | | | | | | | | | | | | | | | | | | | |
| Basel III Transition | | Basel I | | | | |
| At June 30, 2015 | | At December 31, 2014 | | Minimum to be Well- Capitalized under Prompt Corrective Action Provisions |
($ in millions) | Amount | | Ratio | | Amount | | Ratio | | Amount | | Ratio |
Total risk-based capital | $ | 11,484 |
| | 18.5 | % | | $ | 10,106 |
| | 16.2 | % | | $ | 6,199 |
| | 10.0 | % |
Tier 1 risk-based capital | $ | 10,678 |
| | 17.2 | % | | $ | 9,297 |
| | 14.9 | % | | $ | 4,959 |
| | 8.0 | % |
Tier 1 leverage | $ | 10,678 |
| | 14.6 | % | | $ | 9,297 |
| | 12.5 | % | | $ | 3,665 |
| | 5.0 | % |
Common equity Tier 1 capital | $ | 10,678 |
| | 17.2 | % | | N/A |
| | N/A |
| | $ | 4,029 |
| | 6.5 | % |
Tier 1 common equity | N/A |
| | N/A |
| | $ | 9,297 |
| | 14.9 | % | | N/A |
| | N/A |
|
|
| | | | | | | | | | | | | |
| Basel III Fully Phased-in (estimated) |
| At June 30, 2015 | | At December 31, 2014 |
($ in millions) | Amount | | Ratio | | Amount | | Ratio |
Common equity Tier 1 capital | $ | 10,347 |
| | 16.4 | % | | $ | 9,277 |
| | 14.5 | % |
We anticipate that the Company will be subject to the new U.S. Basel III regulatory capital standards. The increase in our estimated Common equity Tier 1 capital ratio, as calculated under Basel III on a fully phased-in basis, was primarily due to the retention of the Company’s net earnings for the six months ended June 30, 2015, as well as a decrease in risk-weighted assets as a result of the seasonality of our business.
Non-GAAP Measures
As a new savings and loan holding company, the Company historically has not been required by regulators to disclose capital ratios, and therefore these capital ratios are non-GAAP measures. We believe these capital ratios are useful measures to investors because they are widely used by analysts and regulators to assess the capital position of financial services companies, although our Basel I Tier 1 common ratio is not a Basel I defined regulatory capital ratio, and our Basel I common ratio and Basel III common equity Tier 1 capital ratio may not be comparable to similarly titled measures reported by other companies. Our Basel I Tier 1 common ratio is the ratio of Tier 1 common equity to total risk-weighted assets, each as calculated in accordance with the U.S. Basel I capital rules. Our Basel III common equity Tier 1 capital ratio is the ratio of common equity Tier 1 capital to total risk-weighted assets, each as calculated in accordance with the U.S. Basel III capital rules. Our Basel III capital ratios (on a fully phased-in basis) are a preliminary estimate reflecting management’s interpretation of the final Basel III capital rules adopted in July 2013 by the Federal Reserve Board, which have not been fully implemented, and our estimate and interpretations are subject to, among other things, ongoing regulatory review and implementation guidance. The following tables set forth a reconciliation of each component of our capital ratios set forth above to the comparable GAAP component at June 30, 2015 and December 31, 2014.
|
| | | | | | | |
($ in millions) | At June 30, 2015 | | At December 31, 2014 |
Equity to Tier 1 capital, Tier 1 common equity and Risk-based capital | | | |
Total equity | $ | 11,578 |
| | $ | 10,478 |
|
Unrealized (gains) / losses on investment securities | — |
| | — |
|
Disallowed goodwill and other disallowed intangible assets | (1,524 | ) | | (1,181 | ) |
| | | |
Basel I - Tier 1 capital and Tier 1 common equity | | | $ | 9,297 |
|
| | | |
Adjustments for certain other intangible assets and deferred tax liabilities | | | (20 | ) |
| | | |
Adjustments for certain deferred tax liabilities and certain items in accumulated comprehensive income (loss) | 293 |
| | |
| | | |
Basel III - Common equity Tier 1 (fully phased-in) | $ | 10,347 |
| | $ | 9,277 |
|
| | | |
Adjustments related to capital components during transition | 331 |
| | |
| | | |
Tier 1 capital and Common Tier 1 equity(1) | $ | 10,678 |
| | 9,297 |
|
| | | |
Allowance for loan losses includible in risk-based capital | 806 |
| | 809 |
|
| | | |
Risk-based capital | $ | 11,484 |
| | $ | 10,106 |
|
| | | |
| | | |
Total assets to leveraged assets | | | |
Total assets(2) | $ | 74,143 |
| | $ | 75,707 |
|
Disallowed goodwill and other disallowed intangible assets, net of related deferred tax liabilities | (903 | ) | | (1,181 | ) |
Other | 60 |
| | 79 |
|
| | | |
Total assets for leverage capital purposes(1) | $ | 73,300 |
| | $ | 74,605 |
|
| | | |
|
| | | | | | | |
| | | |
Risk-weighted assets - Basel I | N/A |
| | $ | 62,270 |
|
| | | |
Risk-weighted assets - Basel III (fully phased-in)(3) | $ | 62,970 |
| | $ | 64,162 |
|
| | | |
Risk-weighted assets - Basel III (transition)(3) | $ | 61,985 |
| | N/A |
|
| | | |
______________________
| |
(1) | Beginning June 30, 2015, regulatory capital amounts are calculated under Basel III rules, subject to transition provisions. The Company reported under Basel I rules for periods prior to June 30, 2015. |
| |
(2) | Represents total average assets at June 30, 2015 and total assets at December 31, 2014. |
| |
(3) | Key differences between Basel III transition rules and fully phased-in Basel III rules relate to the calculation of risk-weighted assets including, but not limited to, risk weighting of deferred tax assets and adjustments for certain intangible assets. |
Regulatory Capital Requirements - Synchrony Bank
At June 30, 2015 and December 31, 2014, the Bank met all applicable requirements to be deemed well-capitalized pursuant to OCC regulations and for purposes of the Federal Deposit Insurance Act. Effective January 1, 2015, the Bank became subject to the U.S. Basel III regulatory capital standards, subject to transition provisions. The following table sets forth the composition of the Bank’s capital ratios calculated under the new Basel III rules at June 30, 2015 and calculated under Basel I rules at December 31, 2014.
|
| | | | | | | | | | | | | |
| Bank | | Minimum to be Well-
Capitalized under
Prompt Corrective Action Provisions - Basel III |
At June 30, 2015 ($ in millions) | Amount | | Ratio | | Amount | | Ratio |
Common equity Tier 1 capital | $ | 7,143 |
| | 16.4 | % | | $ | 2,839 |
| | 6.5 | % |
Total risk-based capital | $ | 7,712 |
| | 17.7 | % | | $ | 4,367 |
| | 10.0 | % |
Tier 1 risk-based capital | $ | 7,143 |
| | 16.4 | % | | $ | 3,494 |
| | 8.0 | % |
Tier 1 leverage | $ | 7,143 |
| | 14.0 | % | | $ | 2,556 |
| | 5.0 | % |
|
| | | | | | | | | | | | | |
| Bank | | Minimum to be Well-
Capitalized under
Prompt Corrective Action Provisions - Basel I |
At December 31, 2014 ($ in millions) | Amount | | Ratio | | Amount | | Ratio |
Total risk-based capital | $ | 7,100 |
| | 17.1 | % | | $ | 4,152 |
| | 10.0 | % |
Tier 1 risk-based capital | $ | 6,559 |
| | 15.8 | % | | $ | 2,491 |
| | 6.0 | % |
Tier 1 leverage | $ | 6,559 |
| | 13.4 | % | | $ | 2,449 |
| | 5.0 | % |
Under the Bank’s Operating Agreement with the OCC, which it entered into on January 11, 2013 in connection with its acquisition of the deposit business of MetLife, and regulatory capital requirements adopted by the OCC, the Bank must maintain minimum levels of capital, which have historically been higher than the minimum levels required under the applicable Basel capital standards. The minimum levels of capital required under the Operating Agreement (calculated in accordance with U.S. Basel I capital rules) are as follows (i) Total risk-based capital of 11.0%; (ii) Tier 1 risk-based capital of 7.0%; and (iii) Tier 1 leverage of 6.0%. The Bank's regulatory capital was in excess of these thresholds at June 30, 2015 and December 31, 2014.
Failure to meet minimum capital requirements can result in the initiation of certain mandatory and possibly additional discretionary actions by regulators that, if undertaken, could limit our business activities and have a material adverse effect on our business, results of operations and financial condition. See “Risk Factors—Risks Relating to Regulation—Failure by Synchrony, the Bank and, until the GE SLHC Deregistration, GECC to meet applicable capital adequacy rules could have a material adverse effect on us” in our 2014 Form 10-K.
Critical Accounting Estimates
____________________________________________________________________________________________
In preparing our condensed consolidated and combined financial statements, we have identified certain accounting estimates and assumptions that we consider to be the most critical to an understanding of our financial statements because they involve significant judgments and uncertainties. The critical accounting estimates we have identified relate to allowance for loan losses, asset impairment, income taxes and fair value measurements. Many of these estimates include determining fair value. All of these estimates reflect our best judgment about current, and for some estimates future, economic and market conditions and their effects based on information available as of the date of these financial statements. If these conditions change from those expected, it is reasonably possible that these judgments and estimates could change, which may result in incremental losses on loan receivables, future impairments of investment securities, goodwill and intangible assets, and the establishment of valuation allowances on deferred tax assets and increases in our tax liabilities, among other effects. See “Management's Discussion and Analysis—Critical Accounting Estimates” in our 2014 Form 10-K, for a detailed discussion of these critical accounting estimates.
New Accounting Standards
____________________________________________________________________________________________
In May 2014, the Financial Accounting Standards Board (“FASB”) issued Accounting Standards Update (“ASU”) 2014-09, Revenue from Contracts with Customers, which requires an entity to recognize the amount of revenue to which it expects to be entitled for the transfer of promised goods or services to customers. The ASU will replace most existing revenue recognition guidance in U.S. GAAP when it becomes effective. In July 2015, the FASB approved a one-year deferral of this standard, with a revised effective date for fiscal years beginning after December 15, 2017. The standard permits the use of either the retrospective or modified retrospective (cumulative effect) transition method. We are evaluating the effect that ASU 2014-09 will have on our consolidated financial statements and related disclosures. We have not yet selected a transition method nor have we determined the effect of the standard on our ongoing financial reporting.
In April 2015, the FASB issued ASU 2015-03, Interest - Imputation of Interest. The ASU changes the financial statement presentation of debt issuance costs from being presented as an asset to a direct reduction to the carrying amount of the long-term debt. The amortization of debt issuance costs will continue to be included in interest expense. This standard is effective for annual reporting periods beginning after December 15, 2015. We are currently evaluating the effect of the ASU on our consolidated and combined financial statements.
Regulation and Supervision
____________________________________________________________________________________________
Our business, including our relationships with our customers, is subject to regulation, supervision and examination under U.S. federal, state and foreign laws and regulations. These laws and regulations cover all aspects of our business, including lending practices, treatment of our customers, safeguarding deposits, customer privacy and information security, capital structure, liquidity, dividends and other capital distributions, transactions with affiliates, and conduct and qualifications of personnel.
As a savings and loan holding company, Synchrony is subject to regulation, supervision and examination by the Federal Reserve Board. As a large provider of consumer financial services, we are also subject to regulation, supervision and examination by the CFPB. Until the GE SLHC Deregistration, we will be controlled by GECC, which is also a savings and loan holding company and is subject to regulation, supervision and examination by the Federal Reserve Board. In addition, the Financial Stability Oversight Council has designated GECC as a nonbank systemically important financial institution under the Dodd-Frank Act.
The Bank is a federally chartered savings association. As such, the Bank is subject to regulation, supervision and examination by the OCC, which is its primary regulator, and by the CFPB. In addition, the Bank, as an insured depository institution, is supervised by the FDIC.
See “Regulation” in our 2014 Form 10-K for additional information. See also “—Capital” above, for discussion of the impact of regulations and supervision on our capital and liquidity, including our ability to pay dividends and repurchase stock.
ITEM 1. FINANCIAL STATEMENTS
Synchrony Financial and subsidiaries
Condensed Consolidated and Combined Statements of Earnings
(Unaudited)
____________________________________________________________________________________________
|
| | | | | | | | | | | | | | | |
| Three months ended June 30, | | Six months ended June 30, |
($ in millions, except per share data) | 2015 | | 2014 | | 2015 | | 2014 |
Interest income: | | | | | | | |
Interest and fees on loans (Note 4) | $ | 3,166 |
| | $ | 2,920 |
| | $ | 6,306 |
| | $ | 5,848 |
|
Interest on investment securities | 11 |
| | 6 |
| | 21 |
| | 11 |
|
Total interest income | 3,177 |
| | 2,926 |
| | 6,327 |
| | 5,859 |
|
Interest expense: | | | | | | | |
Interest on deposits | 146 |
| | 109 |
| | 283 |
| | 205 |
|
Interest on borrowings of consolidated securitization entities | 53 |
| | 54 |
| | 105 |
| | 101 |
|
Interest on third-party debt | 71 |
| | — |
| | 153 |
| | — |
|
Interest on related party debt (Note 13) | — |
| | 43 |
| | 4 |
| | 90 |
|
Total interest expense | 270 |
| | 206 |
| | 545 |
| | 396 |
|
Net interest income | 2,907 |
| | 2,720 |
| | 5,782 |
| | 5,463 |
|
Retailer share arrangements | (621 | ) | | (590 | ) | | (1,281 | ) | | (1,184 | ) |
Net interest income, after retailer share arrangements | 2,286 |
| | 2,130 |
| | 4,501 |
| | 4,279 |
|
Provision for loan losses (Note 4) | 740 |
| | 681 |
| | 1,427 |
| | 1,445 |
|
Net interest income, after retailer share arrangements and provision for loan losses | 1,546 |
| | 1,449 |
| | 3,074 |
| | 2,834 |
|
Other income: | | | | | | | |
Interchange revenue | 123 |
| | 92 |
| | 223 |
| | 168 |
|
Debt cancellation fees | 61 |
| | 70 |
| | 126 |
| | 140 |
|
Loyalty programs | (94 | ) | | (63 | ) | | (172 | ) | | (106 | ) |
Other | 30 |
| | 13 |
| | 44 |
| | 25 |
|
Total other income | 120 |
| | 112 |
| | 221 |
| | 227 |
|
Other expense: | | | | | | | |
Employee costs | 250 |
| | 207 |
| | 489 |
| | 400 |
|
Professional fees | 156 |
| | 145 |
| | 318 |
| | 275 |
|
Marketing and business development | 108 |
| | 97 |
| | 190 |
| | 180 |
|
Information processing | 74 |
| | 53 |
| | 137 |
| | 105 |
|
Other | 217 |
| | 295 |
| | 417 |
| | 447 |
|
Total other expense | 805 |
| | 797 |
| | 1,551 |
| | 1,407 |
|
Earnings before provision for income taxes | 861 |
| | 764 |
| | 1,744 |
| | 1,654 |
|
Provision for income taxes (Note 12) | 320 |
| | 292 |
| | 651 |
| | 624 |
|
Net earnings | $ | 541 |
| | $ | 472 |
| | $ | 1,093 |
| | $ | 1,030 |
|
| | | | | | | |
Earnings per share | | | | | | | |
Basic | $ | 0.65 |
| | $ | 0.67 |
| | $ | 1.31 |
| | $ | 1.46 |
|
Diluted | $ | 0.65 |
| | $ | 0.67 |
| | $ | 1.31 |
| | $ | 1.46 |
|
See accompanying notes.
Synchrony Financial and subsidiaries
Condensed Consolidated and Combined Statements of Comprehensive Income
(Unaudited)____________________________________________________________________________________________
|
| | | | | | | | | | | | | | | |
| Three months ended June 30, | | Six months ended June 30, |
($ in millions) | 2015 | | 2014 | | 2015 |
| | 2014 |
|
| | | | | | | |
Net earnings | $ | 541 |
| | $ | 472 |
| | $ | 1,093 |
| | $ | 1,030 |
|
| | | | | | | |
Other comprehensive income (loss) | | | | | | | |
Investment securities | (4 | ) | | 3 |
| | (3 | ) | | 5 |
|
Currency translation adjustments | 1 |
| | — |
| | (5 | ) | | 1 |
|
Other | — |
| | — |
| | 1 |
| | — |
|
Other comprehensive income (loss) | (3 | ) | | 3 |
| | (7 | ) | | 6 |
|
| | | | | | | |
Comprehensive income | $ | 538 |
| | $ | 475 |
| | $ | 1,086 |
| | $ | 1,036 |
|
Amounts presented net of taxes.
See accompanying notes.
Synchrony Financial and subsidiaries
Condensed Consolidated Statements of Financial Position ____________________________________________________________________________________________
|
| | | | | | | |
($ in millions) | At June 30, 2015 | | At December 31, 2014 |
| (Unaudited) | | |
Assets | | | |
Cash and equivalents | $ | 10,621 |
| | $ | 11,828 |
|
Investment securities (Note 3) | 3,682 |
| | 1,598 |
|
Loan receivables: (Notes 4 and 5) | | | |
Unsecuritized loans held for investment | 36,019 |
| | 34,335 |
|
Restricted loans of consolidated securitization entities | 25,412 |
| | 26,951 |
|
Total loan receivables | 61,431 |
| | 61,286 |
|
Less: Allowance for loan losses | (3,302 | ) | | (3,236 | ) |
Loan receivables, net | 58,129 |
| | 58,050 |
|
Loan receivables held for sale (Note 4) | — |
| | 332 |
|
Goodwill | 949 |
| | 949 |
|
Intangible assets, net (Note 6) | 575 |
| | 519 |
|
Other assets(a) | 1,794 |
| | 2,431 |
|
Total assets | $ | 75,750 |
| | $ | 75,707 |
|
| | | |
Liabilities and Equity | | | |
Deposits: (Note 7) | | | |
Interest-bearing deposit accounts | $ | 37,629 |
| | $ | 34,847 |
|
Non-interest-bearing deposit accounts | 143 |
| | 108 |
|
Total deposits | 37,772 |
| | 34,955 |
|
Borrowings: (Notes 5 and 8) | | | |
Borrowings of consolidated securitization entities | 13,948 |
| | 14,967 |
|
Bank term loan | 5,151 |
| | 8,245 |
|
Senior unsecured notes | 4,593 |
| | 3,593 |
|
Related party debt (Note 13) | — |
| | 655 |
|
Total borrowings | 23,692 |
| | 27,460 |
|
Accrued expenses and other liabilities | 2,708 |
| | 2,814 |
|
Total liabilities | $ | 64,172 |
| | $ | 65,229 |
|
| | | |
Equity: | | | |
Common Stock, par share value $0.001 per share; 4,000,000,000 shares authorized, 833,764,963 and 833,764,589 shares issued and outstanding at June 30, 2015 and December 31, 2014, respectively | $ | 1 |
| | $ | 1 |
|
Additional paid-in capital | 9,422 |
| | 9,408 |
|
Retained earnings | 2,172 |
| | 1,079 |
|
Accumulated other comprehensive income (loss): | | | |
Investment securities | (3 | ) | | — |
|
Currency translation adjustments | (13 | ) | | (8 | ) |
Other | (1 | ) | | (2 | ) |
Total equity | 11,578 |
| | 10,478 |
|
Total liabilities and equity | $ | 75,750 |
| | $ | 75,707 |
|
_______________________
(a) Other assets include restricted cash and equivalents of $301 million and $1,104 million at June 30, 2015 and December 31, 2014, respectively.
See accompanying notes.
Synchrony Financial and subsidiaries
Condensed Consolidated and Combined Statements of Changes in Equity
(Unaudited)
____________________________________________________________________________________________
|
| | | | | | | | | | | | | | | | | | | | | | | | | | |
| Common Stock | | | | | | | | | | |
($ in millions, shares in thousands) | Shares | | Amount | | Additional Paid-in Capital | | Parent's Net Investment | | Retained Earnings | | Accumulated Other Comprehensive Income (Loss) | | Total Equity |
| | | | | | | | | | | | | |
Balance at January 1, 2014 | — |
| | $ | — |
| | $ | — |
| | $ | 5,973 |
| | $ | — |
| | $ | (13 | ) | | $ | 5,960 |
|
Comprehensive income: | | | | | | | | | | | | | |
Net earnings | — |
| | — |
| | — |
| | 1,030 |
| | — |
| | — |
| | 1,030 |
|
Other comprehensive income | — |
| | — |
| | — |
| | — |
| | — |
| | 6 |
| | 6 |
|
Changes in Parent's net investment | — |
| | — |
| | — |
| | (603 | ) | | — |
| | — |
| | (603 | ) |
Conversion of parent's net investment into common stock | 705,271 |
| | 1 |
| | 6,399 |
| | (6,400 | ) | | — |
| | — |
| | — |
|
Balance at June 30, 2014 | 705,271 |
| | $ | 1 |
| | $ | 6,399 |
| | $ | — |
| | $ | — |
| | $ | (7 | ) | | $ | 6,393 |
|
| | | | | | | | | | | | | |
| | | | | | | | | | | | | |
Balance at January 1, 2015 | 833,765 |
| | $ | 1 |
| | $ | 9,408 |
| | $ | — |
| | $ | 1,079 |
| | $ | (10 | ) | | $ | 10,478 |
|
Comprehensive income: | | | | | | | | | | | | | |
Net earnings | — |
| | — |
| | — |
| | — |
| | 1,093 |
| | — |
| | 1,093 |
|
Other comprehensive income | — |
| | — |
| | — |
| | — |
| | — |
| | (7 | ) | | (7 | ) |
Stock-based compensation | — |
| | — |
| | 16 |
| | — |
| | — |
| | — |
| | 16 |
|
Other | — |
| | — |
| | (2 | ) | | — |
| | — |
| | — |
| | (2 | ) |
Balance at June 30, 2015 | 833,765 |
| | $ | 1 |
| | $ | 9,422 |
| | $ | — |
| | $ | 2,172 |
| | $ | (17 | ) | | $ | 11,578 |
|
See accompanying notes.
Synchrony Financial and subsidiaries
Condensed Consolidated and Combined Statements of Cash Flows
(Unaudited)____________________________________________________________________________________________
|
| | | | | | | |
| Six months ended June 30, |
($ in millions) | 2015 | | 2014 |
Cash flows - operating activities | | | |
Net earnings | $ | 1,093 |
| | $ | 1,030 |
|
Adjustments to reconcile net earnings to cash provided from operating activities |
| |
|
Provision for loan losses | 1,427 |
| | 1,445 |
|
Deferred income taxes | 25 |
| | (58 | ) |
Depreciation and amortization | 81 |
| | 63 |
|
(Increase) decrease in interest and fees receivable | 195 |
| | 180 |
|
(Increase) decrease in other assets | (99 | ) | | 101 |
|
Increase (decrease) in accrued expenses and other liabilities | 66 |
| | 214 |
|
All other operating activities | 190 |
| | 24 |
|
Cash from (used for) operating activities | 2,978 |
| | 2,999 |
|
| | | |
Cash flows - investing activities | | | |
Maturity and redemption of investment securities | 1,034 |
| | 10 |
|
Purchases of investment securities | (3,123 | ) | | (63 | ) |
Acquisition of loan receivables | (931 | ) | | — |
|
Net (increase) decrease in restricted cash and equivalents | 803 |
| | (111 | ) |
Proceeds from sale of loan receivables | 392 |
| | — |
|
Net (increase) decrease in loan receivables | (966 | ) | | (587 | ) |
All other investing activities | (200 | ) | | (264 | ) |
Cash from (used for) investing activities | (2,991 | ) | | (1,015 | ) |
| | | |
Cash flows - financing activities | | | |
Borrowings of consolidated securitization entities | | | |
Proceeds from issuance of securitized debt | 2,175 |
| | 3,400 |
|
Maturities and repayment of securitized debt | (3,193 | ) | | (3,647 | ) |
Third-party debt | | | |
Proceeds from issuance of third-party debt | 998 |
| | — |
|
Maturities and repayment of third-party debt | (3,094 | ) | | — |
|
Related party debt | | | |
Maturities and repayment of related party debt | (655 | ) | | (1,195 | ) |
Net increase (decrease) in deposits | 2,597 |
| | 4,595 |
|
Net transfers (to) from Parent | — |
| | (603 | ) |
All other financing activities | (22 | ) | | (71 | ) |
Cash from (used for) financing activities | (1,194 | ) | | 2,479 |
|
| | | |
Increase (decrease) in cash and equivalents | (1,207 | ) | | 4,463 |
|
Cash and equivalents at beginning of period | 11,828 |
| | 2,319 |
|
Cash and equivalents at end of period | $ | 10,621 |
| | $ | 6,782 |
|
See accompanying notes.
Synchrony Financial and subsidiaries
Notes to Condensed Consolidated and Combined Financial Statements (Unaudited)
____________________________________________________________________________________________
NOTE 1. BUSINESS DESCRIPTION
Synchrony Financial (the “Company”) provides a range of credit products through programs it has established with a diverse group of national and regional retailers, local merchants, manufacturers, buying groups, industry associations and healthcare service providers. The Company is a holding company for the legal entities that historically conducted General Electric Company’s (“GE”) North American retail finance business, including GE Capital Retail Bank. Prior to the Company’s initial public offering of its common stock (the “IPO”), which closed on August 5, 2014, the Company was indirectly wholly-owned by General Electric Capital Corporation (“GECC” or “Parent”). Following the IPO, GE owned, and currently owns, approximately 84.6% of our common stock. We conduct our operations through a single business segment.
References to the “Company”, “we”, “us” and “our” are to Synchrony Financial and its combined and consolidated subsidiaries unless the context otherwise requires.
NOTE 2. BASIS OF PRESENTATION AND SUMMARY OF SIGNIFICANT ACCOUNTING POLICIES
Basis of Presentation
The accompanying condensed consolidated and combined financial statements were prepared in conformity with U.S. generally accepted accounting principles (“GAAP”).
Preparing financial statements in conformity with U.S. GAAP requires us to make estimates based on assumptions about current, and for some estimates future, economic and market conditions (for example, unemployment, housing, interest rates and market liquidity) which affect reported amounts and related disclosures in our condensed consolidated and combined financial statements. Although our current estimates contemplate current conditions and how we expect them to change in the future, as appropriate, it is reasonably possible that actual conditions could be different than anticipated in those estimates, which could materially affect our results of operations and financial position. Among other effects, such changes could result in incremental losses on loan receivables, future impairments of investment securities, goodwill and intangible assets, increases in reserves for contingencies, establishment of valuation allowances on deferred tax assets and increases in our tax liabilities.
We conduct our operations within the United States and Canada. Substantially all of our revenues are from U.S. customers. The operating activities conducted by our non-U.S. affiliates use the local currency as their functional currency. The effects of translating the financial statements of these non-U.S. affiliates to U.S. dollars are included in equity. Asset and liability accounts are translated at year-end exchange rates, while revenues and expenses are translated at average rates for the respective periods.
Consolidated Basis of Presentation
The transfer of all of the assets of our business from GECC and its subsidiaries to the Company was completed in the second quarter of 2014. As a result, the Company’s financial statements have been prepared on a consolidated basis beginning June 30, 2014. Under this basis of presentation, our financial statements consolidate all of our subsidiaries – i.e., entities in which we have a controlling financial interest, most often because we hold a majority voting interest. In addition, all periods subsequent to June 30, 2014 are presented on a consolidated basis.
To determine if we hold a controlling financial interest in an entity, we first evaluate if we are required to apply the variable interest entity (“VIE”) model to the entity, otherwise the entity is evaluated under the voting interest model. Where we hold current or potential rights that give us the power to direct the activities of a VIE that most significantly impact the VIE’s economic performance (“power”) combined with a variable interest that gives us the right to receive potentially significant benefits or the obligation to absorb potentially significant losses (“significant economics”), we have a controlling financial interest in that VIE. Rights held by others to remove the party with power over the VIE are not considered unless one party can exercise those rights unilaterally. We consolidate certain securitization entities under the VIE model because we have both power and significant economics. See Note 5. Variable Interest Entities.
Combined Basis of Presentation
For all periods prior to June 30, 2014, the Company's financial statements were prepared on a combined basis. The combined financial statements combine all of our subsidiaries and certain accounts of GECC and its subsidiaries that were historically managed as part of our business.
For all periods prior to the IPO, the Condensed Consolidated and Combined Statements of Earnings reflect intercompany expense allocations made to us by GE and GECC for certain corporate functions and for shared services provided by GE and GECC. Where possible, these allocations were made on a specific identification basis, and in other cases, these expenses were allocated by GE and GECC based on relative percentages of net operating costs or some other basis depending on the nature of the allocated cost. See Note 13. Related Party Transactions for further information on expenses allocated by GE and GECC.
The historical financial results in the condensed consolidated and combined financial statements presented may not be indicative of the results that would have been achieved had we operated as a separate, standalone entity during those periods. We believe that the condensed consolidated and combined financial statements include all adjustments necessary for a fair presentation of the Company.
Interim Period Presentation
The condensed consolidated and combined financial statements and notes thereto are unaudited. These statements include all adjustments (consisting of normal recurring accruals) that we considered necessary to present a fair statement of our results of operations, financial position and cash flows. The results reported in these condensed consolidated and combined financial statements should not be considered as necessarily indicative of results that may be expected for the entire year. These condensed consolidated and combined financial statements should be read in conjunction with our 2014 annual consolidated and combined financial statements and the related notes in our Annual Report on Form 10-K for the year ended December 31, 2014 (our "2014 Form 10-K"). Effective for the first quarter of 2015 and subsequent interim periods, the Company is following a calendar quarter. Previously, it was the longstanding practice of GE and GECC, our parent companies, to establish interim quarterly closing dates using a fiscal calendar, which required our business to close its books on a Sunday. We label our quarterly information using a calendar convention, that is, first quarter is labeled as ending on March 31, second quarter as ending on June 30, and third quarter as ending on September 30.
We have reclassified certain prior-period amounts to conform to current-period presentation.
Summary of Significant Accounting Policies
See Note 2. Basis of Presentation and Summary of Significant Accounting Policies to our 2014 annual consolidated and combined financial statements in our 2014 Form 10-K, for additional information on our significant accounting policies.
NOTE 3. INVESTMENT SECURITIES
All of our investment securities are classified as available-for-sale and are held to meet our liquidity objectives or to comply with the Community Reinvestment Act. Our investment securities consist of the following:
|
| | | | | | | | | | | | | | | | | | | | | | | | | | | | | | | |
| June 30, 2015 | | December 31, 2014 |
| | | Gross |
| | Gross |
| | | | | | Gross |
| | Gross |
| | |
| Amortized |
| | unrealized |
| | unrealized |
| | Estimated |
| | Amortized |
| | unrealized |
| | unrealized |
| | Estimated |
|
($ in millions) | cost |
| | gains |
| | losses |
| | fair value |
| | cost |
| | gains |
| | losses |
| | fair value |
|
Debt | | | | | | | | | | | | | | | |
U.S. government and federal agency | $ | 3,273 |
| | $ | 1 |
| | $ | — |
| | $ | 3,274 |
| | $ | 1,252 |
| | $ | — |
| | $ | — |
| | $ | 1,252 |
|
State and municipal | 55 |
| | 1 |
| | (2 | ) | | 54 |
| | 57 |
| | 1 |
| | (1 | ) | | 57 |
|
Residential mortgage-backed(a) | 344 |
| | 2 |
| | (7 | ) | | 339 |
| | 271 |
| | 3 |
| | (3 | ) | | 271 |
|
U.S. corporate debt | — |
| | — |
| | — |
| | — |
| | 3 |
| | — |
| | — |
| | 3 |
|
Equity | 15 |
| | — |
| | — |
| | 15 |
| | 15 |
| | — |
| | — |
| | 15 |
|
Total | $ | 3,687 |
| | $ | 4 |
| | $ | (9 | ) | | $ | 3,682 |
| | $ | 1,598 |
| | $ | 4 |
| | $ | (4 | ) | | $ | 1,598 |
|
_______________________
| |
(a) | At June 30, 2015 and December 31, 2014 all of our residential mortgage-backed securities related to securities issued by government-sponsored entities and are pledged by the Bank as collateral to the Federal Reserve to secure Federal Reserve Discount Window advances. All residential mortgage-backed securities are collateralized by U.S. mortgages. |
The following table presents the estimated fair values and gross unrealized losses of our available-for-sale investment securities:
|
| | | | | | | | | | | | | | | |
| In loss position for |
| Less than 12 months | | 12 months or more |
| | | Gross |
| | | | Gross |
|
| Estimated |
| | unrealized |
| | Estimated |
| | unrealized |
|
($ in millions) | fair value |
| | losses |
| | fair value |
| | losses |
|
At June 30, 2015 | | | | | | | |
Debt | | | | | | | |
U.S. government and federal agency | $ | 278 |
| | $ | — |
| | $ | — |
| | $ | — |
|
State and municipal | 35 |
| | (2 | ) | | 7 |
| | — |
|
Residential mortgage-backed | 197 |
| | (3 | ) | | 66 |
| | (4 | ) |
Total | $ | 510 |
| | $ | (5 | ) | | $ | 73 |
| | $ | (4 | ) |
| | | | | | | |
At December 31, 2014 | | | | | | | |
Debt | | | | | | | |
U.S. government and federal agency | $ | 700 |
| | $ | — |
| | $ | — |
| | $ | — |
|
State and municipal | — |
| | — |
| | 34 |
| | (1 | ) |
Residential mortgage-backed | 30 |
| | — |
| | 85 |
| | (3 | ) |
Total | $ | 730 |
| | $ | — |
| | $ | 119 |
| | $ | (4 | ) |
At June 30, 2015, none of our equity securities were in a gross unrealized loss position. We regularly review investment securities for impairment using both qualitative and quantitative criteria. We presently do not intend to sell our debt securities that are in an unrealized loss position and believe that it is not more likely than not that we will be required to sell these securities before recovery of our amortized cost.
There were no other-than-temporary impairments recognized for the three and six months ended June 30, 2015 and 2014.
Contractual Maturities of Investments in Available-for-Sale Debt Securities (excluding residential mortgage-backed securities)
|
| | | | | | | |
| Amortized |
| | Estimated |
|
At June 30, 2015 ($ in millions) | cost |
| | fair value |
|
| | | |
Due | | | |
Within one year | $ | 1,875 |
| | $ | 1,875 |
|
After one year through five years | $ | 1,398 |
| | $ | 1,399 |
|
After five years through ten years | $ | 1 |
| | $ | 1 |
|
After ten years | $ | 54 |
| | $ | 53 |
|
We expect actual maturities to differ from contractual maturities because borrowers have the right to prepay certain obligations.
There were no material realized gains or losses recognized for the three and six months ended June 30, 2015 and 2014.
Although we generally do not have the intent to sell any specific securities held at June 30, 2015, in the ordinary course of managing our investment securities portfolio, we may sell securities prior to their maturities for a variety of reasons, including diversification, credit quality, yield, liquidity requirements and funding obligations.
NOTE 4. LOAN RECEIVABLES AND ALLOWANCE FOR LOAN LOSSES
|
| | | | | | | |
($ in millions) | June 30, 2015 | | December 31, 2014 |
| | | |
Credit cards | $ | 58,827 |
| | $ | 58,880 |
|
Consumer installment loans | 1,138 |
| | 1,063 |
|
Commercial credit products | 1,410 |
| | 1,320 |
|
Other | 56 |
| | 23 |
|
Total loan receivables, before allowance for losses(a)(b) | $ | 61,431 |
| | $ | 61,286 |
|
_______________________
| |
(a) | Total loan receivables include $25.4 billion and $27.0 billion of restricted loans of consolidated securitization entities at June 30, 2015 and December 31, 2014, respectively. See Note 5. Variable Interest Entities for further information on these restricted loans. |
| |
(b) | At June 30, 2015 and December 31, 2014, loan receivables included deferred expense, net of deferred income, of $20 million and $46 million, respectively. |
Disposition of Loan Receivables
In the fourth quarter of 2014 and first quarter of 2015, we entered into agreements to sell certain credit card portfolios associated with two retail partners whose program agreements with us were not extended beyond their contractual expiration dates in 2015. These portfolios were classified as loan receivables held for sale in our Condensed Consolidated Statement of Financial Position. In the second quarter of 2015, we sold these portfolios for total proceeds of $392 million and recognized a pre-tax gain of $20 million within other income in our Condensed Consolidated and Combined Statement of Earnings.
Allowance for Loan Losses
|
| | | | | | | | | | | | | | | | | | | |
($ in millions) | Balance at April 1, 2015 |
| | Provision charged to operations |
| | Gross charge-offs |
| | Recoveries |
| | Balance at June 30, 2015 |
|
| | | | | | | | | |
Credit cards | $ | 3,184 |
| | $ | 723 |
| | $ | (814 | ) | | $ | 136 |
| | $ | 3,229 |
|
Consumer installment loans | 24 |
| | 2 |
| | (7 | ) | | 4 |
| | 23 |
|
Commercial credit products | 47 |
| | 14 |
| | (13 | ) | | 1 |
| | 49 |
|
Other | — |
| | 1 |
| | — |
| | — |
| | $ | 1 |
|
Total | $ | 3,255 |
| | $ | 740 |
| | $ | (834 | ) | | $ | 141 |
| | $ | 3,302 |
|
|
| | | | | | | | | | | | | | | | | | | |
($ in millions) | Balance at April 1, 2014 |
| | Provision charged to operations |
| | Gross charge-offs |
| | Recoveries |
| | Balance at June 30, 2014 |
|
| | | | | | | | | |
Credit cards | $ | 2,935 |
| | $ | 662 |
| (a) | $ | (792 | ) | | $ | 134 |
| | $ | 2,939 |
|
Consumer installment loans | 17 |
| | 7 |
| | (7 | ) | | 3 |
| | 20 |
|
Commercial credit products | 46 |
| | 12 |
| | (13 | ) | | 2 |
| | 47 |
|
Total | $ | 2,998 |
| | $ | 681 |
| | $ | (812 | ) | | $ | 139 |
| | $ | 3,006 |
|
|
| | | | | | | | | | | | | | | | | | | |
($ in millions) | Balance at January 1, 2015 |
| | Provision charged to operations |
| | Gross charge-offs |
| | Recoveries |
| | Balance at June 30, 2015 |
|
| | | | | | | | | |
Credit cards | $ | 3,169 |
| | $ | 1,392 |
| | $ | (1,648 | ) | | $ | 316 |
| | $ | 3,229 |
|
Consumer installment loans | 22 |
| | 9 |
| | (16 | ) | | 8 |
| | 23 |
|
Commercial credit products | 45 |
| | 25 |
| | (24 | ) | | 3 |
| | 49 |
|
Other | — |
| | 1 |
| | — |
| | — |
| | $ | 1 |
|
Total | $ | 3,236 |
| | $ | 1,427 |
| | $ | (1,688 | ) | | $ | 327 |
| | $ | 3,302 |
|
|
| | | | | | | | | | | | | | | | | | | |
($ in millions) | Balance at January 1, 2014 |
| | Provision charged to operations |
| | Gross charge-offs |
| | Recoveries |
| | Balance at June 30, 2014 |
|
| | | | | | | | | |
Credit cards | $ | 2,827 |
| | $ | 1,414 |
| (a) | $ | (1,573 | ) | | $ | 271 |
| | $ | 2,939 |
|
Consumer installment loans | 19 |
| | 9 |
| | (14 | ) | | 6 |
| | 20 |
|
Commercial credit products | 46 |
| | 22 |
| | (25 | ) | | 4 |
| | 47 |
|
Total | $ | 2,892 |
| | $ | 1,445 |
| | $ | (1,612 | ) | | $ | 281 |
| | $ | 3,006 |
|
______________________
| |
(a) | Includes a $57 million reduction in provision for loan losses associated with the classification of certain loan receivables as held for sale. |
Delinquent and Non-accrual Loans
|
| | | | | | | | | | | | | | | | | | | |
At June 30, 2015 ($ in millions) | 30-89 days delinquent |
| | 90 or more days delinquent |
| | Total Past Due |
| | 90 or more days delinquent and accruing |
| | Total non-accruing |
|
| | | | | | | | | |
Credit cards | $ | 1,200 |
| | $ | 919 |
| | $ | 2,119 |
| | $ | 919 |
| | $ | — |
|
Consumer installment loans | 12 |
| | 2 |
| | 14 |
| | — |
| | 2 |
|
Commercial credit products | 26 |
| | 12 |
| | 38 |
| | 12 |
| | — |
|
Total delinquent loans | $ | 1,238 |
| | $ | 933 |
| | $ | 2,171 |
| | $ | 931 |
| | $ | 2 |
|
Percentage of total loan receivables(a) | 2.0 | % | | 1.5 | % | | 3.5 | % | | 1.5 | % | | — | % |
|
| | | | | | | | | | | | | | | | | | | |
At December 31, 2014 ($ in millions) | 30-89 days delinquent |
| | 90 or more days delinquent |
| | Total Past Due |
| | 90 or more days delinquent and accruing |
| | Total non-accruing |
|
| | | | | | | | | |
Credit cards | $ | 1,331 |
| | $ | 1,147 |
| | $ | 2,478 |
| | $ | 1,147 |
| | $ | — |
|
Consumer installment loans | 15 |
| | 2 |
| | 17 |
| | — |
| | 2 |
|
Commercial credit products | 28 |
| | 13 |
| | 41 |
| | 13 |
| | — |
|
Total delinquent loans | $ | 1,374 |
| | $ | 1,162 |
| | $ | 2,536 |
| | $ | 1,160 |
| | $ | 2 |
|
Percentage of total loan receivables(a) | 2.2 | % | | 1.9 | % | | 4.1 | % | | 1.9 | % | | — | % |
| |
(a) | Percentages are calculated based on period-end balances. |
Impaired Loans and Troubled Debt Restructurings
Most of our non-accrual loan receivables are smaller balance loans evaluated collectively, by portfolio, for impairment and therefore are outside the scope of the disclosure requirements for impaired loans. Accordingly, impaired loans represent restructured smaller balance homogeneous loans meeting the definition of a Troubled Debt Restructuring (“TDR”). We use certain loan modification programs for borrowers experiencing financial difficulties. These loan modification programs include interest rate reductions and payment deferrals in excess of three months, which were not part of the terms of the original contract.
We have both internal and external loan modification programs. The internal loan modification programs include both temporary and permanent programs. For our credit card customers, the temporary hardship program primarily consists of a reduced minimum payment and an interest rate reduction, both lasting for a period no longer than 12 months. The permanent workout program involves changing the structure of the loan to a fixed payment loan with a maturity no longer than 60 months and reducing the interest rate on the loan. The permanent program does not normally provide for the forgiveness of unpaid principal, but may allow for the reversal of certain unpaid interest or fee assessments. We also make loan modifications for customers who request financial assistance through external sources, such as consumer credit counseling agency programs. These loans typically receive a reduced interest rate but continue to be subject to the original minimum payment terms and do not normally include waiver of unpaid principal, interest or fees. The following table provides information on loans that entered a loan modification program during the periods presented:
|
| | | | | | | | | | | | | | | |
| Three months ended June 30, | | Six months ended June 30, |
($ in millions) | 2015 | | 2014 | | 2015 | | 2014 |
Credit cards | $ | 109 |
| | $ | 97 |
| | $ | 227 |
| | $ | 204 |
|
Consumer installment loans | — |
| | — |
| | — |
| | — |
|
Commercial credit products | 1 |
| | — |
| | 3 |
| | 2 |
|
Total | $ | 110 |
| | $ | 97 |
| | $ | 230 |
| | $ | 206 |
|
Loans classified as TDRs are recorded at their present value with impairment measured as the difference between the loan balance and the discounted present value of cash flows expected to be collected, discounted at the original effective interest rate of the loan. Our allowance for loan losses on TDRs is generally measured based on the difference between the recorded loan receivable and the present value of the expected future cash flows. Interest income from loans accounted for as TDRs is accounted for in the same manner as other accruing loans.
The following table provides information about loans classified as TDRs and specific reserves. We do not evaluate credit card loans for impairment on an individual basis, but instead estimate an allowance for loan losses on a collective basis. As a result, there are no impaired loans for which there is no allowance.
|
| | | | | | | | | | | | | | | |
At June 30, 2015 ($ in millions) | Total recorded investment |
| | Related allowance |
| | Net recorded investment |
| | Unpaid principal balance |
|
Credit cards | $ | 712 |
| | $ | (235 | ) | | $ | 477 |
| | $ | 618 |
|
Consumer installment loans | — |
| | — |
| | — |
| | — |
|
Commercial credit products | 7 |
| | (3 | ) | | 4 |
| | 8 |
|
Total | $ | 719 |
| | $ | (238 | ) | | $ | 481 |
| | $ | 626 |
|
|
| | | | | | | | | | | | | | | |
At December 31, 2014 ($ in millions) | Total recorded investment |
| | Related allowance |
| | Net recorded investment |
| | Unpaid principal balance |
|
Credit cards | $ | 716 |
| | $ | (217 | ) | | $ | 499 |
| | $ | 613 |
|
Consumer installment loans | — |
| | — |
| | — |
| | — |
|
Commercial credit products | 8 |
| | (3 | ) | | 5 |
| | 8 |
|
Total | $ | 724 |
| | $ | (220 | ) | | $ | 504 |
| | $ | 621 |
|
Financial Effects of TDRs
As part of our loan modifications for borrowers experiencing financial difficulty, we may provide multiple concessions to minimize our economic loss and improve long-term loan performance and collectability. The following table presents the types and financial effects of loans modified and accounted for as TDRs during the periods presented:
|
| | | | | | | | | | | | | | | | | | | |
Three months ended June 30, | 2015 | | 2014 |
($ in millions) | Interest income recognized during period when loans were impaired |
| Interest income that would have been recorded with original terms |
| Average recorded investment |
| | Interest income recognized during period when loans were impaired |
| Interest income that would have been recorded with original terms |
| Average recorded investment |
|
Credit cards | $ | 12 |
| $ | 36 |
| $ | 715 |
| | $ | 14 |
| $ | 35 |
| $ | 749 |
|
Consumer installment loans | — |
| — |
| — |
| | — |
| — |
| — |
|
Commercial credit products | — |
| 1 |
| 8 |
| | — |
| 1 |
| 11 |
|
Total | $ | 12 |
| $ | 37 |
| $ | 723 |
| | $ | 14 |
| $ | 36 |
| $ | 760 |
|
|
| | | | | | | | | | | | | | | | | | | |
Six months ended June 30, | 2015 | | 2014 |
($ in millions) | Interest income recognized during period when loans were impaired |
| Interest income that would have been recorded with original terms |
| Average recorded investment |
| | Interest income recognized during period when loans were impaired |
| Interest income that would have been recorded with original terms |
| Average recorded investment |
|
Credit cards | $ | 25 |
| $ | 72 |
| $ | 715 |
| | $ | 29 |
| $ | 71 |
| $ | 766 |
|
Consumer installment loans | — |
| — |
| — |
| | — |
| — |
| — |
|
Commercial credit products | — |
| 1 |
| 8 |
| | — |
| 1 |
| 11 |
|
Total | $ | 25 |
| $ | 73 |
| $ | 723 |
| | $ | 29 |
| $ | 72 |
| $ | 777 |
|
Payment Defaults
The following table presents the type, number and amount of loans accounted for as TDRs that enrolled in a modification plan within the previous 12 months and experienced a payment default during the periods presented. A customer defaults from a modification program after two consecutive missed payments.
|
| | | | | | | | | | | | | |
Three months ended June 30, | 2015 | | 2014 |
($ in millions) | Accounts defaulted |
| | Loans defaulted |
| | Accounts defaulted |
| | Loans defaulted |
|
Credit cards | 10,956 |
| | $ | 21 |
| | 12,943 |
| | $ | 25 |
|
Consumer installment loans | — |
| | — |
| | — |
| | — |
|
Commercial credit products | 29 |
| | — |
| | 57 |
| | 1 |
|
Total | 10,985 |
| | $ | 21 |
| | 13,000 |
| | $ | 26 |
|
|
| | | | | | | | | | | | | |
Six months ended June 30, | 2015 | | 2014 |
($ in millions) | Accounts defaulted |
| | Loans defaulted |
| | Accounts defaulted |
| | Loans defaulted |
|
Credit cards | 17,785 |
| | $ | 35 |
| | 24,944 |
| | $ | 49 |
|
Consumer installment loans | — |
| | — |
| | — |
| | — |
|
Commercial credit products | 56 |
| | — |
| | 105 |
| | 1 |
|
Total | 17,841 |
| | $ | 35 |
| | 25,049 |
| | $ | 50 |
|
Credit Quality Indicators
Our loan receivables portfolio includes both secured and unsecured loans. Secured loan receivables are largely comprised of consumer installment loans secured by equipment. Unsecured loan receivables are largely comprised of our open-ended revolving credit card and commercial loans. As part of our credit risk management activities, on an ongoing basis, we assess overall credit quality by reviewing information related to the performance of a customer’s account with us, as well as information from credit bureaus, such as a Fair Isaac Corporation (“FICO”) or other credit scores, relating to the customer’s broader credit performance. FICO scores are generally obtained at origination of the account and are refreshed, at a minimum quarterly, but could be as often as weekly, to assist in predicting customer behavior. We categorize these credit scores into the following three credit score categories: (i) 661 or higher, which are considered the strongest credits; (ii) 601 to 660, considered moderate credit risk; and (iii) 600 or less, which are considered weaker credits. There are certain customer accounts for which a FICO score is not available where we use alternative sources to assess their credit and predict behavior. The following table provides the most recent FICO scores available for our customers at June 30, 2015 and December 31, 2014, respectively, as a percentage of each class of loan receivable. The table below excludes 0.7% and 0.8% of our total loan receivables balance at June 30, 2015 and December 31, 2014, respectively, which represents those customer accounts for which a FICO score is not available.
|
| | | | | | | | | | | | | | | | | |
| June 30, 2015 | | December 31, 2014 |
| 661 or |
| | 601 to |
| | 600 or |
| | 661 or |
| | 601 to |
| | 600 or |
|
| higher |
| | 660 |
| | less |
| | higher |
| | 660 |
| | less |
|
| | | | | | | | | | | |
Credit cards | 73.4 | % | | 19.6 | % | | 7.0 | % | | 72.5 | % | | 19.9 | % | | 7.6 | % |
Consumer installment loans | 79.0 | % | | 16.0 | % | | 5.0 | % | | 78.9 | % | | 15.7 | % | | 5.4 | % |
Commercial credit products | 86.3 | % | | 9.0 | % | | 4.7 | % | | 86.5 | % | | 8.6 | % | | 4.8 | % |
Unfunded Lending Commitments
We manage the potential risk in credit commitments by limiting the total amount of credit, both by individual customer and in total, by monitoring the size and maturity of our portfolios and by applying the same credit standards for all of our credit products. Unused credit card lines available to our customers totaled approximately $308 billion and $297 billion at June 30, 2015 and December 31, 2014, respectively. While these amounts represented the total available unused credit card lines, we have not experienced and do not anticipate that all of our customers will access their entire available line at any given point in time.
Interest Income by Product
The following table provides additional information about our interest and fees on loans from our loan receivables, including held for sale:
|
| | | | | | | | | | | | | | | |
| Three months ended June 30, | | Six months ended June 30, |
($ in millions) | 2015 | | 2014 | | 2015 | | 2014 |
Credit cards | $ | 3,106 |
| | $ | 2,860 |
| | $ | 6,185 |
| | $ | 5,727 |
|
Consumer installment loans | 26 |
| | 24 |
| | 51 |
| | 47 |
|
Commercial credit products | 34 |
| | 36 |
| | 70 |
| | 74 |
|
Other | — |
| | — |
| | — |
| | — |
|
Total | $ | 3,166 |
| | $ | 2,920 |
| | $ | 6,306 |
| | $ | 5,848 |
|
NOTE 5. VARIABLE INTEREST ENTITIES
We use VIEs to securitize loans and arrange asset-backed financing in the ordinary course of business. Investors in these entities only have recourse to the assets owned by the entity and not to our general credit. We do not have implicit support arrangements with any VIE and we did not provide non-contractual support for previously transferred loan receivables to any VIE in the three and six months ended June 30, 2015 and 2014. Our VIEs are able to accept new loan receivables and arrange new asset-backed financings, consistent with the requirements and limitations on such activities placed on the VIE by existing investors. Once an account has been designated to a VIE, the contractual arrangements we have require all existing and future loans originated under such account to be transferred to the VIE. The amount of loan receivables held by our VIEs in excess of the minimum amount required under the asset-backed financing arrangements with investors may be removed by us under random removal of accounts provisions. All loan receivables held by a VIE are subject to claims of third-party investors.
In evaluating whether we have the power to direct the activities of a VIE that most significantly impact its economic performance, we consider the purpose for which the VIE was created, the importance of each of the activities in which it is engaged and our decision-making role, if any, in those activities that significantly determine the entity’s economic performance as compared to other economic interest holders. This evaluation requires consideration of all facts and circumstances relevant to decision-making that affects the entity’s future performance and the exercise of professional judgment in deciding which decision-making rights are most important.
In determining whether we have the right to receive benefits or the obligation to absorb losses that could potentially be significant to a VIE, we evaluate all of our economic interests in the entity, regardless of form (debt, equity, management and servicing fees, and other contractual arrangements). This evaluation considers all relevant factors of the entity’s design, including: the entity’s capital structure, contractual rights to earnings or losses, subordination of our interests relative to those of other investors, as well as any other contractual arrangements that might exist that could have the potential to be economically significant. The evaluation of each of these factors in reaching a conclusion about the potential significance of our economic interests is a matter that requires the exercise of professional judgment.
We consolidate our VIEs because we have the power to direct the activities that significantly affect the VIEs' economic performance, typically because of our role as either servicer or administrator for the VIEs. The power to direct exists because of our role in the design and conduct of the servicing of the VIEs’ assets as well as directing certain affairs of the VIEs, including determining whether and on what terms debt of the VIEs will be issued.
The loan receivables in these entities have risks and characteristics similar to our other financing receivables and were underwritten to the same standard. Accordingly, the performance of these assets has been similar to our other comparable loan receivables; however, the blended performance of the pools of receivables in these entities reflects the eligibility criteria that we apply to determine which receivables are selected for transfer. Contractually, the cash flows from these financing receivables must first be used to pay third-party debt holders, as well as other expenses of the entity. Excess cash flows, if any, are available to us. The creditors of these entities have no claim on our other assets.
The table below summarizes the assets and liabilities of our consolidated securitization VIEs described above.
|
| | | | | | | |
($ in millions) | June 30, 2015 |
| | December 31, 2014 |
|
Assets | | | |
Loan receivables, net(a) | $ | 24,199 |
| | $ | 25,645 |
|
Other assets(b) | 221 |
| | 1,134 |
|
Total | $ | 24,420 |
| | $ | 26,779 |
|
| | | |
Liabilities | | | |
Borrowings | $ | 13,948 |
| | $ | 14,967 |
|
Other liabilities | 51 |
| | 368 |
|
Total | $ | 13,999 |
| | $ | 15,335 |
|
| |
(a) | Includes $1.2 billion and $1.3 billion of related allowance for loan losses resulting in gross restricted loans of $25.4 billion and $27.0 billion at June 30, 2015 and December 31, 2014, respectively. |
| |
(b) | Includes $117 million and $1.0 billion of segregated funds held by the VIEs at June 30, 2015 and December 31, 2014, respectively, which are classified as restricted cash and equivalents and included as a component of other assets in our Condensed Consolidated Statement of Financial Position. |
The balances presented above are net of intercompany balances and transactions that are eliminated in our condensed consolidated and combined financial statements.
We provide servicing for all of our VIEs except one for which GECC provides servicing. Collections are required to be placed into segregated accounts owned by each VIE in amounts that meet contractually specified minimum levels. These segregated funds are invested in cash and cash equivalents and are restricted as to their use, principally to pay maturing principal and interest on debt and the related servicing fees. Collections above these minimum levels are remitted to us on a daily basis.
For one of our VIEs, GECC is the servicer and we are the subservicer. At June 30, 2015 and December 31, 2014, in our capacity as a subservicer, we temporarily held $78 million and $75 million, respectively, of VIE collections which are reflected in our Condensed Consolidated Statements of Financial Position within our other liabilities as amounts payable to GECC. The VIE reflected corresponding amounts as receivables due from GECC within other assets. In addition, at June 30, 2015 and December 31, 2014, we were owed $33 million and $36 million, respectively, related to unpaid subservicing fees, which is reflected in our Condensed Consolidated Statements of Financial Position within other assets as a receivable due from GECC. The VIE reflected corresponding amounts as payable to GECC within other liabilities.
Income (principally, interest and fees on loans) earned by our consolidated VIEs was $1.2 billion for both the three months ended June 30, 2015 and 2014. Related expenses consisted primarily of provision for loan losses of $310 million and $253 million for the three months ended June 30, 2015 and 2014, respectively, and interest expense of $53 million and $54 million for the three months ended June 30, 2015 and 2014, respectively. Income (principally, interest and fees on loans) earned by our consolidated VIEs was $2.5 billion for both the six months ended June 30, 2015 and 2014. Related expenses consisted primarily of provisions for loan losses of $522 million and $546 million for the six months ended June 30, 2015 and 2014, respectively, and interest expense of $105 million and $101 million for the six months ended June 30, 2015 and 2014, respectively. These amounts do not include intercompany transactions, principally fees and interest, which are eliminated in our condensed consolidated and combined financial statements.
NOTE 6. INTANGIBLE ASSETS
|
| | | | | | | | | | | | | | | | | | | | | | | |
| June 30, 2015 | | December 31, 2014 |
($ in millions) | Gross carrying amount |
| | Accumulated amortization |
| | Net |
| | Gross carrying amount |
| | Accumulated amortization |
| | Net |
|
Customer-related | $ | 928 |
| | $ | (454 | ) | | $ | 474 |
| | $ | 849 |
| | $ | (405 | ) | | $ | 444 |
|
Capitalized software | 164 |
| | (63 | ) | | 101 |
| | 120 |
| | (45 | ) | | 75 |
|
Total | $ | 1,092 |
| | $ | (517 | ) | | $ | 575 |
| | $ | 969 |
| | $ | (450 | ) | | $ | 519 |
|
During the six months ended June 30, 2015, we recorded net additions to intangible assets subject to amortization of $123 million, primarily related to payments made to acquire customer relationships or extend retail partner relationships, as well as capitalized software expenditures related to the build of our standalone information technology infrastructure.
Amortization expense related to retail partner contracts was $22 million and $18 million for the three months ended June 30, 2015 and 2014, respectively, and $42 million and $37 million for the six months ended June 30, 2015 and 2014, respectively, and is included as a component of marketing and business development expense in our Condensed Consolidated and Combined Statements of Earnings. All other amortization expense was $16 million and $7 million for the three months ended June 30, 2015 and 2014, respectively, and $25 million and $13 million for the six months ended June 30, 2015 and 2014, respectively, and is included as a component of other expense in our Condensed Consolidated and Combined Statements of Earnings.
NOTE 7. DEPOSITS
Deposits
|
| | | | | | | | | | | | | |
| June 30, 2015 | | December 31, 2014 |
($ in millions) | Amount | | Average rate(a) | | Amount | | Average rate(a) |
| | | | | | | |
Interest-bearing deposits | $ | 37,629 |
| | 1.6 | % | | $ | 34,847 |
| | 1.6 | % |
Non-interest-bearing deposits | 143 |
| | — |
| | 108 |
| | — |
|
Total deposits | $ | 37,772 |
| | | | $ | 34,955 |
| | |
____________________
| |
(a) | Based on interest expense for the six months ended June 30, 2015 and the year ended December 31, 2014 and average deposits balances. |
At June 30, 2015 and December 31, 2014, interest-bearing deposits included $10.8 billion and $9.4 billion, respectively, of direct deposit certificates of $100,000 or more. At June 30, 2015, our interest-bearing time deposits maturing for the remainder of 2015 and over the next four years and thereafter were as follows:
|
| | | | | | | | | | | | | | | | | | | | | | | |
($ in millions) | 2015 |
| | 2016 |
| | 2017 |
| | 2018 |
| | 2019 |
| | Thereafter |
|
Deposits | $ | 5,915 |
| | $ | 8,335 |
| | $ | 3,260 |
| | $ | 2,039 |
| | $ | 3,904 |
| | $ | 4,283 |
|
The above maturity table excludes $8.6 billion of demand deposits with no defined maturity. In addition, at June 30, 2015, we had $1.3 billion of broker network deposit sweeps procured through a program arranger who channels brokerage account deposits to us. Unless extended, the contracts associated with these broker network deposit sweeps will terminate in 2015, 2017 and 2019, representing $261 million, $262 million and $795 million, respectively.
NOTE 8. BORROWINGS
|
| | | | | | | | | | | | | | | |
| | | June 30, 2015 | | December 31, 2014 |
($ in millions) | Maturity date | | Amount(a) | | Weighted average interest rate | | Amount(a) | | Weighted average interest rate |
| | | | | | | | | |
Borrowings of consolidated securitization entities | 2016 - 2020 | | $ | 13,948 |
| | 1.3 | % | | $ | 14,967 |
| | 1.2 | % |
Bank term loan | 2019 | | 5,151 |
| | 2.1 | % | | 8,245 |
| | 2.1 | % |
Senior unsecured notes | 2017 - 2024 | | 4,593 |
| | 3.2 | % | | 3,593 |
| | 3.4 | % |
Related party debt | N/A | | — |
| | — | % | | 655 |
| | 4.2 | % |
Total borrowings | | | $ | 23,692 |
| | | | $ | 27,460 |
| | |
| |
(a) | The amounts presented for outstanding borrowings include unamortized debt premiums and discounts. |
Borrowings of Consolidated Securitization Entities
We securitize credit card receivables as an additional source of funding. At June 30, 2015, the maturities of the borrowings of our consolidated securitization entities, for the remainder of 2015 and over the next four years and thereafter were as follows:
|
| | | | | | | | | | | | | | | | | | | | | | | |
($ in millions) | 2015 |
| | 2016 |
| | 2017 |
| | 2018 |
| | 2019 |
| | Thereafter |
|
Borrowings of consolidated securitization entities | $ | 27 |
| | $ | 1,722 |
| | $ | 6,627 |
| | $ | 3,659 |
| | $ | 1,163 |
| | $ | 750 |
|
At June 30, 2015, we had an aggregate of $6.1 billion of undrawn committed capacity under our securitization programs.
During the six months ended June 30, 2015 and 2014, we completed new debt issuances through our securitized entities with proceeds of $2.2 billion and $3.4 billion, respectively.
Third-Party Debt
Bank Term Loan
During the six months ended June 30, 2015, we prepaid $3.1 billion in the aggregate of the Bank Term Loan, which included the use of a portion of the net proceeds from the issuance of senior unsecured notes in February 2015.
Senior Unsecured Notes
On February 2, 2015, we issued a total of $1.0 billion principal amount of senior unsecured notes, comprising $750 million aggregate principal amount of 2.700% senior unsecured notes due 2020, and $250 million aggregate principal amount of floating rate (three-month LIBOR plus 1.23%) senior unsecured notes due 2020. All of the net proceeds from this issuance were used to prepay the Bank Term Loan and GECC Term Loan on a pro rata basis.
On July 23, 2015, we issued a total of $1.0 billion principal amount of 4.500% senior unsecured notes due 2025.
Related Party Debt
During the first quarter of 2015, we prepaid $655 million of the GECC Term Loan, which represented all of the remaining outstanding indebtedness under that agreement, and GECC no longer provides funding to our business.
During the six months ended June 30, 2014, GECC was a key source of funding for our business pursuant to various intercompany funding arrangements.
NOTE 9. FAIR VALUE MEASUREMENTS
For a description of how we estimate fair value, see Note 2. Basis of Presentation and Summary of Significant Accounting Policies in our 2014 annual consolidated and combined financial statements in our 2014 Form 10-K.
The following tables present our assets and liabilities measured at fair value on a recurring basis. Included in the tables are debt and equity securities.
Recurring Fair Value Measurements
The following tables present our assets measured at fair value on a recurring basis.
|
| | | | | | | | | | | | | | | |
At June 30, 2015 ($ in millions) | Level 1 |
| | Level 2 |
| | Level 3 |
| | Total |
|
| | | | | | | |
Assets | | | | | | | |
Investment securities | | | | | | | |
Debt | | | | | | | |
U.S. government and federal agency | $ | — |
| | $ | 3,274 |
| | $ | — |
| | $ | 3,274 |
|
State and municipal | — |
| | — |
| | 54 |
| | 54 |
|
Residential mortgage-backed | — |
| | 339 |
| | — |
| | 339 |
|
Equity | 15 |
| | — |
| | — |
| | 15 |
|
Total | $ | 15 |
| | $ | 3,613 |
| | $ | 54 |
| | $ | 3,682 |
|
| | | | | | | |
At December 31, 2014 ($ in millions) | | | | | | | |
| | | | | | | |
Assets | | | | | | | |
Investment securities | | | | | | | |
Debt | | | | | | | |
U.S. government and federal agency | $ | — |
| | $ | 1,252 |
| | $ | — |
| | $ | 1,252 |
|
State and municipal | — |
| | — |
| | 57 |
| | 57 |
|
Residential mortgage-backed | — |
| | 271 |
| | — |
| | 271 |
|
U.S. corporate | — |
| | — |
| | 3 |
| | 3 |
|
Equity | 15 |
| | — |
| |
|
| | 15 |
|
Total | $ | 15 |
| | $ | 1,523 |
| | $ | 60 |
| | $ | 1,598 |
|
For the six months ended June 30, 2015, there were no securities transferred between Level 1 and Level 2 or between Level 2 and Level 3. At June 30, 2015 and December 31, 2014, we did not have any significant liabilities measured at fair value on a recurring basis.
Our Level 3 recurring fair value measurements primarily relate to state and municipal debt instruments which are valued using non-binding broker quotes or other third-party sources. For a description of our process to evaluate third-party pricing servicers, see Note 2. Basis of Presentation and Summary of Significant Accounting Policies in our 2014 annual consolidated and combined financial statements in our 2014 Form 10-K. Our state and municipal debt securities are classified as available-for-sale with changes in fair value included in accumulated other comprehensive income.
The following table presents the changes in our Level 3 debt instruments that are measured on a recurring basis for the six months ended June 30, 2015 and 2014.
Changes in Level 3 Instruments
|
| | | | | | | | | | | | | | | |
| Three months ended June 30, | | Six months ended June 30, |
($ in millions) | 2015 | | 2014 | | 2015 | | 2014 |
| | | | | | | |
Balance at beginning of period | $ | 55 |
| | $ | 53 |
| | $ | 60 |
| | $ | 46 |
|
Net realized and unrealized gains (losses) | (1 | ) | | 3 |
| | 2 |
| | 4 |
|
Purchases | — |
| | — |
| | — |
| | 8 |
|
Sales | — |
| | — |
| | (6 | ) | | — |
|
Settlements | — |
| | — |
| | (2 | ) | | (2 | ) |
Balance at end of period | $ | 54 |
| | $ | 56 |
| | $ | 54 |
| | $ | 56 |
|
Non-Recurring Fair Value Measurements
We hold certain assets that have been measured at fair value on a non-recurring basis at June 30, 2015 and 2014. These assets can include repossessed assets and cost method investments that are written down to fair value when they are impaired, as well as loan receivables held for sale. Assets that are written down to fair value when impaired are not subsequently adjusted to fair value unless further impairment occurs. The assets held by us that were measured at fair value on a non-recurring basis and the effects of the remeasurement to fair value were not material for all periods presented. The estimated fair value of loan receivables held for sale exceeded their amortized cost and accordingly a remeasurement to fair value was not required during the six months ended June 30, 2015 and 2014.
Financial Assets and Financial Liabilities Carried at Other than Fair Value
|
| | | | | | | | | | | | | | | | | | | |
| Carrying |
| | Corresponding fair value amount |
At June 30, 2015 ($ in millions) | value |
| | Total |
| | Level 1 |
| | Level 2 |
| | Level 3 |
|
Financial Assets | | | | | | | | | |
Financial assets for which carrying values equal or approximate fair value: | | | | | | | | | |
Cash and equivalents(a) | $ | 10,621 |
| | $ | 10,621 |
| | $ | 10,297 |
| | $ | 324 |
| | $ | — |
|
Other assets(b) | $ | 301 |
| | $ | 301 |
| | $ | 301 |
| | $ | — |
| | $ | — |
|
Financial assets carried at other than fair value: | | | | | | | | | |
Loan receivables, net(c) | $ | 58,129 |
| | $ | 64,272 |
| | $ | — |
| | $ | — |
| | $ | 64,272 |
|
| | | | | | | | | |
Financial Liabilities | | | | | | | | | |
Financial liabilities carried at other than fair value: | | | | | | | | | |
Deposits | $ | 37,772 |
| | $ | 38,208 |
| | $ | — |
| | $ | 38,208 |
| | $ | — |
|
Borrowings of consolidated securitization entities | $ | 13,948 |
| | $ | 13,978 |
| | $ | — |
| | $ | 6,980 |
| | $ | 6,998 |
|
Bank term loan | $ | 5,151 |
| | $ | 5,144 |
| | $ | — |
| | $ | — |
| | $ | 5,144 |
|
Senior unsecured notes | $ | 4,593 |
| | $ | 4,602 |
| | $ | — |
| | $ | 4,602 |
| | $ | — |
|
| | | | | | | | | |
| Carrying |
| | Corresponding fair value amount |
At December 31, 2014 ($ in millions) | value |
| | Total |
| | Level 1 |
| | Level 2 |
| | Level 3 |
|
Financial Assets | | | | | | | | | |
Financial assets for which carrying values equal or approximate fair value: | | | | | | | | | |
Cash and equivalents(a) | $ | 11,828 |
| | $ | 11,828 |
| | $ | 8,153 |
| | $ | 3,675 |
| | $ | — |
|
Other assets(b) | $ | 1,104 |
| | $ | 1,104 |
| | $ | 1,104 |
| | $ | — |
| | $ | — |
|
Financial assets carried at other than fair value: | | | | | | | | | |
Loan receivables, net(c) | $ | 58,050 |
| | $ | 64,113 |
| | $ | — |
| | $ | — |
| | $ | 64,113 |
|
Loan receivables held for sale(c) | $ | 332 |
| | $ | 351 |
| | $ | — |
| | $ | — |
| | $ | 351 |
|
| | | | | | | | | |
Financial Liabilities | | | | | | | | | |
Financial liabilities carried at other than fair value: | | | | | | | | | |
Deposits | $ | 34,955 |
| | $ | 35,442 |
| | $ | — |
| | $ | 35,442 |
| | $ | — |
|
Borrowings of consolidated securitization entities | $ | 14,967 |
| | $ | 14,985 |
| | $ | — |
| | $ | 7,912 |
| | $ | 7,073 |
|
Bank term loan | $ | 8,245 |
| | $ | 8,204 |
| | $ | — |
| | $ | — |
| | $ | 8,204 |
|
Senior unsecured notes | $ | 3,593 |
| | $ | 3,660 |
| | $ | — |
| | $ | 3,660 |
| | $ | — |
|
Related party debt | $ | 655 |
| | $ | 655 |
| | $ | — |
| | $ | — |
| | $ | 655 |
|
_______________________
| |
(a) | For cash and cash equivalents carrying value approximates fair value due to the liquid nature and short maturity of these instruments. Cash equivalents classified as Level 2 represent U.S. Government and Federal Agency debt securities with original maturities of three months or less. |
| |
(b) | This balance relates to restricted cash and equivalents, which is included in other assets. |
| |
(c) | Under certain retail partner program agreements, the expected sales proceeds related to the sale of their credit card portfolio may be limited to the amounts owed by our customers, which may be less than the fair value indicated above. |
NOTE 10. REGULATORY AND CAPITAL ADEQUACY
As a savings and loan holding company, we are subject to regulation, supervision and examination by the Federal Reserve Board. We historically have not been required to maintain any specific amount of minimum capital. In connection with our separation from GE and the related application to the Federal Reserve Board, we expect that we will be subject to capital requirements under the applicable U.S. Basel III capital rules. See Note 11. Regulatory and Capital Adequacy to our 2014 annual consolidated and combined financial statements in our 2014 Form 10-K for additional information on these capital requirements.
The Bank is a federally chartered savings association. As such, the Bank is subject to regulation, supervision and examination by the OCC, which is its primary regulator, and by the Consumer Financial Protection Bureau (“CFPB”). In addition, the Bank, as an insured depository institution, is supervised by the Federal Deposit Insurance Corporation and is required to maintain specific amounts of minimum capital.
Failure to meet minimum capital requirements can initiate certain mandatory and, possibly, additional discretionary actions by regulators that, if undertaken, could limit our business activities and have a material adverse effect on our financial statements. Under capital adequacy guidelines, the Bank must meet specific capital guidelines that involve quantitative measures of the Bank’s assets, liabilities and certain off-balance-sheet items as calculated under regulatory accounting practices. The Bank’s capital amounts and classifications are also subject to qualitative judgments by the regulators about components, risk weightings and other factors.
At June 30, 2015 and December 31, 2014, the Bank met all applicable requirements to be deemed well-capitalized pursuant to OCC regulations and for purposes of the Federal Deposit Insurance Act. To be categorized as well-capitalized, the Bank must maintain minimum common equity Tier 1, total risk-based, Tier 1 risk-based, and leverage ratios as set forth in the following table. The Federal Reserve Board and FDIC final rules applicable to the Bank include new minimum and "well-capitalized" risk-based capital and leverage ratios, effective January 1, 2015, and redefine the definition of what constitutes "capital" for purposes of calculating these ratios. There are no conditions or events subsequent to June 30, 2015 that management believes have changed the Bank’s capital category.
The actual capital amounts and ratios and the required minimums of the Bank are as follows:
|
| | | | | | | | | | | | | | | | | | | | |
At June 30, 2015 ($ in millions) | Actual | | Minimum for capital adequacy purposes(b) | | Minimum to be well-capitalized under prompt corrective action provisions |
| Amount | | Ratio(a) | | Amount |
| | Ratio |
| | Amount |
| | Ratio |
|
| | | | | | | | | | | |
Common equity Tier I capital | $ | 7,143 |
| | 16.4 | % | | $ | 1,965 |
| | 4.5 | % | | $ | 2,839 |
| | 6.5 | % |
Total risk-based capital | $ | 7,712 |
| | 17.7 | % | | $ | 3,494 |
| | 8.0 | % | | $ | 4,367 |
| | 10.0 | % |
Tier 1 risk-based capital | $ | 7,143 |
| | 16.4 | % | | $ | 2,620 |
| | 6.0 | % | | $ | 3,494 |
| | 8.0 | % |
Tier 1 leverage | $ | 7,143 |
| | 14.0 | % | | $ | 2,044 |
| | 4.0 | % | | $ | 2,556 |
| | 5.0 | % |
|
| | | | | | | | | | | | | | | | | | | | |
At December 31, 2014 ($ in millions) | Actual | | Minimum for capital adequacy purposes(b) | | Minimum to be well-capitalized under prompt corrective action provisions |
| Amount | | Ratio(a) | | Amount | | Ratio | | Amount | | Ratio |
| | | | | | | | | | | |
Total risk-based capital | $ | 7,100 |
| | 17.1 | % | | $ | 3,322 |
| | 8.0 | % | | $ | 4,152 |
| | 10.0 | % |
Tier 1 risk-based capital | $ | 6,559 |
| | 15.8 | % | | $ | 1,661 |
| | 4.0 | % | | $ | 2,491 |
| | 6.0 | % |
Tier 1 leverage | $ | 6,559 |
| | 13.4 | % | | $ | 1,959 |
| | 4.0 | % | | $ | 2,449 |
| | 5.0 | % |
| |
(a) | Capital ratios are calculated based on the Basel III Standardized Approach framework, subject to applicable transition provisions, as of June 30, 2015 and are calculated based on Basel I capital framework as of December 31, 2014. |
| |
(b) | Under the Bank’s Operating Agreement with the OCC entered into on January 11, 2013, the Bank must maintain minimum levels of capital (calculated in accordance with U.S. Basel I capital rules) as follows (i) Total risk-based capital of 11.0%; (ii) Tier 1 risk-based capital of 7.0%; and (iii) Tier 1 leverage of 6.0%. The Bank's regulatory capital was in excess of these thresholds at June 30, 2015 and December 31, 2014. |
The Bank may pay dividends on its stock, with consent or non-objection from the OCC and the Federal Reserve Board, among other things, if its regulatory capital would not thereby be reduced below the applicable regulatory capital requirements.
NOTE 11. EARNINGS PER SHARE
Basic earnings per share is computed by dividing earnings available to common stockholders by the weighted average number of common shares outstanding for the period. Diluted earnings per share reflects the assumed conversion of all dilutive securities.
The following table presents the calculation of basic and diluted earnings per share:
|
| | | | | | | | | | | | | | | |
| Three months ended June 30, | | Six months ended June 30, |
(in millions, except per share data) | 2015 | | 2014 | | 2015 | | 2014 |
Net earnings | $ | 541 |
| | $ | 472 |
| | $ | 1,093 |
| | $ | 1,030 |
|
| | | | | | | |
Weighted average common shares outstanding, basic | 834 |
| | 705 |
| | 834 |
| | 705 |
|
Effect of dilutive securities | 1 |
| | — |
| | 1 |
| | — |
|
Weighted average common shares outstanding, dilutive | 835 |
| | 705 |
| | 835 |
| | 705 |
|
|
|
| | | | | | |
Earnings per basic common share | $ | 0.65 |
| | $ | 0.67 |
| | $ | 1.31 |
| | $ | 1.46 |
|
Earnings per diluted common share | $ | 0.65 |
| | $ | 0.67 |
| | $ | 1.31 |
| | $ | 1.46 |
|
We have issued certain stock based awards under the Synchrony Financial 2014 Long-Term Incentive Plan. A total of approximately 1 million shares related to these awards were considered anti-dilutive and therefore were excluded from the computation of diluted earnings per share for the three and six months ended June 30, 2015. There were no anti-dilutive securities outstanding during the three and six months period ended June 30, 2014.
NOTE 12. INCOME TAXES
We are included in the consolidated U.S. federal and state income tax returns of GE where applicable, but also file certain separate state and foreign income tax returns. The tax provision is presented on a separate company basis as if we were a separate filer. The effects of tax adjustments and settlements from taxing authorities are presented in our consolidated and combined financial statements in the period to which they relate as if we were a separate filer. Our current obligations for taxes are settled with our parent on an estimated basis and adjusted in later periods in which those settlements are finalized. We recognize the current and deferred tax consequences of all transactions that have been recognized in the financial statements using the provisions of the enacted tax laws. In calculating the provision for interim income taxes, in accordance with Accounting Standards Codification 740, Income Taxes, we apply an estimated annual effective tax rate to year-to-date ordinary income. At the end of each interim period, we estimate the effective tax rate expected to be applicable for the full fiscal year. See “Management's Discussion and Analysis—Critical Accounting Estimates” in our 2014 Form 10-K, for a discussion of the significant judgments and estimates related to income taxes.
The Company is under continuous examination by the Internal Revenue Service (“IRS”) and the tax authorities of various states as part of their audit of GE’s tax returns. The IRS is currently auditing the GE consolidated U.S. income tax returns for 2010 and 2011. In addition, certain issues and refund claims for previous years are still unresolved. We are under examination in various states going back to 2007 as part of their audit of GE’s tax returns. We believe that there are no issues or claims that are likely to significantly impact our results of operations, financial position or cash flows. We further believe that we have made adequate provision for all income tax uncertainties that could result from such examinations.
Tax Sharing and Separation Agreement
In connection with the IPO, we entered into a Tax Sharing and Separation Agreement, (“TSSA”), which governs certain separation-related tax matters between the Company and GE following the IPO. The TSSA governs the allocation of the responsibilities for the taxes of the GE group between GE and the Company. The TSSA also allocates rights, obligations and responsibilities in connection with certain administrative matters relating to the preparation of tax returns and control of tax audits and other proceedings relating to taxes. We provide additional information on the TSSA in our 2014 Form 10-K in Note 15. Income Taxes.
Unrecognized Tax Benefits
|
| | | | | | | |
($ in millions) | June 30, 2015 | | December 31, 2014 |
Unrecognized tax benefits, excluding related interest expense and penalties | $ | 114 |
| | $ | 102 |
|
Portion that, if recognized, would reduce tax expense and effective tax rate(a) | 75 |
| | 68 |
|
Accrued interest on unrecognized tax benefits | 2 |
| | 1 |
|
Accrued penalties on unrecognized tax benefits | — |
| | — |
|
| |
(a) | Includes gross state and local unrecognized tax benefits net of the effects of associated U.S. federal income taxes. Excludes amounts attributable to any related valuation allowances resulting from associated increases in deferred tax assets. |
As a separate public company, we will continue to compute our unrecognized tax benefits on a separate return basis and we will settle our liabilities, as required, in accordance with the TSSA. It is reasonably possible that the gross balance of unrecognized tax benefits may increase or decrease in the next twelve months, however, it is not possible to estimate the amount. The amount of uncertain tax liabilities which may be resolved in the next twelve months is not expected to be material to our results of operations.
NOTE 13. RELATED PARTY TRANSACTIONS
Services Provided by GE
GE and its subsidiaries, including GECC, have provided and continue to provide a variety of services to us.
In connection with the IPO, we entered into various agreements with GE and its affiliates that now govern our relationship with GE and GECC following the IPO. On July 30, 2014, we entered into a Master Agreement with GECC and, for certain limited purposes only, GE (the “Master Agreement”). The Master Agreement sets forth our agreements with GE and GECC relating to the ownership of certain assets and the allocation of certain liabilities in connection with the separation of our company from GECC. It also sets forth other agreements governing our relationship with GECC and its affiliates after the IPO. For more information on agreements with GE and its affiliates, see Note 16. Related Party Transactions to our 2014 annual consolidated and combined financial statements in our 2014 Form 10-K.
Funding Provided by GECC
GECC no longer provides funding to our business. All related party debt owed by the Company to GECC outstanding on the closing date of the IPO was repaid, and GECC provided transitional funding pursuant to the $1.5 billion GECC Term Loan Facility. During the first quarter of 2015, we prepaid all of the remaining outstanding indebtedness provided by the GECC Term Loan.
Prior to the IPO, we used related party debt provided by GECC to meet our funding requirements after taking into account deposits held at the Bank, funding from securitized financings and cash generated from our operations. GECC assessed us an interest cost on a portion of the Parent’s total investment and historically we have reflected that portion as related party debt in the Condensed Consolidated Statements of Financial Position.
The following table sets forth the direct costs, indirect costs and interest expenses related to services and funding provided by GE for the periods indicated.
|
| | | | | | | | | | | | | | | |
($ in millions) | Three months ended June 30, | | Six months ended June 30, |
| 2015 | | 2014 | | 2015 | | 2014 |
Direct costs(a) | $ | 69 |
| | $ | 62 |
| | $ | 151 |
| | $ | 126 |
|
Indirect costs(a) | — |
| | 73 |
| | — |
| | 134 |
|
Interest expense(b) | — |
| | 43 |
| | 4 |
| | 90 |
|
Total expenses for services and funding provided by GECC | $ | 69 |
| | $ | 178 |
| | $ | 155 |
| | $ | 350 |
|
| |
(a) | Direct and indirect costs are included in the other expense line items in our Condensed Consolidated and Combined Statements of Earnings. |
| |
(b) | Included in interest expense in our Condensed Consolidated and Combined Statements of Earnings. |
Direct Costs
Direct costs are costs associated with either services provided directly to us that are centralized at GE or services provided to us by third parties under contracts entered into by GE. These services included the provision of employee benefits and benefit administration; information technology services; telecommunication services; and other services, including leases for vehicles, equipment and facilities. GE allocated the costs associated with these services to us using established allocation methodologies.
Under the Transitional Services Agreement which governs certain services provided by GE to us, all of the costs billed to us by GE subsequent to the IPO are included as a component of direct costs and are at GE’s cost in accordance with historic allocation methodologies.
Indirect Costs
GE and GECC no longer allocate costs to us related to corporate overhead. For periods prior to the IPO, GE and GECC allocated costs to us related to corporate overhead that directly or indirectly benefited our business. These assessments related to information technology, insurance coverage, tax services provided, executive incentive payments, advertising and branding and other functional support. These allocations were determined primarily using our percentage of GECC’s relevant expenses.
Interest Expense
For the six months ended June 30, 2015, interest expense represents interest accruing on the GECC Term Loan. For the three and six months ended June 30, 2014, interest expense represents interest cost assessed to us from GECC’s centralized treasury function based on fixed and floating interest rates, plus funding related costs that include charges for liquidity and other treasury costs.
Other Related Party Transactions
GECC is the servicer and we are the subservicer for one of our securitization entities. We perform substantially all of the servicing functions with respect to this entity pursuant to a subservicing agreement with GECC. The net cost recognized in our Condensed Consolidated and Combined Statements of Earnings in connection with these arrangements is de minimis. See Note 5. Variable Interest Entities.
In addition to the related party activities described above, we have been party to certain cash management and payment processing arrangements with GE and GECC. Historically, most of our cash and equivalents that were not held for purposes of funding the Bank’s liquidity requirements were transferred to GECC on a daily basis and GECC subsequently funded the operating and investing activities of our business as needed. Following the IPO, we no longer transfer cash and equivalents to GECC, other than for purposes of the servicing arrangement discussed above.
GE also makes payments for our payroll, corporate credit card bills and freight expenses through a centralized payment system and we reimburse GE in full for the amounts paid. Such expenses are included in other expense across the relevant categories in our Condensed Consolidated and Combined Statements of Earnings and are directly attributable to our business and our employees.
NOTE 14. LEGAL PROCEEDINGS AND REGULATORY MATTERS
In the normal course of business, from time to time, we have been named as a defendant in various legal proceedings, including arbitrations, class actions and other litigation, arising in connection with our business activities. Certain of the legal actions include claims for substantial compensatory and/or punitive damages, or claims for indeterminate amounts of damages. We are also involved, from time to time, in reviews, investigations and proceedings (both formal and informal) by governmental agencies regarding our business (collectively, “regulatory matters”), which could subject us to significant fines, penalties, obligations to change our business practices or other requirements resulting in increased expenses, diminished income and damage to our reputation. We contest liability and/or the amount of damages as appropriate in each pending matter. In accordance with applicable accounting guidance, we establish an accrued liability for legal and regulatory matters when those matters present loss contingencies which are both probable and estimable.
Legal proceedings and regulatory matters are subject to many uncertain factors that generally cannot be predicted with assurance, and we may be exposed to losses in excess of any amounts accrued.
For some matters, we are able to determine that an estimated loss, while not probable, is reasonably possible. For other matters, including those that have not yet progressed through discovery and/or where important factual information and legal issues are unresolved, we are unable to make such an estimate. We currently estimate that the reasonably possible losses for legal proceedings and regulatory matters, whether in excess of a related accrued liability or where there is no accrued liability, and for which we are able to estimate a possible loss, are immaterial. This represents management’s estimate of possible loss with respect to these matters and is based on currently available information. This estimate of possible loss does not represent our maximum loss exposure. The legal proceedings and regulatory matters underlying the estimate will change from time to time and actual results may vary significantly from current estimates.
Our estimate of reasonably possible losses involves significant judgment, given the varying stages of the proceedings, the existence of numerous yet to be resolved issues, the breadth of the claims (often spanning multiple years), unspecified damages and/or the novelty of the legal issues presented. Based on our current knowledge, we do not believe that we are a party to any pending legal proceeding or regulatory matters that would have a material adverse effect on our condensed consolidated and combined financial condition or liquidity. However, in light of the uncertainties involved in such matters, the ultimate outcome of a particular matter could be material to our operating results for a particular period depending on, among other factors, the size of the loss or liability imposed and the level of our earnings for that period, and could adversely affect our business and reputation.
Below is a description of certain of our legal proceedings and regulatory matters.
Regulatory Matters
On December 10, 2013, we entered into a Consent Order with the CFPB relating to our CareCredit platform, which requires us to pay up to $34.1 million to qualifying customers; provide additional training and monitoring of our CareCredit partners; include provisions in agreements with our CareCredit partners prohibiting charges for certain services not yet rendered; make changes to certain consumer disclosures, application procedures and procedures for resolution of customer complaints; and terminate CareCredit partners that have chargeback rates in excess of certain thresholds. Some of the business practice changes required by the Consent Order are similar to requirements in an Assurance of Discontinuance that we entered into with the Attorney General for the State of New York on June 3, 2013. The payments required by the Consent Order were completed in the second quarter of 2015.
Our settlements with the CFPB and the New York State Attorney General do not preclude other regulators or state attorneys general from seeking additional monetary or injunctive relief with respect to CareCredit.
On June 19, 2014, we entered into a Consent Order with the CFPB (the “2014 CFPB Consent Order”) related to the CFPB’s review of the Bank’s debt cancellation products and its marketing practices in its telesales channel related to those products. The 2014 CFPB Consent Order requires us to refund $56 million to cardholders who enrolled in a debt cancellation product over the telephone from January 2010 to October 2012 ($11 million of which was refunded prior to the 2014 CFPB Consent Order), pay civil money penalties of $3.5 million, and implement a compliance plan related to the sale of “add-on” products to the extent the Bank restarts telesales of such products (which were discontinued in October 2012). In the second quarter of 2015, we completed these consumer refunds.
The 2014 CFPB Consent Order also resolved a separate CFPB investigation related to potential violations of the Equal Credit Opportunity Act as a result of the Bank’s omission of certain Spanish-speaking customers and customers residing in Puerto Rico from certain statement credit and settlement offers that were made to certain delinquent customers. The Bank identified this issue through an audit of its collection operations, reported it to the CFPB and initiated a remediation program. The CFPB referred the issue to the Department of Justice (the “DOJ”), which initiated a civil investigation. At the same time we entered into the 2014 CFPB Consent Order, we entered into a consent order with the DOJ (the “2014 DOJ Consent Order,” and together with the 2014 CFPB Consent Order, the “2014 Consent Orders”) to settle a complaint filed by the DOJ on June 19, 2014 in the United States District Court for the District of Utah that made similar allegations to those alleged in the 2014 CFPB Consent Order. The 2014 DOJ Consent Order was approved by the Court on June 26, 2014. The 2014 DOJ Consent Order is similar to the 2014 CFPB Consent Order and does not impose any additional requirements on us. The 2014 Consent Orders require us to complete our remediation program by providing additional payments, balance credits and balance waivers of approximately $37 million and to update our credit bureau reporting relating to the affected accounts. In the first quarter of 2015, we determined that our remediation program will require us to provide approximately $35 million in additional remediation. At June 30, 2015, we had substantially completed our consumer remediation program, which consisted of approximately $182 million of balance credits and waivers to previously charged-off accounts and $15 million of other credits or payments. This remediation program included $132 million of voluntary remediation completed prior to the 2014 Consent Orders. We estimate that we will fully complete our remediation program in the third quarter of 2015 by providing approximately $4 million of additional remediation. In addition to the consumer remediation, the 2014 Consent Orders require us to implement a fair lending compliance plan (including fair lending reviews, audits and training), which will, in part, be satisfied by our existing compliance processes.
Although we do not believe that the 2014 Consent Orders themselves will have a material adverse effect on our results of operations going forward, we cannot be sure whether the settlements will have an adverse impact on our reputation or whether any similar actions will be brought by state attorneys general or others, all of which could have a material adverse effect on us.
Other Matters
On September 27, 2013, Secure Axcess LLC, filed a complaint against the Bank as well as other defendants in the U.S. District Court for the Eastern District of Texas, for patent infringement related to the Bank’s alleged use of website authenticity technology referred to as “Safe Keys.” The complaint seeks unspecified damages. On September 9, 2014, the U.S. Patent Office instituted two petitions to review the validity of the Secure Axcess patent at issue in the pending litigation and on September 29, 2014, the Court stayed the action pending the resolution of the U.S. Patent Office’s review. On April 13, 2015, at the request of the Bank and several other parties, the U.S. Patent Office instituted a third petition to review the validity of the Secure Axcess patent at issue in the pending litigation. On May 12, 2015, U.S. Patent Office consolidated the Bank’s petition with one of the earlier-filed petitions.
The Bank is a defendant in two putative class actions, and defending a third-party in a third putative class action, alleging claims under the federal Telephone Consumer Protection Act (“TCPA”), where the plaintiffs assert that they received calls on their cellular telephones relating to accounts not belonging to them. In each case, the complaints allege that the Bank placed calls to consumers by an automated telephone dialing system or using a pre-recorded message or automated voice without their consent and seek up to $1,500 for each violation. The amount of damages sought in the aggregate is unspecified. Abdeljalil et al. v. GE Capital Retail Bank was filed on August 22, 2012 in the U.S. District Court for the Southern District of California, originally naming GECC as the defendant. In August 2013, the Court denied without prejudice GECC’s motion to dismiss the class allegations. GECC subsequently was dismissed and the plaintiffs amended the complaint to name the Bank as the defendant. On March 26, 2015, the Court entered an order granting class certification under Federal Rule of Civil Procedure 23(b)(3) (for damages) and denying class certification under Federal Rule of Civil Procedure 23(b)(2) (for injunctive relief). The Bank is seeking reconsideration of the order. Hofer et al. v. Synchrony Bank was filed on November 4, 2014 in the U.S. District Court for the Eastern District of Missouri. Dubanoski et al. v. Wal-Mart Stores, Inc., for which we are defending the defendant, was filed on February 27, 2015 in the United States District Court for the Northern District of Illinois. In addition to the Abdeljalil, Hofer, and Dubanoski actions, the Bank has resolved four other putative class actions that made similar claims under the TCPA on an individual basis with the class representative. Travaglio et al. v. GE Capital Retail Bank and Allied Interstate LLC was filed on January 17, 2014 in the U.S. District Court for the Middle District of Florida and dismissed on October 9, 2014. Fitzhenry v. Lowe’s Companies Inc. and GE Capital Retail Bank was filed on May 29, 2014 in the U.S. District Court for the District of South Carolina and dismissed on October 20, 2014. Cowan v. GE Capital Retail Bank was filed on May 14, 2014 in the U.S. District Court for the District of Connecticut and dismissed on July 8, 2015. Pittman et al. v. GE Capital d/b/a GE Capital Retail Bank was filed on July 29, 2014 in the U.S. District Court for the Northern District of Alabama; the parties are in the process of finalizing the settlement and having the case dismissed.
On October 30, 2014, the United States Trustee, which is part of the DOJ, filed an application in In re Nyree Belton, a Chapter 7 bankruptcy case pending in the U.S. Bankruptcy Court for the Southern District of New York for orders authorizing discovery of the Bank pursuant to Rule 2004 of the Federal Rules of Bankruptcy Procedure, related to an investigation of the Bank’s credit reporting. The discovery, which is ongoing, concerns allegations made in Belton et al. v. GE Capital Consumer Lending, a putative class action adversary proceeding pending in the same Bankruptcy Court. In the Belton adversary proceeding, which was filed on April 30, 2014, plaintiff alleges that the Bank violates the discharge injunction under Section 524(a)(2) of the Bankruptcy Code by attempting to collect discharged debts and by failing to update and correct credit information to credit reporting agencies to show that such debts are no longer due and owing because they have been discharged in bankruptcy. Plaintiff seeks declaratory judgment, injunctive relief and an unspecified amount of damages. On December 15, 2014, the Court entered an order staying the adversary proceeding pending the appeal of an order denying the Bank’s motion to compel arbitration.
ITEM 3. QUANTITATIVE AND QUALITATIVE DISCLOSURES ABOUT MARKET RISK
Market risk refers to the risk that a change in the level of one or more market prices, rates, indices, correlations or other market factors will result in losses for a position or portfolio. We are exposed to market risk primarily from changes in interest rates.
The interest rate benchmark for our liquidity portfolio is the short-term U.S. Treasury rate or the federal funds rate. The interest rate benchmark for our floating rate loan receivables is the prime rate and the interest rate benchmark for our floating rate liabilities is generally either LIBOR or the federal funds rate.
Assuming an immediate 100 basis point increase in the interest rates affecting all interest rate sensitive assets and liabilities at June 30, 2015, we estimate that net interest income over the following 12-month period would increase by approximately $76 million.
For an additional discussion of our exposure to market risk, refer to “Management's Discussion and Analysis—Quantitative and Qualitative Disclosures about Market Risk” in our 2014 Form 10-K.
ITEM 4. CONTROLS AND PROCEDURES
Under the direction of our Chief Executive Officer and Chief Financial Officer, we evaluated our disclosure controls and procedures, and our Chief Executive Officer and Chief Financial Officer concluded that our disclosure controls and procedures were effective as of June 30, 2015.
No change in internal control over financial reporting occurred during the quarter ended June 30, 2015 that has materially affected, or is reasonably likely to materially affect, our internal control over financial reporting.
PART II. OTHER INFORMATION
ITEM 1. LEGAL PROCEEDINGS
For a description of legal proceedings, see Note 14. Legal Proceedings and Regulatory Matters to our condensed consolidated and combined financial statements in Part 1, Item 1 of this Quarterly Report on Form 10-Q.
ITEM 1A. RISK FACTORS
There have been no material changes to the risk factors included in our 2014 Form 10-K under the heading “Risk Factors.”
ITEM 2. UNREGISTERED SALES OF EQUITY SECURITIES AND USE OF PROCEEDS
None.
ITEM 3. DEFAULTS UPON SENIOR SECURITIES
None.
ITEM 4. MINE SAFETY DISCLOSURES
Not applicable.
ITEM 5. OTHER INFORMATION
None.
ITEM 6. EXHIBITS
See “Exhibit Index” for documents filed herewith and incorporated herein by reference.
Signatures
Pursuant to the requirements of the Securities Exchange Act of 1934, the registrant has duly caused this report to be signed on its behalf by the undersigned thereunto duly authorized.
Synchrony Financial
(Registrant)
|
| | |
July 31, 2015 | | /s/ Brian D. Doubles |
Date | | Brian D. Doubles Executive Vice President and Chief Financial Officer (Duly Authorized Officer and Principal Financial Officer) |
EXHIBIT INDEX
|
| |
Exhibit Number | Description |
4* | Instruments defining rights of holders of long-term debt |
10.1 | Form of Synchrony Financial Restoration Plan (incorporated by reference to Exhibit 10.1 of the Current Report on Form 8-K filed by Synchrony Financial on May 27, 2015) |
10.2 | Form of Synchrony Financial Executive Severance Plan (incorporated by reference to Exhibit 10.2 of the Current Report on Form 8-K filed by Synchrony Financial on May 27, 2015) |
10.3 | Form of Synchrony Financial Change in Control Severance Plan (incorporated by reference to Exhibit 10.3 of the Current Report on Form 8-K filed by Synchrony Financial on May 27, 2015) |
12.1 | Statement of Ratio of Earnings to Fixed Charges |
31(a) | Certification Pursuant to Rules 13a-14(a) or 15d-14(a) under the Securities Exchange Act of 1934, as Amended. |
31(b) | Certification Pursuant to Rules 13a-14(a) or 15d-14(a) under the Securities Exchange Act of 1934, as Amended. |
32 | Certification Pursuant to 18 U.S.C. Section 1350. |
101 | The following materials from Synchrony Financial’s Quarterly Report on Form 10-Q for the quarter ended June 30, 2015, formatted in XBRL (eXtensible Business Reporting Language); (i) Condensed Consolidated and Combined Statements of Earnings for the three and six months ended June 30, 2015 and 2014, (ii) Condensed Consolidated and Combined Statements of Comprehensive Income for the three and six months ended June 30, 2015 and 2014, (iii) Condensed Consolidated Statements of Financial Position at June 30, 2015 and December 31, 2014, (iv) Condensed Consolidated and Combined Statements of Changes in Equity for the six months ended June 30, 2015 and 2014, (v) Condensed Consolidated and Combined Statements of Cash Flows for the six months ended June 30, 2015 and 2014, and (vi) Notes to Condensed Consolidated and Combined Financial Statements. |
______________________
| |
(*) | Pursuant to Item 601(4)(iii) of Regulation S-K, the Company is not required to file any instrument with respect to long-term debt not being registered if the total amount of securities authorized thereunder does not exceed 10 percent of the total assets of the Company and its subsidiaries on a consolidated basis. The Company hereby agrees to furnish a copy of any such instrument to the SEC upon request. |